Talladega, AL (Alabama) Houses and Residents
| Talladega: | $104,899 |
| Alabama: | $200,900 |
Mean price in 2022:
Detached houses: $153,117
Here: $153,117 State: $273,076 Townhouses or other attached units: $119,130
Here: $119,130 State: $222,857 Mobile homes: $58,889
Here: $58,889 State: $77,780
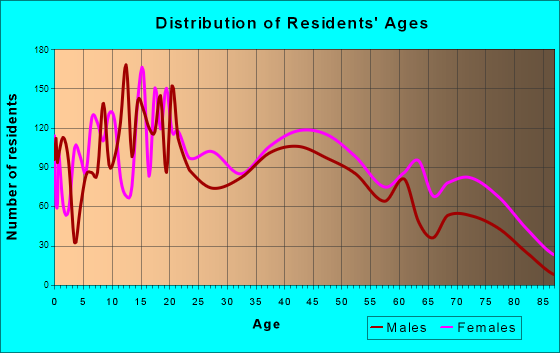
Total population: 16,012 (Urban population: 12,771 (all inside urban clusters), Rural population: 2,189 (7 farm, 2,182 nonfarm))
Houses: 6,554 (5,313 occupied: 3,045 owner occupied, 2,581 renter occupied)
| % of renters here: | 46% |
| State: | 30% |
Housing density: 275 houses/condos per square mile
Median price asked for vacant for-sale houses and condos in 2022: $170,850.
Median contract rent in 2022: $479 (lower quartile is $306, upper quartile is $523)
Median rent asked for vacant for-rent units in 2022: $1,041
Median gross rent in Talladega, AL in 2022: $665
Housing units in Talladega with a mortgage: 1,275 (166 second mortgage, 0 home equity loan, 153 both second mortgage and home equity loan)
Houses without a mortgage: 0
Median household income for houses/condos with a mortgage: $81,287
Median household income for apartments without a mortgage: $49,773
Median monthly housing costs: $644
Compare current foreclosures in Talladega, AL:
| Photo | Address | Area | Beds / Baths | Price | Details |
|---|---|---|---|---|---|

|
#1
Blue Ridge Dr
Talladega, AL 35160
|
2,513 sq. feet
|
2 baths 4 beds |
$222,300
|
show details |

|
#2
Glenwood Rd
Talladega, AL 35160
|
1,700 sq. feet
|
2 baths 2 beds |
show details | |

|
#3
Community Rd
Talladega, AL 35160
|
1,252 sq. feet
|
2 baths - beds |
show details | |

|
#4
Green Tree Dr
Talladega, AL 35160
|
- sq. feet
|
2 baths 3 beds |
show details | |

|
#5
Howell Cove Rd
Talladega, AL 35160
|
1,450 sq. feet
|
1 baths - beds |
show details | |

|
#6
Arrowhead Ln
Talladega, AL 35160
|
1,876 sq. feet
|
1 baths - beds |
show details | |

|
#7
Stemley Rd
Talladega, AL 35160
|
960 sq. feet
|
1 baths - beds |
show details | |

|
#8
Forest Hills Cir
Talladega, AL 35160
|
1,872 sq. feet
|
1 baths - beds |
show details | |

|
#9
County Park Ln
Talladega, AL 35160
|
1,650 sq. feet
|
1 baths - beds |
show details | |

|
#10
Howell Cove Rd
Talladega, AL 35160
|
1,776 sq. feet
|
1 baths - beds |
show details |
| Photo | Address | Area | Beds / Baths | Price | Details |
|---|---|---|---|---|---|

|
#11
Cloudmont Ln
Talladega, AL 35160
|
2,907 sq. feet
|
2 baths - beds |
show details | |

|
#12
Pinehurst Dr
Talladega, AL 35160
|
2,437 sq. feet
|
1 baths - beds |
show details | |

|
#13
Campbell Ln
Talladega, AL 35160
|
2,806 sq. feet
|
1 baths - beds |
show details | |

|
#14
Scott St
Talladega, AL 35160
|
1,368 sq. feet
|
1 baths - beds |
show details | |

|
#15
Coosa St W
Talladega, AL 35160
|
888 sq. feet
|
1 baths - beds |
show details | |

|
#16
W Damon Ave
Talladega, AL 35160
|
1,986 sq. feet
|
1 baths - beds |
show details | |

|
#17
Debbie St
Talladega, AL 35160
|
1,248 sq. feet
|
1 baths - beds |
show details | |

|
#18
Pine Point Ln
Talladega, AL 35160
|
2,704 sq. feet
|
1 baths - beds |
show details | |

|
#19
Allen St
Talladega, AL 35160
|
996 sq. feet
|
1 baths - beds |
show details | |

|
#20
Lawler Cir
Talladega, AL 35160
|
1,548 sq. feet
|
1 baths - beds |
show details |
| Photo | Address | Area | Beds / Baths | Price | Details |
|---|---|---|---|---|---|

|
#21
Brignola St
Talladega, AL 35160
|
2,658 sq. feet
|
1 baths - beds |
show details | |

|
#22
Green Acres Dr
Talladega, AL 35160
|
1,434 sq. feet
|
1 baths - beds |
show details | |

|
#23
Morgan St
Talladega, AL 35160
|
1,229 sq. feet
|
1 baths - beds |
show details | |

|
#24
Dogwood Cir
Talladega, AL 35160
|
2,031 sq. feet
|
1 baths - beds |
show details | |

|
#25
Green Tree Dr
Talladega, AL 35160
|
1,276 sq. feet
|
1 baths - beds |
show details | |

|
#26
Brian St
Talladega, AL 35160
|
1,985 sq. feet
|
2 baths - beds |
show details | |

|
#27
Rock Church Rd
Talladega, AL 35160
|
1,056 sq. feet
|
1 baths - beds |
show details | |

|
#28
Stemley Rd
Talladega, AL 35160
|
- sq. feet
|
- baths - beds |
show details | |

|
#29
Roberson Rd
Talladega, AL 35160
|
- sq. feet
|
- baths - beds |
show details | |

|
#30
Broadway Ave Apt 228a
Talladega, AL 35160
|
- sq. feet
|
- baths - beds |
show details |
| Photo | Address | Area | Beds / Baths | Price | Details |
|---|---|---|---|---|---|

|
#31
Al Highway 77, Lot 0
Talladega, AL 35160
|
- sq. feet
|
- baths - beds |
show details | |

|
#32
Jackson Trace Rd
Talladega, AL 35160
|
- sq. feet
|
- baths - beds |
show details | |

|
#33
Red Ln
Talladega, AL 35160
|
- sq. feet
|
- baths - beds |
show details | |

|
#34
Curry Ct
Talladega, AL 35160
|
- sq. feet
|
- baths - beds |
show details | |

|
#35
Eastwood Ave
Talladega, AL 35160
|
- sq. feet
|
- baths - beds |
show details | |

|
#36
Shannon Lynn Shrs
Talladega, AL 35160
|
- sq. feet
|
- baths - beds |
show details | |

|
#37
Broadway Ave Apt 2
Talladega, AL 35160
|
- sq. feet
|
- baths - beds |
show details | |

|
#38
Diamond Ln
Talladega, AL 35160
|
- sq. feet
|
- baths - beds |
show details | |

|
#39
Green Tree Dr
Talladega, AL 35160
|
- sq. feet
|
- baths - beds |
show details | |

|
#40
Cedar St Apt B
Talladega, AL 35160
|
- sq. feet
|
- baths - beds |
show details |
| Photo | Address | Area | Beds / Baths | Price | Details |
|---|---|---|---|---|---|

|
#41
Al Highway 77, Apt 305
Talladega, AL 35160
|
- sq. feet
|
- baths - beds |
show details | |

|
#42
Anjill St
Talladega, AL 35160
|
- sq. feet
|
- baths - beds |
show details | |

|
#43
Booker St
Talladega, AL 35160
|
- sq. feet
|
- baths - beds |
show details | |

|
#44
Knoxville Homes
Talladega, AL 35160
|
- sq. feet
|
- baths - beds |
show details | |

|
#45
Redwood Dr
Talladega, AL 35160
|
- sq. feet
|
- baths - beds |
show details | |

|
#46
Hobson Ave
Talladega, AL 35160
|
1,065 sq. feet
|
- baths - beds |
show details | |

|
#47
Allison Mill Rd
Talladega, AL 35160
|
- sq. feet
|
- baths - beds |
show details | |

|
#48
Fairway Dr
Talladega, AL 35160
|
1,288 sq. feet
|
- baths - beds |
show details | |

|
#49
Wilson St
Talladega, AL 35160
|
- sq. feet
|
- baths - beds |
show details | |

|
Check over 1 million property listings on Foreclosure.com!
|
browse all offers | |||

Latest news about housing in Talladega, AL collected exclusively by city-data.com from local newspapers, TV, and radio stations

 | Alabama Housing Market (2 replies) |
| What are we missing about the Huntsville area? (36 replies) |
| How would you solve the rural poverty? (193 replies) |
| Alabama finally growing? (146 replies) |
| I-65 Montgomery to Birmingham (11 replies) |
| Several cities may lose "metropolitan" status (30 replies) |
Median year apartment built: 1973
Household type by relationship:
Households: 14,996- Male householders: 2,051 (580 living alone), Female householders: 3,173 (971 living alone)
1,664 spouses (1,664 opposite-sex spouses), 231 unmarried partners, (231 opposite-sex unmarried partners), 3,152 children (2,988 natural, 121 adopted, 42 stepchildren), 691 grandchildren, 94 brothers or sisters, 132 parents, 152 foster children, 186 other relatives, 705 non-relatives
- In group quarters: 2,760
Size of family households: 1,793 2-persons, 887 3-persons, 864 4-persons, 262 5-persons, 75 6-persons, 21 7-or-more-persons.
Size of nonfamily households: 1,299 1-person, 254 2-persons, 33 3-persons, 82 5-persons.
707 married couples with children.
1,198 single-parent households (55 men, 1,143 women).
93.3% of residents of Talladega speak English at home.
5.5% of residents speak Spanish at home (42% speak English very well, 40% speak English well, 16% speak English not well, 2% don't speak English at all).
0.5% of residents speak other Indo-European language at home (62% speak English very well, 38% speak English not well).
0.1% of residents speak Asian or Pacific Island language at home (100% speak English very well).
0.4% of residents speak other language at home (85% speak English very well, 15% speak English not well).
Foreign born population: 449 (3.0%)
(44.1% of them are naturalized citizens)
| Here: | 6.4 |
| State: | 6.5 |
| Here: | 5.3 |
| State: | 4.7 |

- Bedrooms in owner-occupied houses and condos in Talladega, Alabama
- 10no bedroom
- 131 bedroom
- 4132 bedrooms
- 1,9133 bedrooms
- 6104 bedrooms
- 885+ bedrooms

- Bedrooms in renter-occupied apartments in Talladega, Alabama
- 140no bedroom
- 3471 bedroom
- 9122 bedrooms
- 1,0363 bedrooms
- 964 bedrooms
- 495+ bedrooms

- Cars and other vehicles available in Talladega in owner-occupied houses/condos
- 212no vehicle
- 9891 vehicle
- 9372 vehicles
- 5293 vehicles
- 2494 vehicles
- 1305+ vehicles

- Cars and other vehicles available in Talladega in renter-occupied apartments
- 410no vehicle
- 1,3021 vehicle
- 5802 vehicles
- 1443 vehicles
- 1464 vehicles
- 05+ vehicles

- Rooms in owner-occupied houses in Talladega, Alabama
- 101 room
- 132 rooms
- 173 rooms
- 1694 rooms
- 6075 rooms
- 8766 rooms
- 4097 rooms
- 3798 rooms
- 5669+ rooms

- Rooms in renter-occupied apartments in Talladega, Alabama
- 1331 room
- 92 rooms
- 3763 rooms
- 5654 rooms
- 5635 rooms
- 5406 rooms
- 2507 rooms
- 1328 rooms
- 159+ rooms


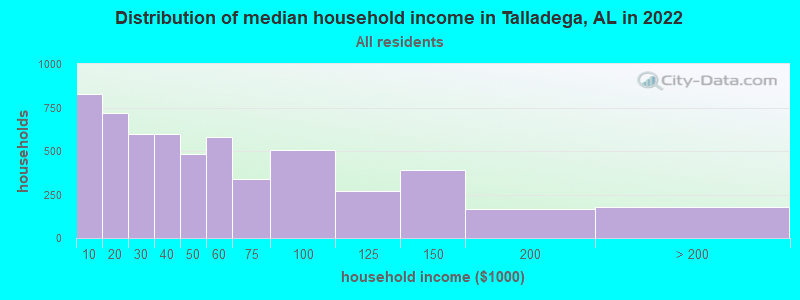
Talladega, AL household income distribution

- 830Less than $10,000
- 718$10,000 to $19,999
- 599$20,000 to $29,999
- 595$30,000 to $39,999
- 485$40,000 to $49,999
- 582$50,000 to $59,999
- 340$60,000 to $74,999
- 508$75,000 to $99,999
- 269$100,000 to $124,999
- 390$125,000 to $149,999
- 168$150,000 to $199,999
- 176$200,000 or more
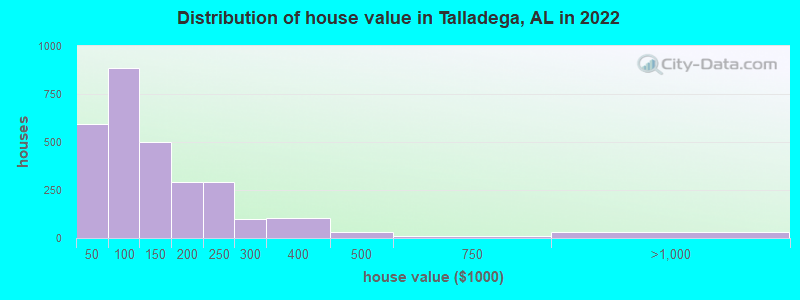
Home value of owner - occupied houses in 2022 in Talladega, AL
-
- 266Less than $10,000
- 53$10,000 to $14,999
- 31$15,000 to $19,999
- 37$20,000 to $24,999
- 13$25,000 to $29,999
- 69$30,000 to $34,999
- 121$40,000 to $49,999
- 136$50,000 to $59,999
- 83$60,000 to $69,999
- 58$70,000 to $79,999
- 242$80,000 to $89,999
- 243$90,000 to $99,999
- 307$100,000 to $124,999
- 189$125,000 to $149,999
- 166$150,000 to $174,999
- 123$175,000 to $199,999
- 292$200,000 to $249,999
- 99$250,000 to $299,999
- 103$300,000 to $399,999
- 30$400,000 to $499,999
- 9$500,000 to $749,999
- 14$750,000 to $999,999
- 8$1,000,000 to $1,499,999
- 5$2,000,000 or more
Rent paid by renters in 2022 in Talladega, AL
-
- 115Less than $100
- 162$100 to $149
- 127$150 to $199
- 142$200 to $249
- 51$250 to $299
- 103$300 to $349
- 129$350 to $399
- 233$400 to $449
- 181$450 to $499
- 345$500 to $549
- 164$550 to $599
- 161$600 to $649
- 90$650 to $699
- 32$700 to $749
- 65$750 to $799
- 107$800 to $899
- 23$900 to $999
- 10$1,000 to $1,249
- 27$1,500 to $1,999
- 8$2,500 to $2,999
- 159No cash rent


Percentage of workers working in this county: 72.9%
Number of people working at home: 137 (2.9% of all workers)

Travel time to work (commute)
- Less than 5 minutes: 72
- 5 to 9 minutes: 1,013
- 10 to 14 minutes: 700
- 15 to 19 minutes: 343
- 20 to 24 minutes: 557
- 25 to 29 minutes: 361
- 30 to 34 minutes: 902
- 35 to 39 minutes: 62
- 40 to 44 minutes: 115
- 45 to 59 minutes: 239
- 60 to 89 minutes: 213
- 90 or more minutes: 163
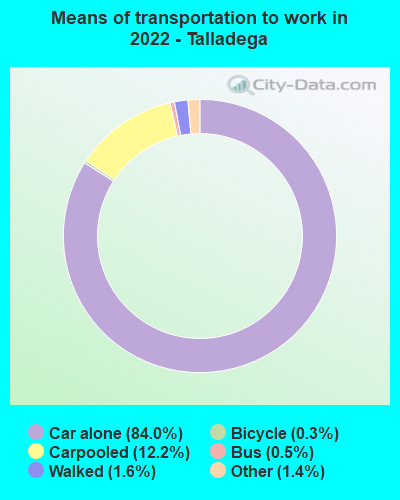
Means of transportation to work:
- Drove a car alone: 6,256 (80.5%)
- Carpooled: 918 (11.8%)
- Bus: 36 (0.5%)
- Taxi: 134 (1.7%)
- Bicycle: 16 (0.2%)
- Walked: 127 (1.6%)
- Worked at home: 137 (1.8%)

- Unemployment by race in 2022
- Unemployment rate for White non-Hispanic residents
- 6.3%Males
- 8.9%Females
- Unemployment rate for Black residents
- 9.5%Males
- 10.9%Females
- Unemployment rate for other race residents
- 48.9%Males
- Unemployment rate for two or more race residents
- 11.1%Females
- Unemployment rate for Hispanic or Latino residents
- 60.8%Males

- Year of entry for the foreign-born population in Talladega, Alabama
- 2392010 or later
- 272000 to 2009
- 751990 to 1999
- 131980 to 1989
- 191970 to 1979
- 22Before 1970

First ancestries reported:
- American: 1,536 (16.9%)
- English: 489 (5.4%)
- Irish: 389 (4.3%)
- Scottish: 226 (2.5%)
- African: 83 (0.9%)
- German: 61 (0.7%)
- European: 41 (0.5%)
- Italian: 32 (0.4%)
- Norwegian: 26 (0.3%)
- Haitian: 15 (0.2%)
- Dutch: 12 (0.1%)
- French Canadian: 9 (0.10%)
- Scotch-Irish: 7 (0.08%)
- British: 4 (0.04%)
- West Indian: 4 (0.04%)
- Ghanaian: 3 (0.03%)
- Russian: 2 (0.02%)
Most common places of birth for foreign-born residents (%):
| Talladega: | 68.0% (321) |
| Alabama: | 26.4% (46,832) |
| Talladega: | 5.7% (27) |
| Alabama: | 2.3% (4,000) |
| Talladega: | 5.5% (26) |
| Alabama: | 1.7% (3,005) |
| Talladega: | 3.0% (14) |
| Alabama: | 0.3% (477) |
| Talladega: | 2.8% (13) |
| Alabama: | 0.7% (1,277) |
| Talladega: | 2.1% (10) |
| Alabama: | 0.5% (820) |
| Talladega: | 1.9% (9) |
| Alabama: | 1.0% (1,740) |
| Talladega: | 1.7% (8) |
| Alabama: | 3.9% (6,831) |
| Talladega: | 1.7% (8) |
| Alabama: | 1.2% (2,134) |
| Talladega: | 1.7% (8) |
| Alabama: | 0.2% (324) |
Place of birth for U.S.-born residents:
- This state: 11,680
- Other state: 2,781
- Northeast: 176
- Midwest: 528
- South: 1,742
- West: 311
76.6% of Talladega residents lived in the same house 1 years ago.
Out of people who lived in different houses, 34.5% lived in this county.
Out of people who lived in different counties, 75.7% lived in Alabama.
| Talladega: | 76.6% |
| State average: | 87.6% |
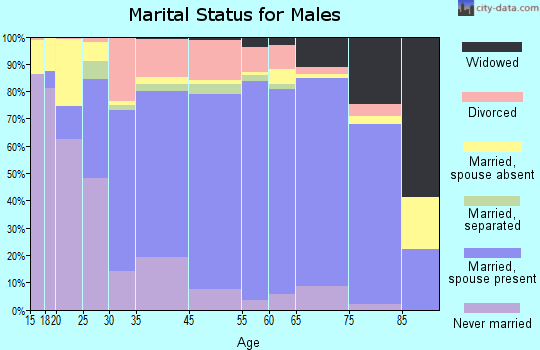
Education attainment for males 25 years and older:
- No schooling: 154
- Nursery to 4th grade: 27
- 5th and 6th grade: 275
- 7th and 8th grade: 114
- 9th grade: 47
- 10th grade: 479
- 11th grade: 330
- 12th grade, no diploma: 144
- High school graduate (or equivalency): 2,048
- Less than 1 year of college: 227
- Some college more than 1 year, no degree: 492
- Associate degree: 271
- Bachelor's degree: 479
- Master's degree: 96
- Professional school degree: 28
- Doctorate degree: 28

Education attainment for females 25 years and older:
- No schooling: 187
- Nursery to 4th grade: 8
- 5th and 6th grade: 3
- 7th and 8th grade: 67
- 9th grade: 102
- 10th grade: 349
- 11th grade: 120
- 12th grade, no diploma: 251
- High school graduate (or equivalency): 1,857
- Less than 1 year of college: 259
- Some college more than 1 year, no degree: 779
- Associate degree: 408
- Bachelor's degree: 499
- Master's degree: 259
- Professional school degree: 19
- Doctorate degree: 14

Housing units in structures:
- One, detached: 4,526
- One, attached: 25
- Two: 574
- 3 or 4: 306
- 5 to 9: 308
- 10 to 19: 130
- 20 to 49: 129
- 50 or more: 58
- Mobile homes: 493
Median worth of mobile homes: $15,808
Housing units lacking complete kitchen facilities in 2022: 10.0%
House/condo owner moved in on average 19 years ago
Renter moved in on average 2 years ago

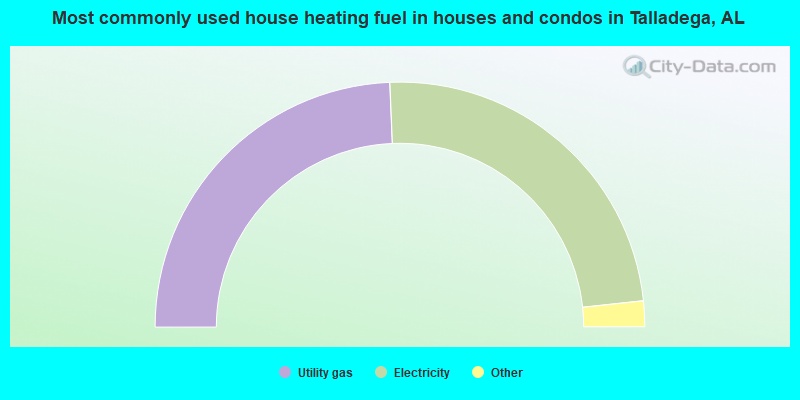
- 48.7%Utility gas
- 47.9%Electricity
- 1.3%Bottled, tank, or LP gas
- 1.1%Wood
- 1.1%No fuel used
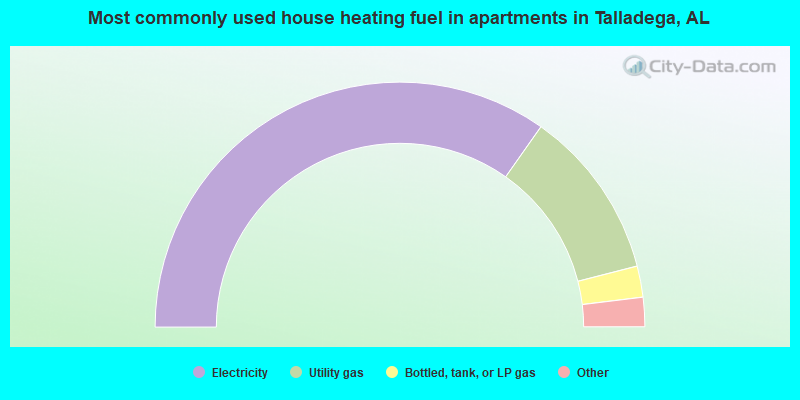
- 69.6%Electricity
- 22.5%Utility gas
- 4.1%Bottled, tank, or LP gas
- 2.6%No fuel used
- 1.2%Wood
Private vs. public school enrollment:
| Here: | 7.1% |
| Alabama: | 14.7% |
| Here: | 4.7% |
| Alabama: | 16.3% |
| Here: | 56.6% |
| Alabama: | 14.6% |


