Tehachapi, CA (California) Houses and Residents
| Tehachapi: | $375,509 |
| California: | $715,900 |
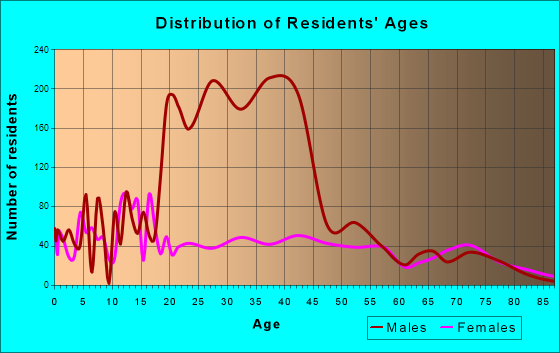
Total population: 13,236 (Urban population: 10,742 (all inside urban clusters), Rural population: 135 (all nonfarm))
Houses: 4,053 (3,718 occupied: 2,314 owner occupied, 1,429 renter occupied)
| % of renters here: | 38% |
| State: | 44% |
Housing density: 423 houses/condos per square mile
Median price asked for vacant for-sale houses and condos in 2022 in this county: $350,791.
Median contract rent in 2022: $995 (lower quartile is $727, upper quartile is $1,282)
Median rent asked for vacant for-rent units in 2022: $1,202
Median gross rent in Tehachapi, CA in 2022: $1,212
Housing units in Tehachapi with a mortgage: 1,367 (97 second mortgage, 0 home equity loan, 91 both second mortgage and home equity loan)
Houses without a mortgage: 0
Median household income for houses/condos with a mortgage: $96,380
Median household income for apartments without a mortgage: $39,076
Median monthly housing costs: $1,186
Compare current foreclosures near Tehachapi, CA:
| Photo | Address | Area | Beds / Baths | Price | Details |
|---|---|---|---|---|---|

|
#1
Scarlet Oak Dr
Tehachapi, CA 93561
|
1,716 sq. feet
|
2 baths 3 beds |
show details | |

|
#2
Georgia St
Tehachapi, CA 93561
|
3,533 sq. feet
|
2 baths 4 beds |
show details | |

|
#3
Brook Dr
Tehachapi, CA 93561
|
1,429 sq. feet
|
2 baths 3 beds |
show details | |

|
#4
Moon Dr
Tehachapi, CA 93561
|
1,873 sq. feet
|
2 baths 3 beds |
show details | |

|
#5
N Lower Valley Rd
Tehachapi, CA 93561
|
2,266 sq. feet
|
2 baths 3 beds |
show details | |

|
#6
Shoreline Ct
Tehachapi, CA 93561
|
2,733 sq. feet
|
4 baths 5 beds |
show details | |

|
#7
Hickory Ave
Tehachapi, CA 93561
|
1,908 sq. feet
|
2 baths 4 beds |
show details | |

|
#8
Tulip Ct
Tehachapi, CA 93561
|
1,727 sq. feet
|
3 baths 3 beds |
show details | |

|
#9
Pegasus St
Tehachapi, CA 93561
|
1,428 sq. feet
|
2 baths 3 beds |
show details | |

|
#10
Mulberry St
Tehachapi, CA 93561
|
1,996 sq. feet
|
2 baths 4 beds |
show details |
| Photo | Address | Area | Beds / Baths | Price | Details |
|---|---|---|---|---|---|

|
#11
Canyon Dr E
Tehachapi, CA 93561
|
1,517 sq. feet
|
2 baths 3 beds |
show details | |

|
#12
Harness Dr
Tehachapi, CA 93561
|
1,680 sq. feet
|
2 baths 3 beds |
show details | |

|
#13
Brassie Ct
Tehachapi, CA 93561
|
2,404 sq. feet
|
3 baths 4 beds |
show details | |

|
#14
Wild Olive Rd
Tehachapi, CA 93561
|
2,478 sq. feet
|
2 baths 4 beds |
show details | |

|
#15
E Tehachapi Blvd
Tehachapi, CA 93561
|
1,456 sq. feet
|
2 baths 3 beds |
show details | |

|
#16
William Tell Ct
Tehachapi, CA 93561
|
1,402 sq. feet
|
2 baths 3 beds |
show details | |

|
#17
Maple St
Tehachapi, CA 93561
|
- sq. feet
|
- baths - beds |
show details | |

|
#18
N Mill St Apt 35
Tehachapi, CA 93561
|
- sq. feet
|
- baths - beds |
show details | |

|
#19
Tin Ct # 3
Tehachapi, CA 93561
|
- sq. feet
|
- baths - beds |
show details | |

|
#20
Tucker Rd, Ste G Pmb 444
Tehachapi, CA 93561
|
- sq. feet
|
- baths - beds |
show details |
| Photo | Address | Area | Beds / Baths | Price | Details |
|---|---|---|---|---|---|

|
#21
Devil Diver Ct
Tehachapi, CA 93561
|
- sq. feet
|
- baths - beds |
show details | |

|
#22
N Mill St Apt 20
Tehachapi, CA 93561
|
- sq. feet
|
- baths - beds |
show details | |

|
#23
Brook Dr Apt D
Tehachapi, CA 93561
|
- sq. feet
|
- baths - beds |
show details | |

|
#24
Brook Dr Apt F
Tehachapi, CA 93561
|
- sq. feet
|
- baths - beds |
show details | |

|
#25
Edwin St
Mojave, CA 93501
|
2,920 sq. feet
|
2 baths 6 beds |
show details | |

|
#26
Address
Mojave, CA 93501
|
- sq. feet
|
- baths - beds |
$1
|
show details |

|
#27
Del Norte Dr
Mojave, CA 93501
|
1,440 sq. feet
|
2 baths 3 beds |
show details | |

|
#28
Back Canyon Rd
Caliente, CA 93518
|
- sq. feet
|
- baths - beds |
show details | |

|
#29
Edwin St
Mojave, CA 93501
|
- sq. feet
|
- baths - beds |
show details | |

|
Check over 1 million property listings on Foreclosure.com!
|
browse all offers | |||

Latest news about housing in Tehachapi, CA collected exclusively by city-data.com from local newspapers, TV, and radio stations


Median year apartment built: 1978
Household type by relationship:
Households: 12,985- Male householders: 1,898 (676 living alone), Female householders: 1,803 (731 living alone)
1,643 spouses (1,643 opposite-sex spouses), 212 unmarried partners, (212 opposite-sex unmarried partners), 2,950 children (2,755 natural, 21 adopted, 173 stepchildren), 248 grandchildren, 69 brothers or sisters, 80 parents, 0 foster children, 80 other relatives, 289 non-relatives
- In group quarters: 3,708
Size of family households: 731 2-persons, 591 3-persons, 408 4-persons, 196 5-persons, 80 6-persons, 113 7-or-more-persons.
Size of nonfamily households: 1,410 1-person, 196 2-persons.
1,784 married couples with children.
687 single-parent households (247 men, 440 women).
73.1% of residents of Tehachapi speak English at home.
21.7% of residents speak Spanish at home (75% speak English very well, 12% speak English well, 11% speak English not well, 3% don't speak English at all).
2.7% of residents speak other Indo-European language at home (100% speak English very well).
1.3% of residents speak Asian or Pacific Island language at home (85% speak English very well, 15% speak English well).
1.5% of residents speak other language at home (59% speak English very well, 41% speak English well).
Foreign born population: 1,438 (11.1%)
(38.3% of them are naturalized citizens)
| Here: | 6.0 |
| State: | 6.0 |
| Here: | 4.4 |
| State: | 3.9 |

- Bedrooms in owner-occupied houses and condos in Tehachapi, California
- 14no bedroom
- 131 bedroom
- 1422 bedrooms
- 1,5443 bedrooms
- 4204 bedrooms
- 1815+ bedrooms

- Bedrooms in renter-occupied apartments in Tehachapi, California
- 21no bedroom
- 901 bedroom
- 6872 bedrooms
- 5353 bedrooms
- 964 bedrooms
- 05+ bedrooms

- Cars and other vehicles available in Tehachapi in owner-occupied houses/condos
- 15no vehicle
- 7461 vehicle
- 9072 vehicles
- 3623 vehicles
- 1994 vehicles
- 855+ vehicles

- Cars and other vehicles available in Tehachapi in renter-occupied apartments
- 77no vehicle
- 6881 vehicle
- 5632 vehicles
- 443 vehicles
- 584 vehicles
- 05+ vehicles

- Rooms in owner-occupied houses in Tehachapi, California
- 141 room
- 02 rooms
- 253 rooms
- 1934 rooms
- 5605 rooms
- 8586 rooms
- 2477 rooms
- 2228 rooms
- 1959+ rooms

- Rooms in renter-occupied apartments in Tehachapi, California
- 211 room
- 02 rooms
- 2223 rooms
- 5014 rooms
- 3205 rooms
- 2306 rooms
- 1307 rooms
- 68 rooms
- 09+ rooms


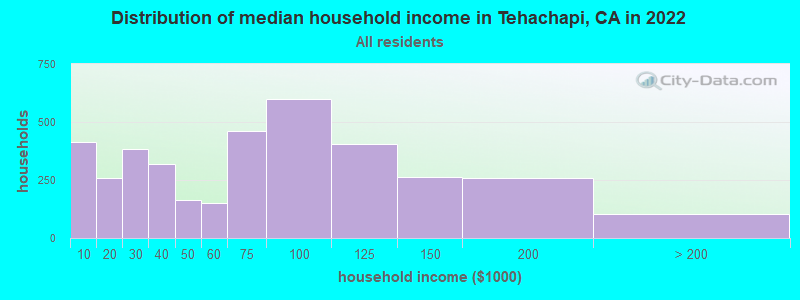
Tehachapi, CA household income distribution

- 414Less than $10,000
- 260$10,000 to $19,999
- 384$20,000 to $29,999
- 317$30,000 to $39,999
- 165$40,000 to $49,999
- 150$50,000 to $59,999
- 461$60,000 to $74,999
- 599$75,000 to $99,999
- 404$100,000 to $124,999
- 263$125,000 to $149,999
- 258$150,000 to $199,999
- 103$200,000 or more
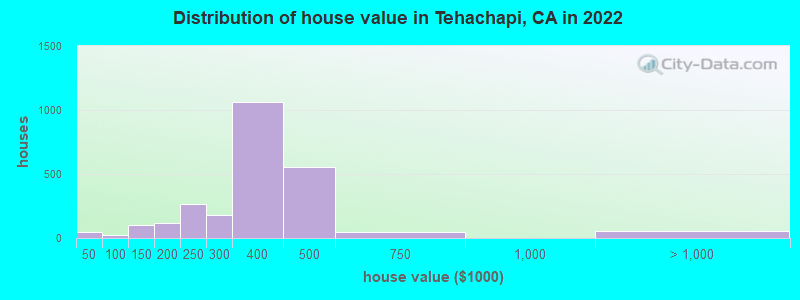
Home value of owner - occupied houses in 2022 in Tehachapi, CA
-
- 7$15,000 to $19,999
- 17$20,000 to $24,999
- 21$35,000 to $39,999
- 7$50,000 to $59,999
- 7$80,000 to $89,999
- 9$90,000 to $99,999
- 66$100,000 to $124,999
- 36$125,000 to $149,999
- 61$150,000 to $174,999
- 54$175,000 to $199,999
- 266$200,000 to $249,999
- 177$250,000 to $299,999
- 1,064$300,000 to $399,999
- 557$400,000 to $499,999
- 46$500,000 to $749,999
- 27$1,000,000 to $1,499,999
- 28$2,000,000 or more
Rent paid by renters in 2022 in Tehachapi, CA
-
- 9$200 to $249
- 14$250 to $299
- 61$300 to $349
- 15$350 to $399
- 34$500 to $549
- 116$600 to $649
- 54$650 to $699
- 101$700 to $749
- 12$750 to $799
- 159$800 to $899
- 92$900 to $999
- 323$1,000 to $1,249
- 92$1,250 to $1,499
- 182$1,500 to $1,999
- 58$2,000 to $2,499
- 18$2,500 to $2,999
- 75No cash rent


Percentage of workers working in this county: 85.6%
Number of people working at home: 197 (5.7% of all workers)
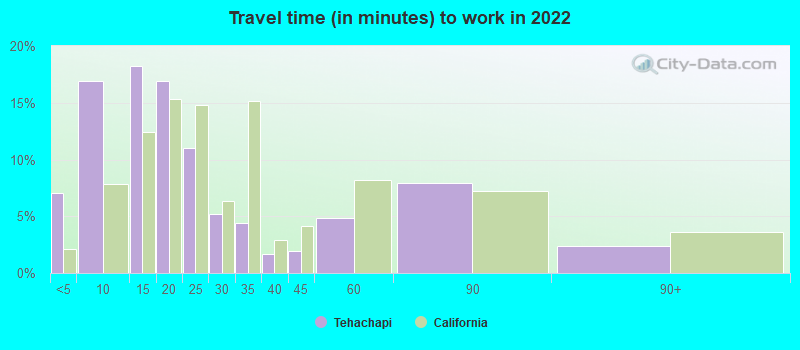
Travel time to work (commute)
- Less than 5 minutes: 65
- 5 to 9 minutes: 685
- 10 to 14 minutes: 301
- 15 to 19 minutes: 408
- 20 to 24 minutes: 221
- 25 to 29 minutes: 161
- 30 to 34 minutes: 312
- 35 to 39 minutes: 64
- 40 to 44 minutes: 52
- 45 to 59 minutes: 533
- 60 to 89 minutes: 192
- 90 or more minutes: 143
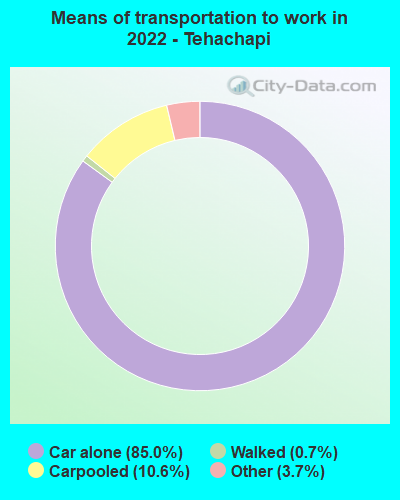
Means of transportation to work:
- Drove a car alone: 5,059 (81.8%)
- Carpooled: 629 (10.2%)
- Taxi: 293 (4.7%)
- Walked: 48 (0.8%)
- Worked at home: 197 (3.2%)

- Unemployment by race in 2022
- Unemployment rate for White non-Hispanic residents
- 5.0%Males
- 2.2%Females
- Unemployment rate for Black residents
- 5.2%Males
- 75.9%Females
- Unemployment rate for other race residents
- 22.3%Males
- Unemployment rate for two or more race residents
- 13.0%Males
- 8.1%Females
- Unemployment rate for Hispanic or Latino residents
- 11.1%Males
- 10.0%Females

- Year of entry for the foreign-born population in Tehachapi, California
- 1442010 or later
- 1502000 to 2009
- 4171990 to 1999
- 2501980 to 1989
- 1151970 to 1979
- 164Before 1970

First ancestries reported:
- American: 809 (11.6%)
- English: 604 (8.7%)
- German: 380 (5.5%)
- Irish: 240 (3.4%)
- European: 222 (3.2%)
- Ukrainian: 187 (2.7%)
- Portuguese: 109 (1.6%)
- Basque: 73 (1.0%)
- Ghanaian: 65 (0.9%)
- Italian: 44 (0.6%)
- Slavic: 37 (0.5%)
- British: 35 (0.5%)
- Hungarian: 30 (0.4%)
- Czech: 28 (0.4%)
- Slovene: 23 (0.3%)
- Norwegian: 22 (0.3%)
- Scottish: 18 (0.3%)
- Armenian: 17 (0.2%)
- Northern European: 15 (0.2%)
- Haitian: 12 (0.2%)
- Russian: 10 (0.1%)
- Welsh: 9 (0.1%)
- South African: 8 (0.1%)
- Scandinavian: 7 (0.1%)
- Swedish: 6 (0.09%)
- Arab: 5 (0.07%)
- Austrian: 4 (0.06%)
- Czechoslovakian: 3 (0.04%)
Most common places of birth for foreign-born residents (%):
| Tehachapi: | 47.2% (693) |
| California: | 37.2% (3,881,193) |
| Tehachapi: | 12.0% (176) |
| California: | 0.6% (60,761) |
| Tehachapi: | 6.4% (94) |
| California: | 7.8% (818,297) |
| Tehachapi: | 4.8% (70) |
| California: | 2.8% (290,436) |
| Tehachapi: | 3.2% (47) |
| California: | 0.1% (11,287) |
| Tehachapi: | 2.9% (43) |
| California: | 0.6% (57,953) |
| Tehachapi: | 2.8% (41) |
| California: | 0.1% (8,814) |
| Tehachapi: | 2.6% (38) |
| California: | 0.7% (73,304) |
| Tehachapi: | 2.3% (34) |
| California: | 4.2% (440,287) |
| Tehachapi: | 2.2% (33) |
| California: | 0.3% (31,439) |
| Tehachapi: | 1.7% (25) |
| California: | 0.6% (66,590) |
| Tehachapi: | 1.6% (24) |
| California: | 0.6% (60,582) |
Place of birth for U.S.-born residents:
- This state: 9,161
- Other state: 2,216
- Northeast: 341
- Midwest: 741
- South: 573
- West: 535
79.6% of Tehachapi residents lived in the same house 1 years ago.
Out of people who lived in different houses, 34.0% lived in this county.
Out of people who lived in different counties, 83.7% lived in California.
| Tehachapi: | 79.6% |
| State average: | 88.9% |
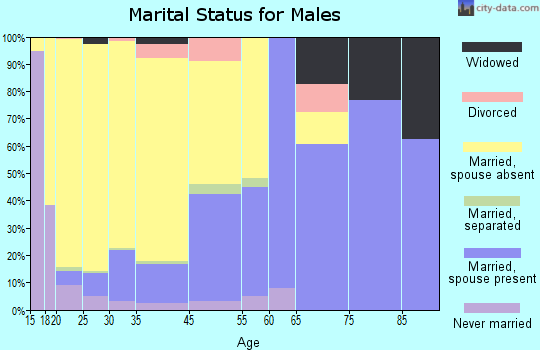
Education attainment for males 25 years and older:
- No schooling: 112
- Nursery to 4th grade: 105
- 5th and 6th grade: 73
- 7th and 8th grade: 86
- 9th grade: 154
- 10th grade: 301
- 11th grade: 354
- 12th grade, no diploma: 264
- High school graduate (or equivalency): 1,909
- Less than 1 year of college: 607
- Some college more than 1 year, no degree: 1,335
- Associate degree: 360
- Bachelor's degree: 449
- Master's degree: 334
- Professional school degree: 7
- Doctorate degree: 36

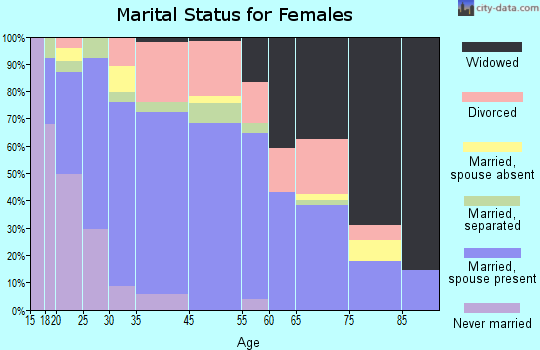
Education attainment for females 25 years and older:
- No schooling: 114
- Nursery to 4th grade: 0
- 5th and 6th grade: 14
- 7th and 8th grade: 57
- 9th grade: 0
- 10th grade: 10
- 11th grade: 29
- 12th grade, no diploma: 26
- High school graduate (or equivalency): 565
- Less than 1 year of college: 386
- Some college more than 1 year, no degree: 788
- Associate degree: 410
- Bachelor's degree: 416
- Master's degree: 121
- Professional school degree: 22
- Doctorate degree: 53

Housing units in structures:
- One, detached: 3,088
- One, attached: 19
- Two: 36
- 3 or 4: 268
- 5 to 9: 74
- 10 to 19: 41
- 20 to 49: 13
- 50 or more: 136
- Mobile homes: 318
- Boats, RVs, vans, etc.: 56
Median worth of mobile homes: $123,273
Housing units lacking complete kitchen facilities in 2022: 3.1%
House/condo owner moved in on average 12 years ago
Renter moved in on average 3 years ago

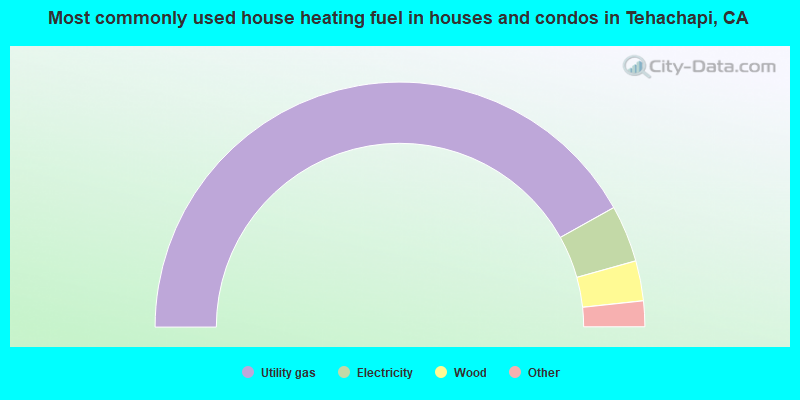
- 83.8%Utility gas
- 7.5%Electricity
- 5.3%Wood
- 2.7%Solar energy
- 0.6%Bottled, tank, or LP gas
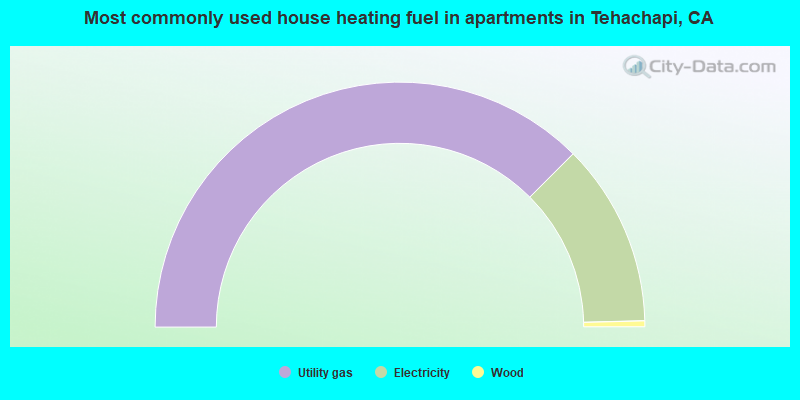
- 75.0%Utility gas
- 24.2%Electricity
- 0.8%Wood
Private vs. public school enrollment:
| Here: | 35.1% |
| California: | 10.5% |
| Here: | 20.2% |
| California: | 8.5% |
| Here: | 42.1% |
| California: | 15.9% |


