Tempe, AZ (Arizona) Houses and Residents
| Tempe: | $468,600 |
| Arizona: | $402,800 |
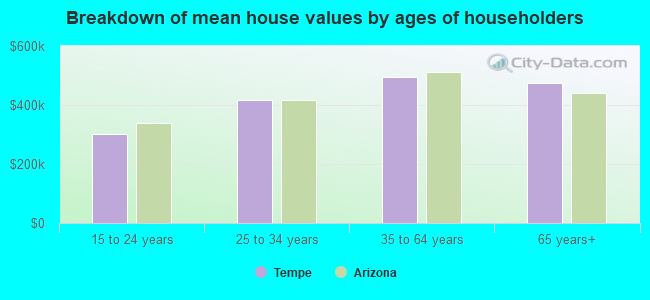
Mean price in 2022:
Detached houses: $535,475
Here: $535,475 State: $521,408 Townhouses or other attached units: $325,212
Here: $325,212 State: $387,465 In 3-to-4-unit structures: $309,647
Here: $309,647 State: $342,505 In 5-or-more-unit structures: $352,393
Here: $352,393 State: $371,286 Mobile homes: $67,638
Here: $67,638 State: $141,516
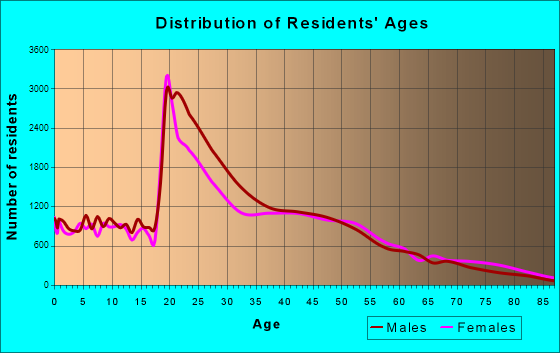
Total population: 172,816 (Urban population: 158,400, Rural population: 26 (all nonfarm))
Houses: 85,935 (77,538 occupied: 33,805 owner occupied, 43,733 renter occupied)
| % of renters here: | 56% |
| State: | 33% |
Housing density: 2,145 houses/condos per square mile
Median price asked for vacant for-sale houses and condos in 2022: $735,060.
Median contract rent in 2022: $1,566 (lower quartile is $1,197, upper quartile is $1,877)
Median rent asked for vacant for-rent units in 2022: $1,894
Median gross rent in Tempe, AZ in 2022: $1,652
Housing units in Tempe with a mortgage: 23,397 (2,576 second mortgage, 162 home equity loan, 2,154 both second mortgage and home equity loan)
Houses without a mortgage: 774
Median household income for houses/condos with a mortgage: $113,377
Median household income for apartments without a mortgage: $78,167
Median monthly housing costs: $1,556
Compare current foreclosures in Tempe, AZ:
| Photo | Address | Area | Beds / Baths | Price | Details |
|---|---|---|---|---|---|

|
#1
S Roosevelt St
Tempe, AZ 85281
|
1,916 sq. feet
|
3 baths 3 beds |
show details | |

|
#2
E 6th St
Tempe, AZ 85281
|
987 sq. feet
|
2 baths 2 beds |
show details | |

|
#3
E Playa Del Norte Dr Unit 4020
Tempe, AZ 85281
|
1,208 sq. feet
|
2 baths 2 beds |
show details | |

|
#4
E Mcnair Dr
Tempe, AZ 85283
|
1,852 sq. feet
|
2 baths 3 beds |
show details | |

|
#5
E Diamond Dr
Tempe, AZ 85283
|
1,035 sq. feet
|
2 baths 3 beds |
show details | |

|
#6
S Outrigger Rd
Tempe, AZ 85283
|
2,310 sq. feet
|
2 baths 4 beds |
show details | |

|
#7
W 16th St
Tempe, AZ 85281
|
1,161 sq. feet
|
2 baths 3 beds |
show details | |

|
#8
E Driftwood Dr
Tempe, AZ 85283
|
1,422 sq. feet
|
2 baths 3 beds |
show details | |

|
#9
E Verlea Dr
Tempe, AZ 85282
|
1,674 sq. feet
|
2 baths 4 beds |
show details | |

|
#10
W Dunbar Dr
Tempe, AZ 85282
|
1,940 sq. feet
|
2 baths 4 beds |
show details |
| Photo | Address | Area | Beds / Baths | Price | Details |
|---|---|---|---|---|---|

|
#11
S Country Club Way
Tempe, AZ 85282
|
1,520 sq. feet
|
2 baths 3 beds |
show details | |

|
#12
S River Dr
Tempe, AZ 85282
|
2,712 sq. feet
|
2 baths - beds |
show details | |

|
#13
N Mcallister Ave
Tempe, AZ 85281
|
1,125 sq. feet
|
2 baths - beds |
show details | |

|
#14
W Manhatton Dr
Tempe, AZ 85282
|
1,276 sq. feet
|
2 baths - beds |
show details | |

|
#15
E Balboa Dr
Tempe, AZ 85282
|
1,408 sq. feet
|
2 baths - beds |
show details | |

|
#16
E Henry St
Tempe, AZ 85281
|
- sq. feet
|
- baths - beds |
show details | |

|
#17
E Broadway Rd Unit 110
Tempe, AZ 85282
|
- sq. feet
|
- baths - beds |
show details | |

|
#18
E University Dr
Tempe, AZ 85281
|
- sq. feet
|
- baths - beds |
show details | |

|
#19
W Manhatton Dr
Tempe, AZ 85282
|
2,051 sq. feet
|
- baths - beds |
show details | |

|
#20
E Libra Dr
Tempe, AZ 85283
|
3,096 sq. feet
|
- baths - beds |
show details |
| Photo | Address | Area | Beds / Baths | Price | Details |
|---|---|---|---|---|---|

|
#21
E Broadway Rd Apt 1001
Tempe, AZ 85282
|
- sq. feet
|
- baths - beds |
show details | |

|
#22
E Southern Ave Unit 205
Tempe, AZ 85282
|
693 sq. feet
|
- baths - beds |
show details | |

|
#23
S Holbrook Ln
Tempe, AZ 85282
|
2,212 sq. feet
|
- baths - beds |
show details | |

|
#24
S Hardy Dr Apt 1045
Tempe, AZ 85283
|
- sq. feet
|
- baths - beds |
show details | |

|
#25
E Mckellips Rd
Tempe, AZ 85281
|
- sq. feet
|
- baths - beds |
show details | |

|
#26
W Brown St Apt 34
Tempe, AZ 85281
|
- sq. feet
|
- baths - beds |
show details | |

|
#27
S Palm Dr
Tempe, AZ 85284
|
- sq. feet
|
- baths - beds |
show details | |

|
#28
E Rio Salado Pkwy, Unit 3029
Tempe, AZ 85288
|
- sq. feet
|
- baths - beds |
show details | |

|
#29
W Colt Rd
Tempe, AZ 85284
|
1,509 sq. feet
|
- baths - beds |
show details | |

|
#30
S Dorsey Ln Apt 1048
Tempe, AZ 85282
|
- sq. feet
|
- baths - beds |
show details |
| Photo | Address | Area | Beds / Baths | Price | Details |
|---|---|---|---|---|---|

|
#31
E Apache Blvd Apt 2
Tempe, AZ 85281
|
- sq. feet
|
- baths - beds |
show details | |

|
#32
E University Dr Lot 30
Tempe, AZ 85281
|
- sq. feet
|
- baths - beds |
show details | |

|
#33
W Baseline Rd Unit 125
Tempe, AZ 85283
|
1,093 sq. feet
|
- baths - beds |
show details | |

|
#34
E Southern Ave Unit 171
Tempe, AZ 85282
|
693 sq. feet
|
- baths - beds |
show details | |

|
#35
S Rural Rd Apt 311
Tempe, AZ 85282
|
- sq. feet
|
- baths - beds |
show details | |

|
#36
N College Ave Unit F107
Tempe, AZ 85281
|
- sq. feet
|
- baths - beds |
show details | |

|
#37
N College Ave Unit 106
Tempe, AZ 85281
|
- sq. feet
|
- baths - beds |
show details | |

|
#38
S Kyrene Rd Apt 1216
Tempe, AZ 85283
|
- sq. feet
|
- baths - beds |
show details | |

|
#39
E Mckellips Rd Apt 3b
Tempe, AZ 85281
|
- sq. feet
|
- baths - beds |
show details | |

|
#40
E Playa Del Norte Dr Unit 2332
Tempe, AZ 85281
|
- sq. feet
|
- baths - beds |
show details |
| Photo | Address | Area | Beds / Baths | Price | Details |
|---|---|---|---|---|---|

|
#41
E Apache Blvd Apt 406
Tempe, AZ 85281
|
- sq. feet
|
- baths - beds |
show details | |

|
#42
E Baseline Rd Apt 2164
Tempe, AZ 85283
|
- sq. feet
|
- baths - beds |
show details | |

|
#43
E Sesame St
Tempe, AZ 85283
|
- sq. feet
|
- baths - beds |
show details | |

|
#44
S Calle Vauo Nawi
Tempe, AZ 85283
|
908 sq. feet
|
- baths - beds |
show details | |

|
#45
E La Jolla Dr
Tempe, AZ 85282
|
1,199 sq. feet
|
- baths - beds |
show details | |

|
#46
W Baseline Rd Apt 2127
Tempe, AZ 85283
|
- sq. feet
|
- baths - beds |
show details | |

|
#47
S Colonial Way
Tempe, AZ 85283
|
1,461 sq. feet
|
- baths - beds |
show details | |

|
#48
S Priest Dr, Apt 1161
Tempe, AZ 85284
|
- sq. feet
|
- baths - beds |
show details | |

|
#49
W Laguna Dr
Tempe, AZ 85282
|
1,276 sq. feet
|
- baths - beds |
show details | |

|
Check over 1 million property listings on Foreclosure.com!
|
browse all offers | |||

Latest news about housing in Tempe, AZ collected exclusively by city-data.com from local newspapers, TV, and radio stations


Median year apartment built: 1992
Household type by relationship:
Households: 185,939- Male householders: 44,803 (12,108 living alone), Female householders: 32,735 (10,450 living alone)
24,978 spouses (24,259 opposite-sex spouses), 8,196 unmarried partners, (7,685 opposite-sex unmarried partners), 35,253 children (33,134 natural, 852 adopted, 1,267 stepchildren), 1,627 grandchildren, 2,213 brothers or sisters, 2,520 parents, 0 foster children, 2,852 other relatives, 22,786 non-relatives
- In group quarters: 7,976
Size of family households: 17,217 2-persons, 8,215 3-persons, 7,201 4-persons, 2,148 5-persons, 1,511 6-persons, 388 7-or-more-persons.
Size of nonfamily households: 22,558 1-person, 13,119 2-persons, 3,353 3-persons, 1,582 4-persons, 149 5-persons, 97 6-persons.
16,172 married couples with children.
8,932 single-parent households (3,926 men, 5,006 women).
75.9% of residents of Tempe speak English at home.
12.4% of residents speak Spanish at home (74% speak English very well, 15% speak English well, 8% speak English not well, 3% don't speak English at all).
3.7% of residents speak other Indo-European language at home (79% speak English very well, 18% speak English well, 2% speak English not well).
5.5% of residents speak Asian or Pacific Island language at home (64% speak English very well, 28% speak English well, 7% speak English not well, 1% don't speak English at all).
2.6% of residents speak other language at home (74% speak English very well, 20% speak English well, 6% speak English not well).
Foreign born population: 23,949 (12.9%)
(42.5% of them are naturalized citizens)
| Here: | 5.9 |
| State: | 6.0 |
| Here: | 3.8 |
| State: | 4.1 |
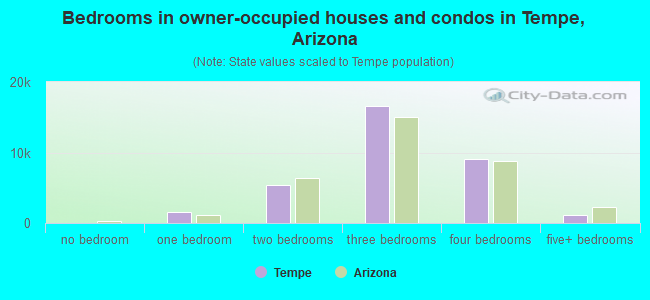
- Bedrooms in owner-occupied houses and condos in Tempe, Arizona
- 60no bedroom
- 1,6071 bedroom
- 5,3692 bedrooms
- 16,6623 bedrooms
- 9,0344 bedrooms
- 1,0735+ bedrooms

- Bedrooms in renter-occupied apartments in Tempe, Arizona
- 3,927no bedroom
- 11,4481 bedroom
- 18,1242 bedrooms
- 7,1943 bedrooms
- 2,7994 bedrooms
- 2415+ bedrooms
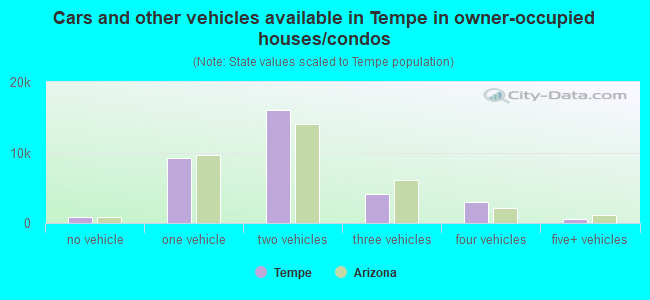
- Cars and other vehicles available in Tempe in owner-occupied houses/condos
- 846no vehicle
- 9,1641 vehicle
- 16,0062 vehicles
- 4,1593 vehicles
- 2,9974 vehicles
- 6335+ vehicles
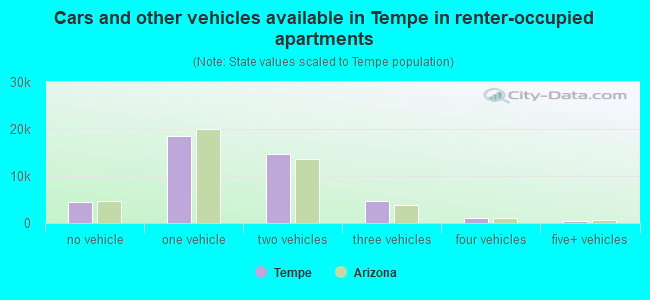
- Cars and other vehicles available in Tempe in renter-occupied apartments
- 4,477no vehicle
- 18,4411 vehicle
- 14,7262 vehicles
- 4,6553 vehicles
- 1,0254 vehicles
- 4095+ vehicles
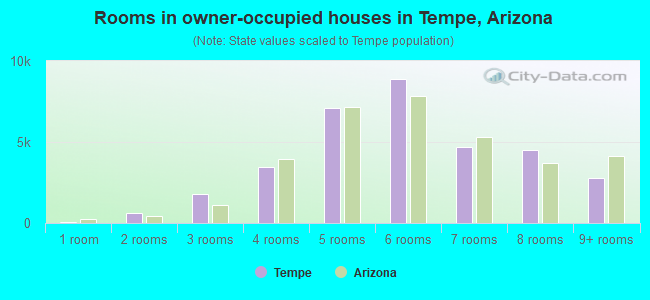
- Rooms in owner-occupied houses in Tempe, Arizona
- 601 room
- 5952 rooms
- 1,7703 rooms
- 3,4384 rooms
- 7,1285 rooms
- 8,9006 rooms
- 4,6867 rooms
- 4,4818 rooms
- 2,7479+ rooms

- Rooms in renter-occupied apartments in Tempe, Arizona
- 3,1341 room
- 5,6482 rooms
- 9,2533 rooms
- 13,2844 rooms
- 5,7185 rooms
- 3,9816 rooms
- 1,4257 rooms
- 7988 rooms
- 4929+ rooms
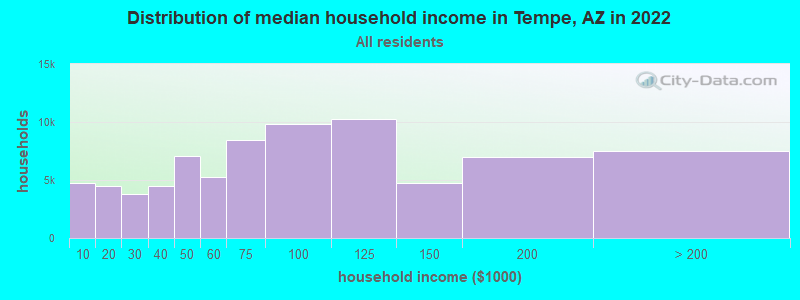
Tempe, AZ household income distribution

- 4,727Less than $10,000
- 4,475$10,000 to $19,999
- 3,790$20,000 to $29,999
- 4,444$30,000 to $39,999
- 7,097$40,000 to $49,999
- 5,246$50,000 to $59,999
- 8,434$60,000 to $74,999
- 9,835$75,000 to $99,999
- 10,253$100,000 to $124,999
- 4,760$125,000 to $149,999
- 6,971$150,000 to $199,999
- 7,506$200,000 or more
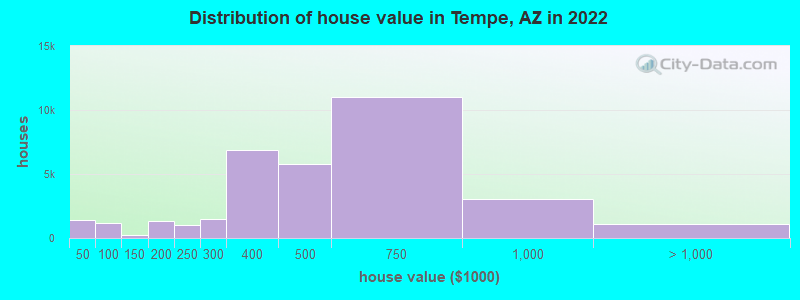
Home value of owner - occupied houses in 2022 in Tempe, AZ
-
- 382Less than $10,000
- 52$10,000 to $14,999
- 105$20,000 to $24,999
- 206$25,000 to $29,999
- 148$30,000 to $34,999
- 498$40,000 to $49,999
- 252$50,000 to $59,999
- 30$60,000 to $69,999
- 349$70,000 to $79,999
- 66$80,000 to $89,999
- 201$100,000 to $124,999
- 262$150,000 to $174,999
- 1,036$175,000 to $199,999
- 1,005$200,000 to $249,999
- 1,476$250,000 to $299,999
- 6,868$300,000 to $399,999
- 5,781$400,000 to $499,999
- 11,009$500,000 to $749,999
- 3,009$750,000 to $999,999
- 641$1,000,000 to $1,499,999
- 87$1,500,000 to $1,999,999
- 342$2,000,000 or more
Rent paid by renters in 2022 in Tempe, AZ
-
- 508Less than $100
- 38$100 to $149
- 69$150 to $199
- 39$200 to $249
- 54$250 to $299
- 89$300 to $349
- 83$350 to $399
- 257$400 to $449
- 98$450 to $499
- 80$500 to $549
- 103$550 to $599
- 118$600 to $649
- 282$650 to $699
- 371$700 to $749
- 185$750 to $799
- 1,186$800 to $899
- 1,745$900 to $999
- 8,328$1,000 to $1,249
- 8,743$1,250 to $1,499
- 17,838$1,500 to $1,999
- 5,141$2,000 to $2,499
- 885$2,500 to $2,999
- 552$3,000 to $3,499
- 565$3,500 or more
- 650No cash rent

Percentage of workers working in this county: 97.8%
Number of people working at home: 25,691 (23.2% of all workers)
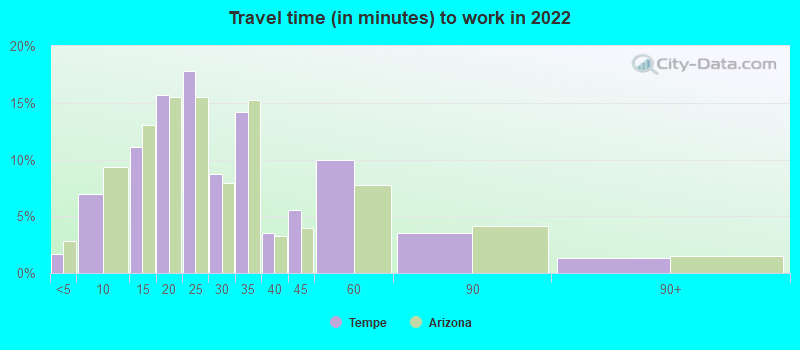
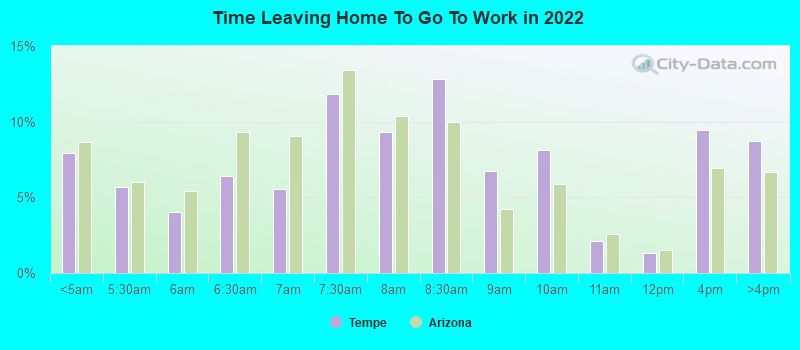
Travel time to work (commute)
- Less than 5 minutes: 2,032
- 5 to 9 minutes: 8,540
- 10 to 14 minutes: 11,031
- 15 to 19 minutes: 19,176
- 20 to 24 minutes: 16,049
- 25 to 29 minutes: 9,123
- 30 to 34 minutes: 9,125
- 35 to 39 minutes: 3,198
- 40 to 44 minutes: 863
- 45 to 59 minutes: 2,972
- 60 to 89 minutes: 1,600
- 90 or more minutes: 1,107
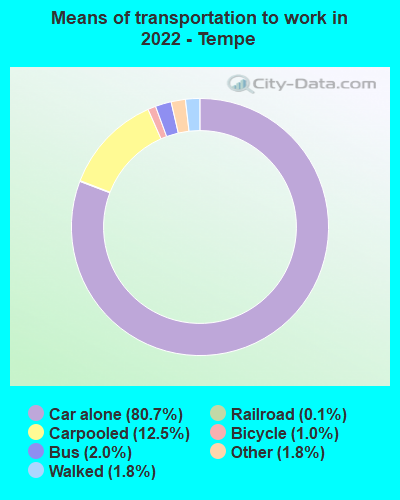
Means of transportation to work:
- Drove a car alone: 123,792 (69.2%)
- Carpooled: 19,208 (10.7%)
- Bus: 3,071 (1.7%)
- Subway or elevated rail: 145 (0.1%)
- Light rail, streetcar or trolley: 155 (0.1%)
- Taxi: 2,686 (1.5%)
- Bicycle: 1,546 (0.9%)
- Walked: 2,713 (1.5%)
- Worked at home: 25,691 (14.4%)
- Unemployment by race in 2022
- Unemployment rate for White non-Hispanic residents
- 1.9%Males
- 4.5%Females
- Unemployment rate for Black residents
- 12.4%Males
- 6.0%Females
- Unemployment rate for American Indian and Alaska Native residents
- 1.9%Males
- 4.0%Females
- Unemployment rate for Asian residents
- 4.3%Males
- 2.7%Females
- Unemployment rate for other race residents
- 3.1%Males
- 7.4%Females
- Unemployment rate for two or more race residents
- 1.7%Males
- Unemployment rate for Hispanic or Latino residents
- 3.2%Males
- 7.3%Females

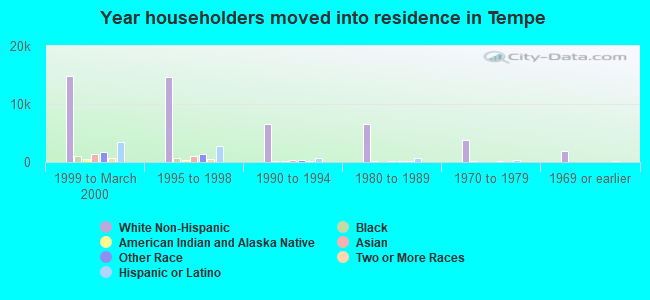
- Year of entry for the foreign-born population in Tempe, Arizona
- 13,8352010 or later
- 5,4112000 to 2009
- 3,2931990 to 1999
- 4,4271980 to 1989
- 1,9481970 to 1979
- 1,804Before 1970
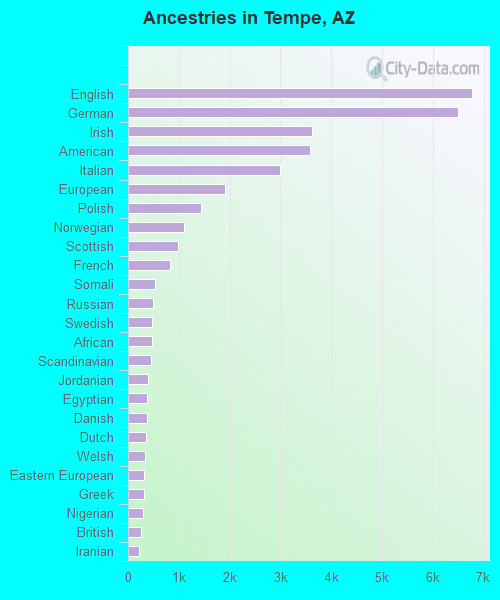
First ancestries reported:
- English: 6,768 (7.5%)
- German: 6,492 (7.2%)
- Irish: 3,623 (4.0%)
- American: 3,581 (4.0%)
- Italian: 2,987 (3.3%)
- European: 1,915 (2.1%)
- Polish: 1,430 (1.6%)
- Norwegian: 1,101 (1.2%)
- Scottish: 993 (1.1%)
- French: 819 (0.9%)
- Somali: 525 (0.6%)
- Russian: 495 (0.5%)
- Swedish: 472 (0.5%)
- African: 467 (0.5%)
- Scandinavian: 452 (0.5%)
- Jordanian: 385 (0.4%)
- Egyptian: 373 (0.4%)
- Danish: 365 (0.4%)
- Dutch: 345 (0.4%)
- Welsh: 328 (0.4%)
- Eastern European: 320 (0.4%)
- Greek: 308 (0.3%)
- Nigerian: 293 (0.3%)
- British: 255 (0.3%)
- Iranian: 225 (0.2%)
- Czech: 201 (0.2%)
- Scotch-Irish: 195 (0.2%)
- Bahamian: 186 (0.2%)
- Arab: 185 (0.2%)
- Canadian: 178 (0.2%)
- Yugoslavian: 167 (0.2%)
- Northern European: 164 (0.2%)
- Hungarian: 156 (0.2%)
- French Canadian: 151 (0.2%)
- Palestinian: 144 (0.2%)
- U.S. Virgin Islander: 136 (0.2%)
- Jamaican: 121 (0.1%)
- Portuguese: 117 (0.1%)
- Sudanese: 114 (0.1%)
- Finnish: 114 (0.1%)
- Slavic: 103 (0.1%)
- Austrian: 84 (0.09%)
- Ukrainian: 82 (0.09%)
- Turkish: 79 (0.09%)
- Brazilian: 76 (0.08%)
- Bulgarian: 72 (0.08%)
- Afghan: 63 (0.07%)
- Swiss: 62 (0.07%)
- Lithuanian: 62 (0.07%)
- Moroccan: 56 (0.06%)
- West Indian: 55 (0.06%)
- Croatian: 53 (0.06%)
- Ethiopian: 52 (0.06%)
- Lebanese: 50 (0.06%)
- Celtic: 48 (0.05%)
- German Russian: 45 (0.05%)
- Armenian: 42 (0.05%)
- Belgian: 38 (0.04%)
- Macedonian: 37 (0.04%)
- Czechoslovakian: 35 (0.04%)
- Ghanaian: 29 (0.03%)
- Basque: 25 (0.03%)
- Romanian: 22 (0.02%)
- Haitian: 22 (0.02%)
- Slovak: 18 (0.02%)
- Icelander: 18 (0.02%)
- New Zealander: 18 (0.02%)
- Israeli: 16 (0.02%)
- Belizean: 14 (0.02%)
- Cypriot: 13 (0.01%)
- Serbian: 12 (0.01%)
- Albanian: 11 (0.01%)
- Syrian: 8 (0.01%)
- Soviet Union: 6 (0.01%)
Most common places of birth for foreign-born residents (%):
| Tempe: | 20.4% (5,406) |
| Arizona: | 53.4% (500,086) |
| Tempe: | 19.1% (5,080) |
| Arizona: | 4.5% (41,719) |
| Tempe: | 9.4% (2,502) |
| Arizona: | 2.3% (21,275) |
| Tempe: | 3.6% (954) |
| Arizona: | 2.1% (19,199) |
| Tempe: | 2.7% (726) |
| Arizona: | 3.2% (30,378) |
| Tempe: | 2.4% (641) |
| Arizona: | 4.3% (40,102) |
| Tempe: | 1.9% (508) |
| Arizona: | 1.2% (11,275) |
| Tempe: | 1.8% (481) |
| Arizona: | 1.1% (9,889) |
| Tempe: | 1.7% (463) |
| Arizona: | 0.2% (1,456) |
| Tempe: | 1.5% (409) |
| Arizona: | 1.0% (8,899) |
Place of birth for U.S.-born residents:
- This state: 73,119
- Other state: 85,485
- Northeast: 11,975
- Midwest: 28,616
- South: 12,601
- West: 32,293
76.1% of Tempe residents lived in the same house 1 years ago.
Out of people who lived in different houses, 40.7% lived in this county.
Out of people who lived in different counties, 32.2% lived in Arizona.
| Tempe: | 76.1% |
| State average: | 86.0% |
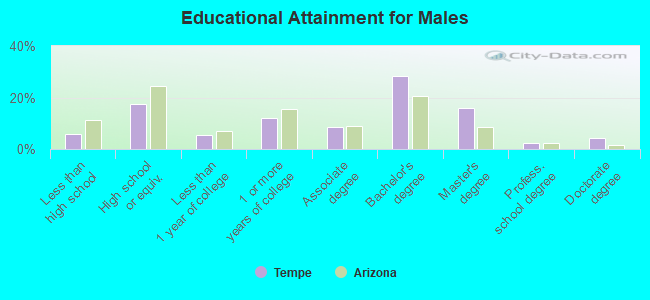
Education attainment for males 25 years and older:
- No schooling: 248
- Nursery to 4th grade: 0
- 5th and 6th grade: 280
- 7th and 8th grade: 454
- 9th grade: 364
- 10th grade: 489
- 11th grade: 201
- 12th grade, no diploma: 1,742
- High school graduate (or equivalency): 10,892
- Less than 1 year of college: 3,323
- Some college more than 1 year, no degree: 7,631
- Associate degree: 5,453
- Bachelor's degree: 17,800
- Master's degree: 9,940
- Professional school degree: 1,354
- Doctorate degree: 2,712
Education attainment for females 25 years and older:
- No schooling: 747
- Nursery to 4th grade: 72
- 5th and 6th grade: 216
- 7th and 8th grade: 145
- 9th grade: 62
- 10th grade: 496
- 11th grade: 93
- 12th grade, no diploma: 1,131
- High school graduate (or equivalency): 9,157
- Less than 1 year of college: 3,011
- Some college more than 1 year, no degree: 7,521
- Associate degree: 4,644
- Bachelor's degree: 16,154
- Master's degree: 7,801
- Professional school degree: 1,443
- Doctorate degree: 1,822

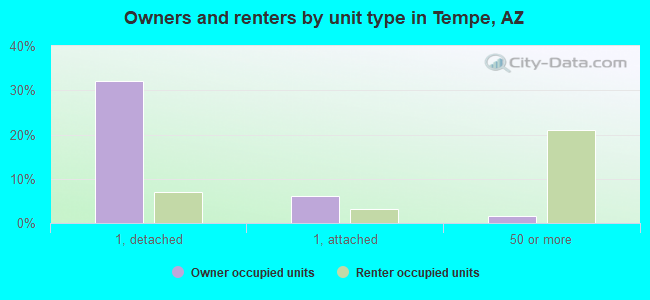
Housing units in structures:
- One, detached: 33,411
- One, attached: 8,104
- Two: 2,659
- 3 or 4: 4,518
- 5 to 9: 5,594
- 10 to 19: 6,328
- 20 to 49: 5,175
- 50 or more: 18,280
- Mobile homes: 1,866
Median worth of mobile homes: $54,600
Housing units lacking complete kitchen facilities in 2022: 0.2%
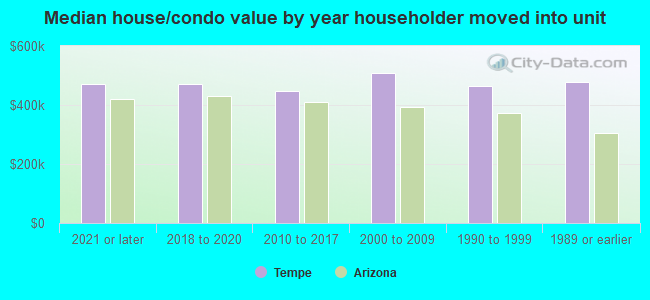
House/condo owner moved in on average 9 years ago
Renter moved in on average 0 years ago
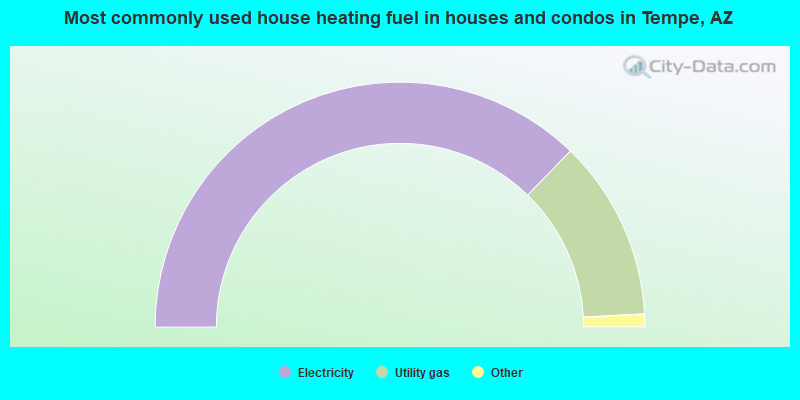
- 74.5%Electricity
- 23.8%Utility gas
- 0.5%Solar energy
- 0.5%Bottled, tank, or LP gas
- 0.5%No fuel used
- 0.2%Fuel oil, kerosene, etc.
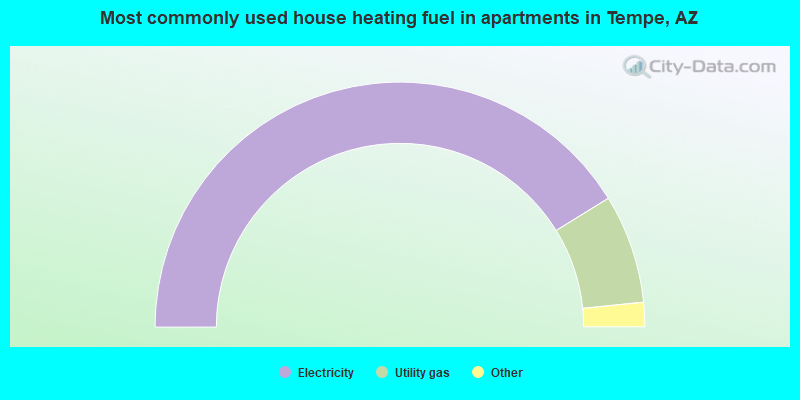
- 82.4%Electricity
- 14.4%Utility gas
- 2.5%No fuel used
- 0.3%Bottled, tank, or LP gas
- 0.2%Wood
- 0.2%Other fuel
- 0.1%Fuel oil, kerosene, etc.
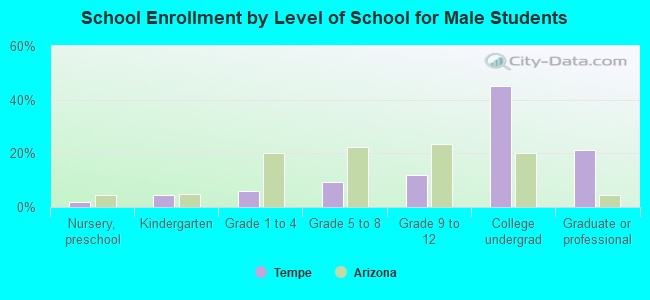
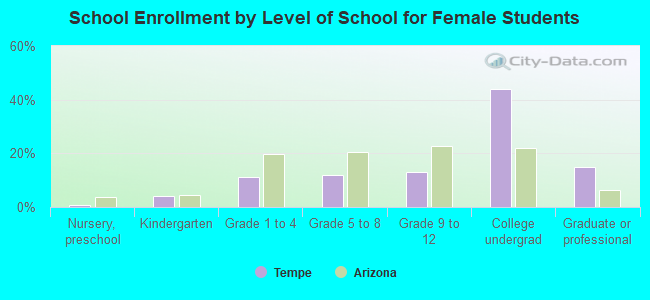
Private vs. public school enrollment:
| Here: | 10.8% |
| Arizona: | 10.4% |
| Here: | 4.9% |
| Arizona: | 8.8% |
| Here: | 6.6% |
| Arizona: | 13.1% |