Texas City, TX (Texas) Houses and Residents
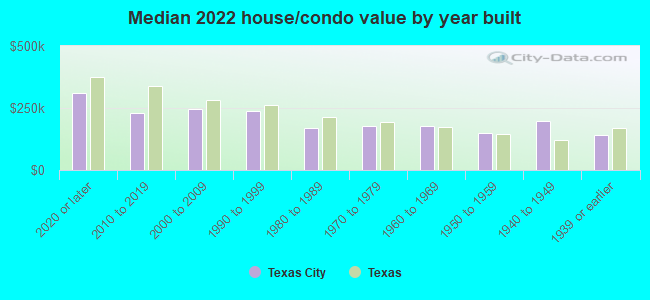
| Texas City: | $188,208 |
| Texas: | $275,400 |
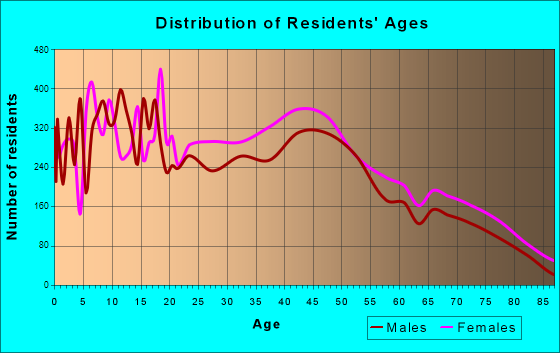
Total population: 46,639 (Urban population: 39,241, Rural population: 2,150 (10 farm, 2,140 nonfarm))
Houses: 23,014 (21,089 occupied: 12,014 owner occupied, 9,657 renter occupied)
| % of renters here: | 45% |
| State: | 38% |
Housing density: 369 houses/condos per square mile
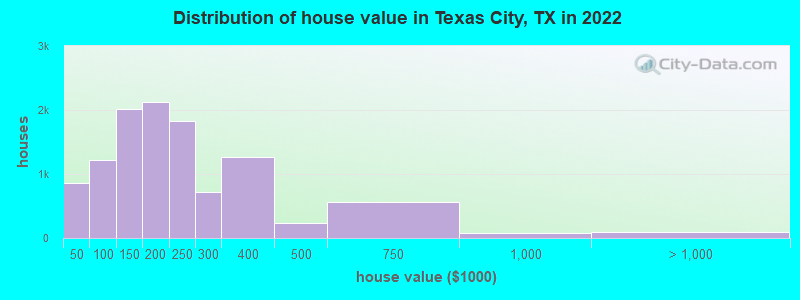
Median price asked for vacant for-sale houses and condos in 2022: $439,194.
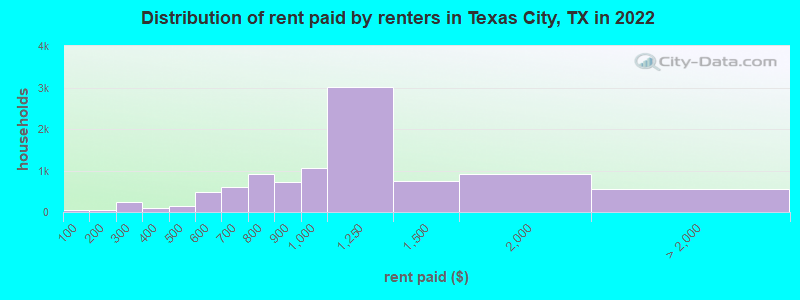
Median contract rent in 2022: $1,018 (lower quartile is $790, upper quartile is $1,195)
Median rent asked for vacant for-rent units in 2022: $1,225
Median gross rent in Texas City, TX in 2022: $1,153
Housing units in Texas City with a mortgage: 6,362 (221 second mortgage, 0 home equity loan, 130 both second mortgage and home equity loan)
Houses without a mortgage: 220
Median household income for houses/condos with a mortgage: $81,864
Median household income for apartments without a mortgage: $51,025
Median monthly housing costs: $1,105
Compare current foreclosures in Texas City, TX:
| Photo | Address | Area | Beds / Baths | Price | Details |
|---|---|---|---|---|---|

|
#1
11th St N
Texas City, TX 77590
|
2,625 sq. feet
|
3 baths 4 beds |
$449,900
|
show details |

|
#2
Oleander Ave
Texas City, TX 77590
|
- sq. feet
|
2 baths 3 beds |
show details | |

|
#3
Diamond Oak Dr
Texas City, TX 77591
|
3,031 sq. feet
|
2 baths 5 beds |
show details | |

|
#4
32nd Ave N
Texas City, TX 77591
|
1,520 sq. feet
|
2 baths 3 beds |
show details | |

|
#5
34th Ave N
Texas City, TX 77591
|
- sq. feet
|
3 baths 4 beds |
show details | |

|
#6
Ruby Dr
Texas City, TX 77591
|
- sq. feet
|
2 baths 4 beds |
show details | |

|
#7
N Heritage Oaks Dr
Texas City, TX 77591
|
2,082 sq. feet
|
2 baths - beds |
show details | |

|
#8
Buttonwood Dr
Texas City, TX 77591
|
2,208 sq. feet
|
2 baths - beds |
show details | |

|
#9
Woodrow St
Texas City, TX 77591
|
1,106 sq. feet
|
1 baths - beds |
show details | |

|
#10
S Washington St
Texas City, TX 77591
|
599 sq. feet
|
1 baths - beds |
show details |
| Photo | Address | Area | Beds / Baths | Price | Details |
|---|---|---|---|---|---|

|
#11
S Cobb St
Texas City, TX 77591
|
1,118 sq. feet
|
1 baths - beds |
show details | |

|
#12
N Fulton St
Texas City, TX 77591
|
868 sq. feet
|
1 baths - beds |
show details | |

|
#13
21st Ave N
Texas City, TX 77590
|
1,578 sq. feet
|
2 baths - beds |
show details | |

|
#14
16th Ave N
Texas City, TX 77590
|
1,436 sq. feet
|
1 baths - beds |
show details | |

|
#15
Cardinal Cir
Texas City, TX 77591
|
1,414 sq. feet
|
1 baths - beds |
show details | |

|
#16
Woodrow St
Texas City, TX 77591
|
1,394 sq. feet
|
1 baths - beds |
show details | |

|
#17
12th St N
Texas City, TX 77590
|
1,434 sq. feet
|
2 baths - beds |
show details | |

|
#18
15th Ave N
Texas City, TX 77590
|
1,675 sq. feet
|
2 baths - beds |
show details | |

|
#19
16th Ave N
Texas City, TX 77590
|
1,076 sq. feet
|
1 baths - beds |
show details | |

|
#20
Robin St # 7314
Texas City, TX 77591
|
1,444 sq. feet
|
2 baths - beds |
show details |
| Photo | Address | Area | Beds / Baths | Price | Details |
|---|---|---|---|---|---|

|
#21
Park Ave
Texas City, TX 77591
|
987 sq. feet
|
1 baths - beds |
show details | |

|
#22
17th Ave N
Texas City, TX 77590
|
903 sq. feet
|
1 baths - beds |
show details | |

|
#23
13th Ave N
Texas City, TX 77590
|
1,512 sq. feet
|
2 baths - beds |
show details | |

|
#24
20th Ave N
Texas City, TX 77590
|
1,836 sq. feet
|
1 baths - beds |
show details | |

|
#25
19th St N
Texas City, TX 77590
|
2,696 sq. feet
|
2 baths - beds |
show details | |

|
#26
W Red Oak Ln
Texas City, TX 77591
|
2,483 sq. feet
|
2 baths - beds |
show details | |

|
#27
Blue Bonnet Dr
Texas City, TX 77591
|
1,653 sq. feet
|
2 baths - beds |
show details | |

|
#28
3rd Ave N
Texas City, TX 77590
|
1,150 sq. feet
|
1 baths - beds |
show details | |

|
#29
Phillips St
Texas City, TX 77591
|
960 sq. feet
|
1 baths - beds |
show details | |

|
#30
Woodrow St
Texas City, TX 77591
|
1,847 sq. feet
|
2 baths - beds |
show details |
| Photo | Address | Area | Beds / Baths | Price | Details |
|---|---|---|---|---|---|

|
#31
Eunice St
Texas City, TX 77591
|
1,539 sq. feet
|
2 baths - beds |
show details | |

|
#32
Ivory Ct
Texas City, TX 77591
|
- sq. feet
|
- baths - beds |
show details | |

|
#33
Highway 146 N Apt 704
Texas City, TX 77590
|
- sq. feet
|
- baths - beds |
show details | |

|
#34
16th Ave N
Texas City, TX 77590
|
- sq. feet
|
- baths - beds |
show details | |

|
#35
N Golden Oak Dr
Texas City, TX 77591
|
- sq. feet
|
- baths - beds |
show details | |

|
#36
25th Ave N Apt 153
Texas City, TX 77590
|
- sq. feet
|
- baths - beds |
show details | |

|
#37
30th Ave N
Texas City, TX 77590
|
- sq. feet
|
- baths - beds |
show details | |

|
#38
Diamond Oak Dr
Texas City, TX 77591
|
1,463 sq. feet
|
- baths - beds |
show details | |

|
#39
Glacier Ave Apt 213
Texas City, TX 77591
|
- sq. feet
|
- baths - beds |
show details | |

|
#40
Highway 146 N Apt 510
Texas City, TX 77590
|
- sq. feet
|
- baths - beds |
show details |
| Photo | Address | Area | Beds / Baths | Price | Details |
|---|---|---|---|---|---|

|
#41
Garnet Ct
Texas City, TX 77591
|
- sq. feet
|
- baths - beds |
show details | |

|
#42
Coral Dr
Texas City, TX 77591
|
- sq. feet
|
- baths - beds |
show details | |

|
#43
Ruby Dr
Texas City, TX 77591
|
- sq. feet
|
- baths - beds |
show details | |

|
#44
Coral Dr
Texas City, TX 77591
|
- sq. feet
|
- baths - beds |
show details | |

|
#45
Pearl Ct
Texas City, TX 77591
|
- sq. feet
|
- baths - beds |
show details | |

|
#46
34th St N Apt 5306
Texas City, TX 77590
|
- sq. feet
|
- baths - beds |
show details | |

|
#47
14th Ave N
Texas City, TX 77590
|
- sq. feet
|
- baths - beds |
show details | |

|
#48
Ruby Dr
Texas City, TX 77591
|
- sq. feet
|
- baths - beds |
show details | |

|
#49
Clover Hill Ln
Texas City, TX 77591
|
2,010 sq. feet
|
- baths - beds |
show details | |

|
Check over 1 million property listings on Foreclosure.com!
|
browse all offers | |||


 | Texas City Rental units (1 reply) |
| Best Texas city newspapers for advertising NM real estate? (6 replies) |
| Texas population estimates 2020-2022 (37 replies) |
| Voluntary Home Buyout Program - Harris County Flood Control District (91 replies) |
| Uniform opt-out for Lakewood-area parents? (43 replies) |
| Where all in Texas have y'all lived??? (62 replies) |
Median year apartment built: 1983
Household type by relationship:
Households: 54,039- Male householders: 9,525 (2,699 living alone), Female householders: 11,239 (2,891 living alone)
8,534 spouses (8,494 opposite-sex spouses), 1,536 unmarried partners, (1,496 opposite-sex unmarried partners), 16,152 children (14,606 natural, 499 adopted, 1,046 stepchildren), 1,837 grandchildren, 732 brothers or sisters, 580 parents, 27 foster children, 1,721 other relatives, 1,053 non-relatives
- In group quarters: 1,097
Size of family households: 6,328 2-persons, 2,916 3-persons, 2,475 4-persons, 1,360 5-persons, 791 6-persons, 433 7-or-more-persons.
Size of nonfamily households: 5,759 1-person, 1,595 2-persons, 87 3-persons, 22 6-persons.
6,254 married couples with children.
4,595 single-parent households (528 men, 4,067 women).
77.9% of residents of Texas City speak English at home.
19.8% of residents speak Spanish at home (71% speak English very well, 11% speak English well, 13% speak English not well, 5% don't speak English at all).
1.1% of residents speak other Indo-European language at home (36% speak English very well, 33% speak English well, 15% speak English not well, 17% don't speak English at all).
1.2% of residents speak Asian or Pacific Island language at home (41% speak English very well, 37% speak English well, 12% speak English not well, 9% don't speak English at all).
Foreign born population: 4,533 (8.4%)
(34.4% of them are naturalized citizens)
| Here: | 6.1 |
| State: | 6.3 |
| Here: | 4.0 |
| State: | 4.0 |
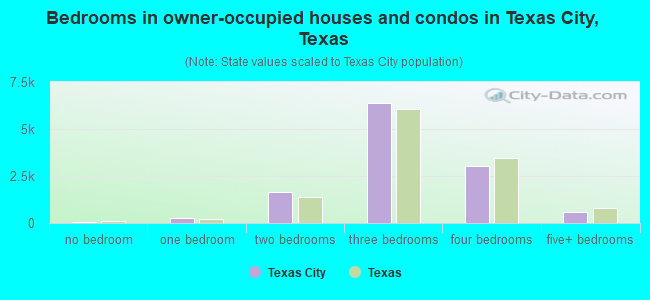
- Bedrooms in owner-occupied houses and condos in Texas City, Texas
- 54no bedroom
- 2741 bedroom
- 1,6722 bedrooms
- 6,3613 bedrooms
- 3,0484 bedrooms
- 6055+ bedrooms
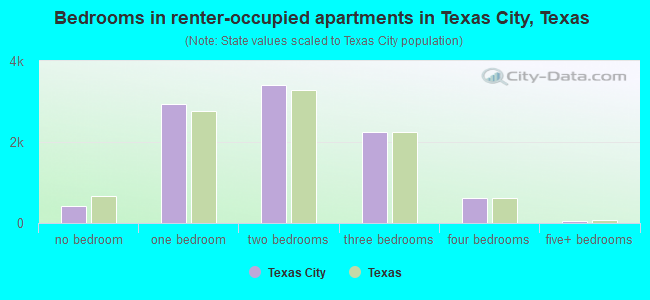
- Bedrooms in renter-occupied apartments in Texas City, Texas
- 423no bedroom
- 2,9331 bedroom
- 3,3982 bedrooms
- 2,2423 bedrooms
- 6174 bedrooms
- 455+ bedrooms
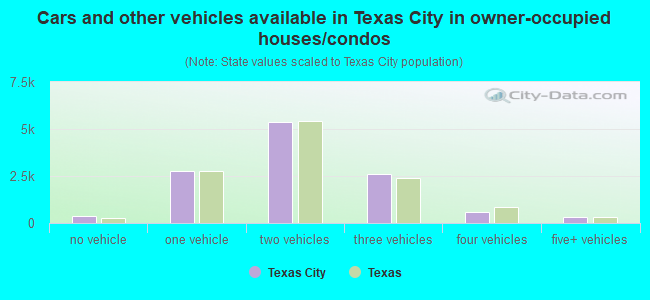
- Cars and other vehicles available in Texas City in owner-occupied houses/condos
- 364no vehicle
- 2,7871 vehicle
- 5,3712 vehicles
- 2,6223 vehicles
- 5734 vehicles
- 2975+ vehicles
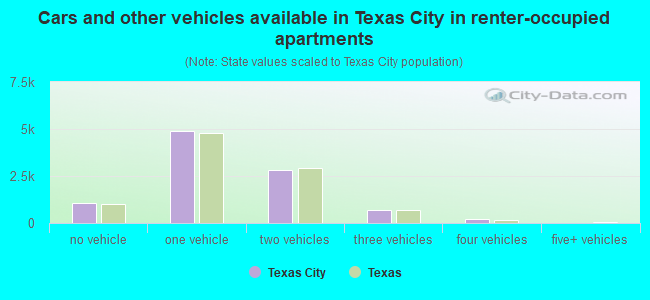
- Cars and other vehicles available in Texas City in renter-occupied apartments
- 1,051no vehicle
- 4,8761 vehicle
- 2,8042 vehicles
- 6793 vehicles
- 2294 vehicles
- 195+ vehicles
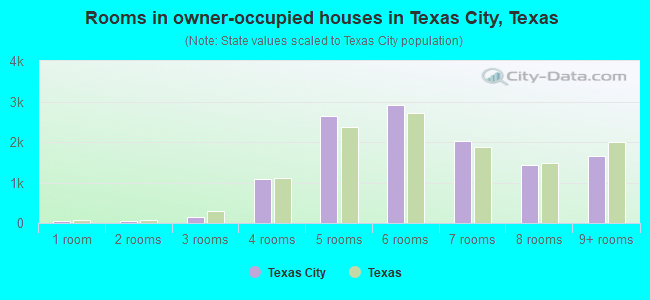
- Rooms in owner-occupied houses in Texas City, Texas
- 541 room
- 492 rooms
- 1393 rooms
- 1,0904 rooms
- 2,6485 rooms
- 2,9106 rooms
- 2,0357 rooms
- 1,4448 rooms
- 1,6469+ rooms
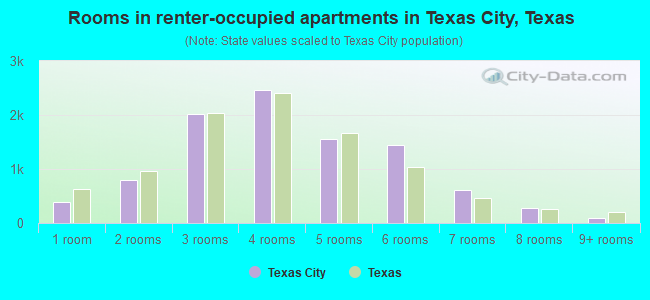
- Rooms in renter-occupied apartments in Texas City, Texas
- 3981 room
- 7952 rooms
- 2,0233 rooms
- 2,4674 rooms
- 1,5505 rooms
- 1,4506 rooms
- 6027 rooms
- 2848 rooms
- 889+ rooms
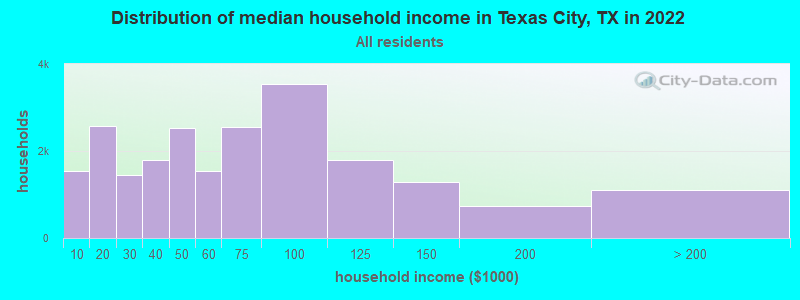
Texas City, TX household income distribution

- 1,535Less than $10,000
- 2,576$10,000 to $19,999
- 1,458$20,000 to $29,999
- 1,798$30,000 to $39,999
- 2,522$40,000 to $49,999
- 1,538$50,000 to $59,999
- 2,562$60,000 to $74,999
- 3,530$75,000 to $99,999
- 1,791$100,000 to $124,999
- 1,296$125,000 to $149,999
- 726$150,000 to $199,999
- 1,101$200,000 or more
Home value of owner - occupied houses in 2022 in Texas City, TX
-
- 332Less than $10,000
- 81$10,000 to $14,999
- 210$15,000 to $19,999
- 57$20,000 to $24,999
- 60$25,000 to $29,999
- 3$30,000 to $34,999
- 107$40,000 to $49,999
- 226$50,000 to $59,999
- 150$60,000 to $69,999
- 227$70,000 to $79,999
- 185$80,000 to $89,999
- 313$90,000 to $99,999
- 1,150$100,000 to $124,999
- 866$125,000 to $149,999
- 1,566$150,000 to $174,999
- 560$175,000 to $199,999
- 1,827$200,000 to $249,999
- 723$250,000 to $299,999
- 1,263$300,000 to $399,999
- 239$400,000 to $499,999
- 568$500,000 to $749,999
- 81$750,000 to $999,999
- 73$1,000,000 to $1,499,999
- 13$2,000,000 or more
Rent paid by renters in 2022 in Texas City, TX
-
- 48Less than $100
- 52$150 to $199
- 108$200 to $249
- 131$250 to $299
- 84$300 to $349
- 15$350 to $399
- 65$400 to $449
- 68$450 to $499
- 405$500 to $549
- 76$550 to $599
- 350$600 to $649
- 246$650 to $699
- 474$700 to $749
- 438$750 to $799
- 721$800 to $899
- 1,068$900 to $999
- 3,014$1,000 to $1,249
- 735$1,250 to $1,499
- 905$1,500 to $1,999
- 8$2,000 to $2,499
- 540No cash rent
Percentage of workers working in this county: 75.8%
Number of people working at home: 800 (3.4% of all workers)
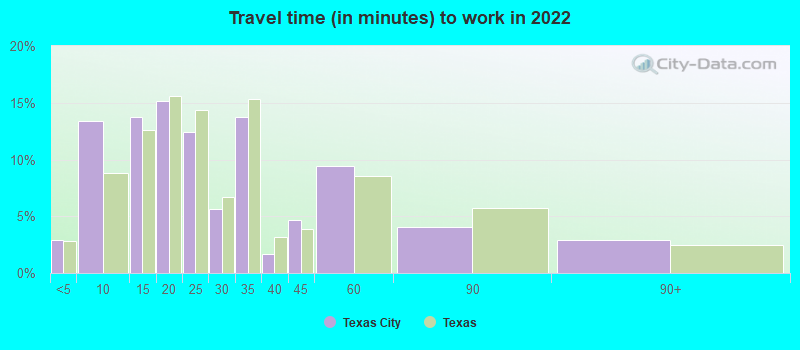
Travel time to work (commute)
- Less than 5 minutes: 806
- 5 to 9 minutes: 2,875
- 10 to 14 minutes: 2,680
- 15 to 19 minutes: 3,641
- 20 to 24 minutes: 3,005
- 25 to 29 minutes: 1,436
- 30 to 34 minutes: 3,369
- 35 to 39 minutes: 568
- 40 to 44 minutes: 331
- 45 to 59 minutes: 2,216
- 60 to 89 minutes: 867
- 90 or more minutes: 376
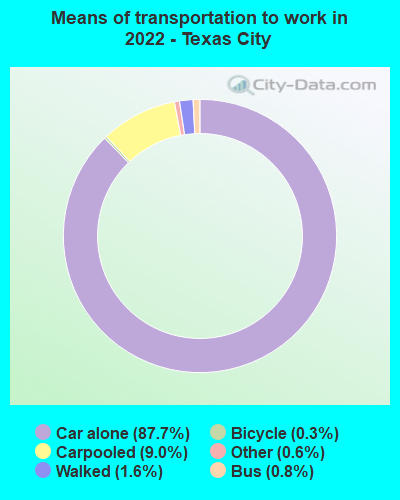
Means of transportation to work:
- Drove a car alone: 17,271 (79.1%)
- Carpooled: 2,247 (10.3%)
- Bus: 75 (0.3%)
- Taxi: 261 (1.2%)
- Bicycle: 31 (0.1%)
- Walked: 374 (1.7%)
- Worked at home: 800 (3.7%)
- Unemployment by race in 2022
- Unemployment rate for White non-Hispanic residents
- 7.9%Males
- 3.3%Females
- Unemployment rate for Black residents
- 4.3%Males
- 23.9%Females
- Unemployment rate for American Indian and Alaska Native residents
- 11.7%Females
- Unemployment rate for Asian residents
- 1.1%Females
- Unemployment rate for other race residents
- 7.3%Males
- 2.6%Females
- Unemployment rate for two or more race residents
- 4.1%Males
- 1.4%Females
- Unemployment rate for Hispanic or Latino residents
- 3.4%Males
- 1.1%Females
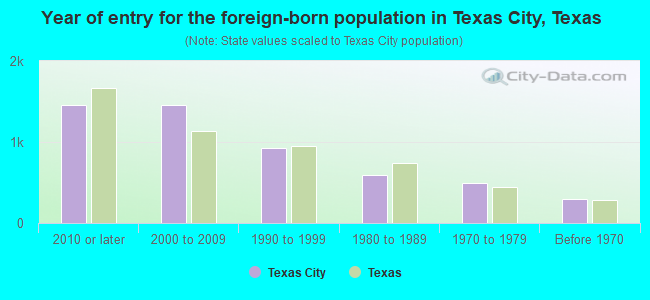
- Year of entry for the foreign-born population in Texas City, Texas
- 1,4512010 or later
- 1,4512000 to 2009
- 9231990 to 1999
- 5901980 to 1989
- 4951970 to 1979
- 302Before 1970
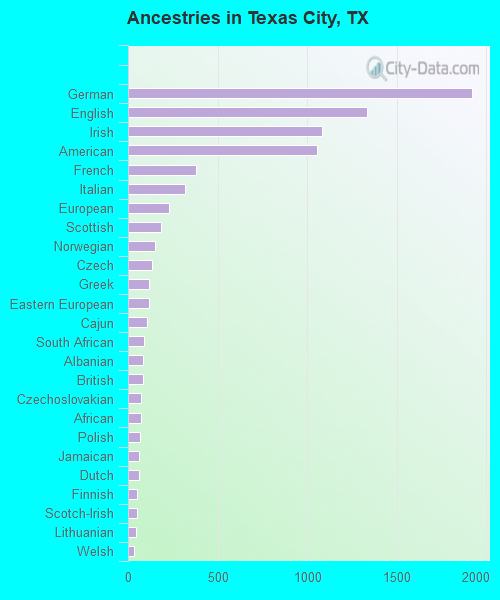
First ancestries reported:
- German: 1,920 (6.2%)
- English: 1,337 (4.3%)
- Irish: 1,082 (3.5%)
- American: 1,055 (3.4%)
- French: 382 (1.2%)
- Italian: 318 (1.0%)
- European: 231 (0.7%)
- Scottish: 182 (0.6%)
- Norwegian: 148 (0.5%)
- Czech: 133 (0.4%)
- Greek: 118 (0.4%)
- Eastern European: 115 (0.4%)
- Cajun: 105 (0.3%)
- South African: 89 (0.3%)
- Albanian: 84 (0.3%)
- British: 83 (0.3%)
- Czechoslovakian: 75 (0.2%)
- African: 75 (0.2%)
- Polish: 65 (0.2%)
- Jamaican: 61 (0.2%)
- Dutch: 60 (0.2%)
- Finnish: 52 (0.2%)
- Scotch-Irish: 52 (0.2%)
- Lithuanian: 42 (0.1%)
- Welsh: 34 (0.1%)
- Belizean: 29 (0.09%)
- Swedish: 27 (0.09%)
- Hungarian: 22 (0.07%)
- French Canadian: 19 (0.06%)
- Nigerian: 12 (0.04%)
- Lebanese: 10 (0.03%)
- Romanian: 8 (0.03%)
Most common places of birth for foreign-born residents (%):
| Texas City: | 56.7% (2,366) |
| Texas: | 48.4% (2,411,723) |
| Texas City: | 5.7% (236) |
| Texas: | 4.5% (224,455) |
| Texas City: | 3.9% (161) |
| Texas: | 2.3% (115,558) |
| Texas City: | 3.6% (149) |
| Texas: | 0.4% (18,642) |
| Texas City: | 3.4% (143) |
| Texas: | 2.1% (103,148) |
| Texas City: | 2.8% (116) |
| Texas: | 0.0% (1,967) |
| Texas City: | 2.8% (115) |
| Texas: | 6.1% (306,347) |
| Texas City: | 2.7% (112) |
| Texas: | 3.0% (147,182) |
Place of birth for U.S.-born residents:
- This state: 38,240
- Other state: 10,237
- Northeast: 1,531
- Midwest: 2,450
- South: 4,262
- West: 1,964
82.4% of Texas City residents lived in the same house 1 years ago.
Out of people who lived in different houses, 37.0% lived in this county.
Out of people who lived in different counties, 79.9% lived in Texas.
| Texas City: | 82.4% |
| State average: | 85.7% |
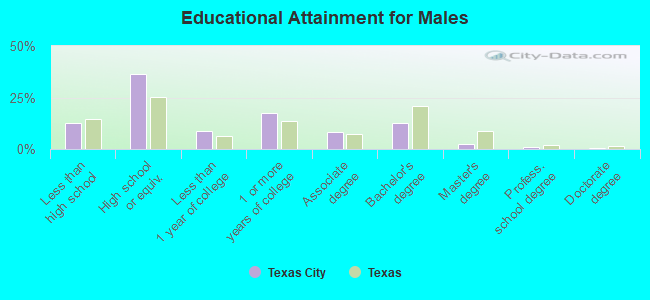
Education attainment for males 25 years and older:
- No schooling: 324
- Nursery to 4th grade: 25
- 5th and 6th grade: 346
- 7th and 8th grade: 201
- 9th grade: 136
- 10th grade: 483
- 11th grade: 381
- 12th grade, no diploma: 193
- High school graduate (or equivalency): 5,961
- Less than 1 year of college: 1,444
- Some college more than 1 year, no degree: 2,844
- Associate degree: 1,359
- Bachelor's degree: 2,054
- Master's degree: 417
- Professional school degree: 200
- Doctorate degree: 107
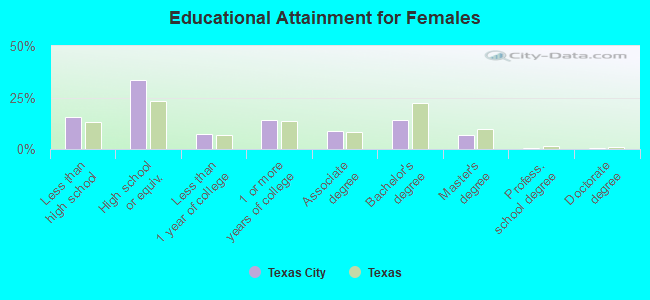
Education attainment for females 25 years and older:
- No schooling: 299
- Nursery to 4th grade: 291
- 5th and 6th grade: 184
- 7th and 8th grade: 136
- 9th grade: 194
- 10th grade: 650
- 11th grade: 346
- 12th grade, no diploma: 816
- High school graduate (or equivalency): 6,307
- Less than 1 year of college: 1,358
- Some college more than 1 year, no degree: 2,625
- Associate degree: 1,660
- Bachelor's degree: 2,686
- Master's degree: 1,254
- Professional school degree: 69
- Doctorate degree: 68
Housing units in structures:
- One, detached: 15,733
- One, attached: 399
- Two: 422
- 3 or 4: 419
- 5 to 9: 1,825
- 10 to 19: 1,640
- 20 to 49: 725
- 50 or more: 1,337
- Mobile homes: 317
- Boats, RVs, vans, etc.: 191
Housing units lacking complete kitchen facilities in 2022: 2.8%
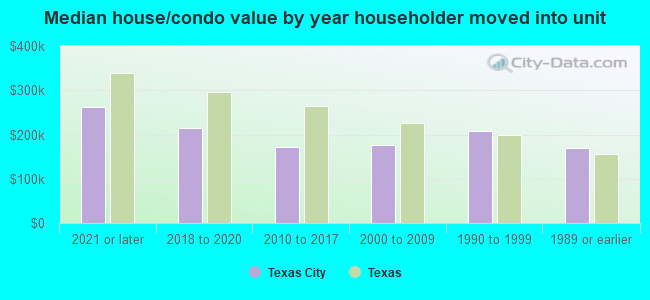
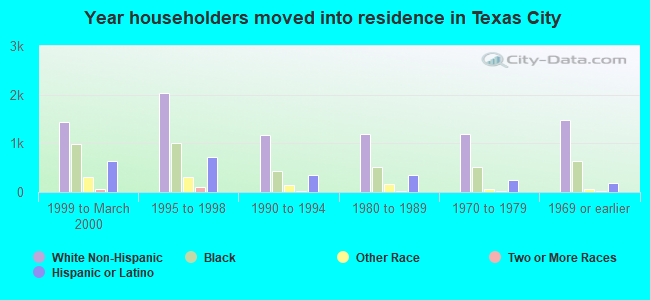
House/condo owner moved in on average 13 years ago
Renter moved in on average 4 years ago
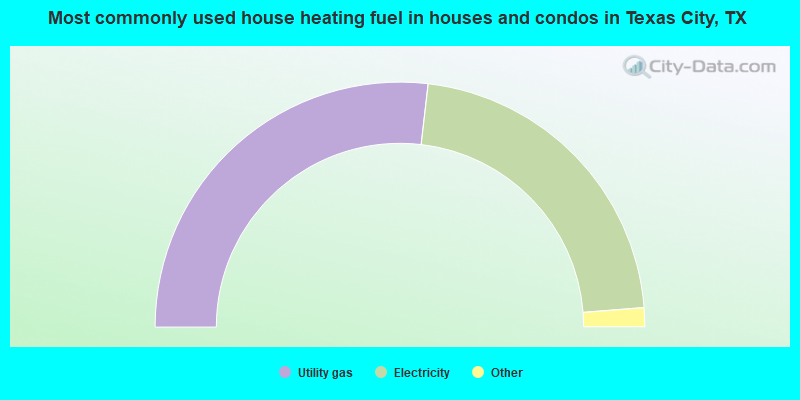
- 53.7%Utility gas
- 43.8%Electricity
- 1.7%Bottled, tank, or LP gas
- 0.5%No fuel used
- 0.2%Wood
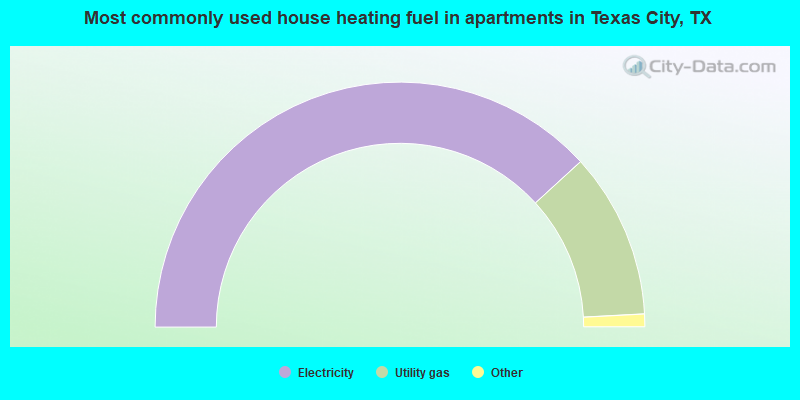
- 76.4%Electricity
- 21.9%Utility gas
- 1.3%Bottled, tank, or LP gas
- 0.4%No fuel used
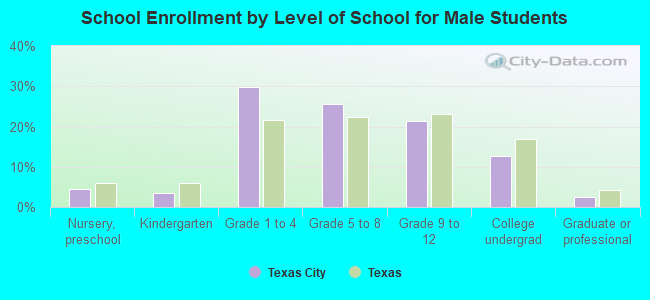
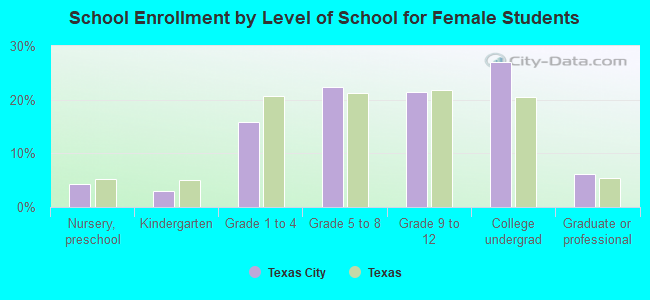
Private vs. public school enrollment:
| Here: | 17.1% |
| Texas: | 8.8% |
| Here: | 5.6% |
| Texas: | 8.0% |
| Here: | 17.2% |
| Texas: | 16.2% |