The Woodlands, TX (Texas) Houses and Residents
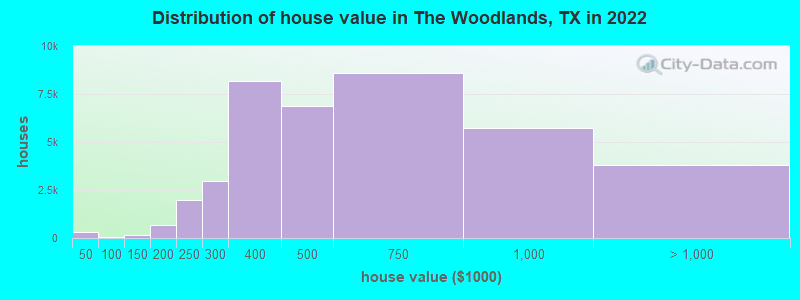
Estimated median house or condo value in 2022: $456,700 (it was $167,000 in 2000 )
The Woodlands:
$456,700Texas:
$275,400
Lower value quartile - upper value quartile: $334,000 - $678,100Mean price in 2022: Detached houses: $619,737 Here:
$619,737State:
$369,058
Townhouses or other attached units: $347,941 Here:
$347,941State:
$327,631
In 2-unit structures: $222,039 Here:
$222,039State:
$374,947
In 5-or-more-unit structures: $316,913 Here:
$316,913State:
$413,944
Mobile homes: $99,580 Here:
$99,580State:
$124,413
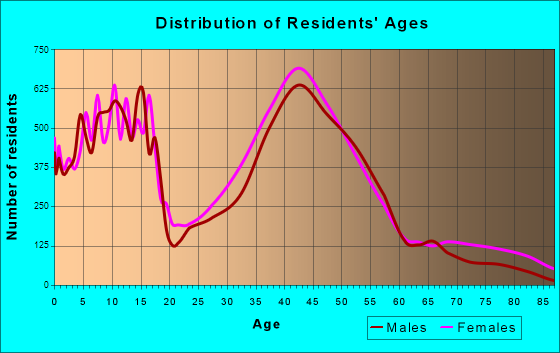
Total population: 93,847 (Urban population: 55,669, Rural population: 155 (all nonfarm) )
Houses: 47,776 (45,943 occupied: 33,151 owner occupied, 12,792 renter occupied )
% of renters here:
28%State:
38%
Housing density: 2,041 houses/condos per square mile
Median price asked for vacant for-sale houses and condos in 2022: $657,043.
Median contract rent in 2022: $1,642 (lower quartile is $1,078, upper quartile is over $2,000)
Median rent asked for vacant for-rent units in 2022: $1,389
Median gross rent in The Woodlands, TX in 2022: $1,691
Housing units in The Woodlands with a mortgage: 19,189 (1,117 second mortgage, 62 home equity loan, 740 both second mortgage and home equity loan )Houses without a mortgage: 600
Median household income for houses/condos with a mortgage: $183,998
Median household income for apartments without a mortgage: $122,976
Median monthly housing costs: $1,746
Data:
Median house or condo value ($)
Median house or condo value ($ change since 2000)
Median house or condo value ($) - White
Median house or condo value ($) - Black or African American
Median house or condo value ($) - Asian
Median house or condo value ($) - Hispanic or Latino
Median house or condo value ($) - American Indian and Alaska Native
Median house or condo value ($) - Multirace
Median house or condo value ($) - Other Race
Median price asked for mobile homes ($)
Household density (households per square mile)
Mean house or condo value by units in structure - 1, detached ($)
Mean house or condo value by units in structure - 1, attached ($)
Mean house or condo value by units in structure - 2 ($)
Mean house or condo value by units in structure by units in structure - 3 or 4 ($)
Mean house or condo value by units in structure - 5 or more ($)
Mean house or condo value by units in structure - Boat, RV, van, etc. ($)
Mean house or condo value by units in structure - Mobile home ($)
Median contract rent ($)
Median contract rent - Lower quartile ($)
Median contract rent - Upper quartile ($)
Median gross rent ($)
Urban houses (%)
Rural houses (%)
Houses occupied (%)
Houses occupied (% change since 2000)
Houses owner occupied (%)
Houses owner occupied (% change since 2000)
Houses renter occupied (%)
Houses renter occupied (% change since 2000)
Vacant housing units - For rent (%)
Vacant housing units - For rent (% change since 2000)
Vacant housing units - For sale only (%)
Vacant housing units - For sale only (% change since 2000)
Vacant housing units - Rented or sold, not occupied (%)
Vacant housing units - Rented or sold, not occupied (% change since 2000)
Vacant housing units - For seasonal, recreational, or occasional use (%)
Vacant housing units - For seasonal, recreational, or occasional use (% change since 2000)
Vacant housing units - For migrant workers (%)
Vacant housing units - For migrant workers (% change since 2000)
Vacant housing units - Other vacant (%)
Vacant housing units - Other vacant (% change since 2000)
Median monthly housing costs ($)
Median household income for houses/condos with a mortgage ($)
Median household income for houses/condos without a mortgage ($)
Median household income ($)
Median household income ($) - White
Median household income ($) - Black or African American
Median household income ($) - Asian
Median household income ($) - Hispanic or Latino
Median household income ($) - American Indian and Alaska Native
Median household income ($) - Multirace
Median household income ($) - Other Race
Mortgage status - with mortgage (%)
Mortgage status - with second mortgage (%)
Mortgage status - with home equity loan (%)
Mortgage status - with both second mortgage and home equity loan (%)
Mortgage status - without a mortgage (%)
Median year house/condo built
Median year apartment built
Household type by relationship - Male householder living alone (%)
Household type by relationship - Male householder not living alone (%)
Household type by relationship - Female householder living alone (%)
Household type by relationship - Female householder not living alone (%)
Household type by relationship - Opposite-Sex spouse (%)
Household type by relationship - Same-Sex spouse (%)
Household type by relationship - Opposite-Sex unmarried partner (%)
Household type by relationship - Same-Sex unmarried partner (%)
Household type by relationship - In group quarters (%)
Size of family households - 2-person household (%)
Size of family households - 3-person household (%)
Size of family households - 4-person household (%)
Size of family households - 5-person household (%)
Size of family households - 6-person household (%)
Size of family households - 7-or-more-person household (%)
Size of nonfamily households - 1-person household (%)
Size of nonfamily households - 2-person household (%)
Size of nonfamily households - 3-person household (%)
Size of nonfamily households - 4-person household (%)
Size of nonfamily households - 5-person household (%)
Size of nonfamily households - 6-person household (%)
Size of nonfamily households - 7-or-moreperson household (%)
Year house built - Built 2010 or later (%)
Year house built - Built 2000 to 2009 (%)
Year house built - Built 1990 to 1999 (%)
Year house built - Built 1980 to 1989 (%)
Year house built - Built 1970 to 1979 (%)
Year house built - Built 1960 to 1969 (%)
Year house built - Built 1950 to 1959 (%)
Year house built - Built 1940 to 1949 (%)
Year house built - Built 1939 or earlier (%)
Median number of rooms in houses and condos
Median number of rooms in apartments
Median number of bedrooms in owner occupied houses
Mean number of bedrooms in owner occupied houses
Median number of bedrooms in renter occupied houses
Mean number of bedrooms in renter occupied houses
Median number of vehichles in owner occupied houses
Mean number of vehichles in owner occupied houses
Median number of vehichles in renter occupied houses
Mean number of vehichles in renter occupied houses
Rooms in owner-occupied houses - 1 room (%)
Rooms in owner-occupied houses - 2 rooms (%)
Rooms in owner-occupied houses - 3 rooms (%)
Rooms in owner-occupied houses - 4 rooms (%)
Rooms in owner-occupied houses - 5 rooms (%)
Rooms in owner-occupied houses - 6 rooms (%)
Rooms in owner-occupied houses - 7 rooms (%)
Rooms in owner-occupied houses - 8 rooms (%)
Rooms in owner-occupied houses - 9+ rooms (%)
Rooms in renter-occupied houses - 1 room (%)
Rooms in renter-occupied houses - 2 rooms (%)
Rooms in renter-occupied houses - 3 rooms (%)
Rooms in renter-occupied houses - 4 rooms (%)
Rooms in renter-occupied houses - 5 rooms (%)
Rooms in renter-occupied houses - 6 rooms (%)
Rooms in renter-occupied houses - 7 rooms (%)
Rooms in renter-occupied houses - 8 rooms (%)
Rooms in renter-occupied houses - 9+ rooms (%)
Bedrooms in owner-occupied houses - no bedrooms (%)
Bedrooms in owner-occupied houses - 1 bedroom (%)
Bedrooms in owner-occupied houses - 2 bedrooms (%)
Bedrooms in owner-occupied houses - 3 bedrooms (%)
Bedrooms in owner-occupied houses - 4 bedrooms (%)
Bedrooms in owner-occupied houses - 5+ bedrooms (%)
Bedrooms in renter-occupied houses - no bedrooms (%)
Bedrooms in renter-occupied houses - 1 bedroom (%)
Bedrooms in renter-occupied houses - 2 bedrooms (%)
Bedrooms in renter-occupied houses - 3 bedrooms (%)
Bedrooms in renter-occupied houses - 4 bedrooms (%)
Bedrooms in renter-occupied houses - 5+ bedrooms (%)
Vehicles available in owner-occupied houses - no vehicle available (%)
Vehicles available in owner-occupied houses - 1 vehicle available(%)
Vehicles available in owner-occupied houses - 2 Vehicles available (%)
Vehicles available in owner-occupied houses - 3 Vehicles available (%)
Vehicles available in owner-occupied houses - 4 Vehicles available (%)
Vehicles available in owner-occupied houses - 5+ Vehicles available (%)
Vehicles available in renter-occupied houses - no vehicle available (%)
Vehicles available in renter-occupied houses - 1 vehicle available (%)
Vehicles available in renter-occupied houses - 2 Vehicles available (%)
Vehicles available in renter-occupied houses - 3 Vehicles available (%)
Vehicles available in renter-occupied houses - 4 Vehicles available (%)
Vehicles available in renter-occupied houses - 5+ Vehicles available (%)
Housing units in structures - 1, detached (%)
Housing units in structures - 1, attached (%)
Housing units in structures - 2 (%)
Housing units in structures - 3 or 4 (%)
Housing units in structures - 5 to 9 (%)
Housing units in structures - 10 to 19 (%)
Housing units in structures - 20 to 49 (%)
Housing units in structures - 50 or more (%)
Housing units in structures - Mobile home (%)
Housing units in structures - Boat, RV, van, etc. (%)
Housing units in structures - Owners - 1, detached (%)
Housing units in structures - Owners - 1, attached (%)
Housing units in structures - Owners - 2 (%)
Housing units in structures - Owners - 3 or 4 (%)
Housing units in structures - Owners - 5 to 9 (%)
Housing units in structures - Owners - 10 to 19 (%)
Housing units in structures - Owners - 20 to 49 (%)
Housing units in structures - Owners - 50 or more (%)
Housing units in structures - Owners - Mobile home (%)
Housing units in structures - Owners - Boat, RV, van, etc. (%)
Housing units in structures - Renters - 1, detached (%)
Housing units in structures - Renters - 1, attached (%)
Housing units in structures - Renters - 2 (%)
Housing units in structures - Renters - 3 or 4 (%)
Housing units in structures - Renters - 5 to 9 (%)
Housing units in structures - Renters - 10 to 19 (%)
Housing units in structures - Renters - 20 to 49 (%)
Housing units in structures - Renters - 50 or more (%)
Housing units in structures - Renters - Mobile home (%)
Housing units in structures - Renters - Boat, RV, van, etc. (%)
House/condo owner moved in on average (years ago)
Renter moved in on average (years ago)
Year householder moved into unit - Moved in 1999 to March 2000 (%)
Year householder moved into unit - Moved in 1999 to March 2000 (%) - White
Year householder moved into unit - Moved in 1999 to March 2000 (%) - Black or African American
Year householder moved into unit - Moved in 1999 to March 2000 (%) - Asian
Year householder moved into unit - Moved in 1999 to March 2000 (%) - Hispanic or Latino
Year householder moved into unit - Moved in 1999 to March 2000 (%) - American Indian and Alaska Native
Year householder moved into unit - Moved in 1999 to March 2000 (%) - Multirace
Year householder moved into unit - Moved in 1999 to March 2000 (%) - Other Race
Year householder moved into unit - Moved in 1995 to 1998 (%)
Year householder moved into unit - Moved in 1995 to 1998 (%) - White
Year householder moved into unit - Moved in 1995 to 1998 (%) - Black or African American
Year householder moved into unit - Moved in 1995 to 1998 (%) - Asian
Year householder moved into unit - Moved in 1995 to 1998 (%) - Hispanic or Latino
Year householder moved into unit - Moved in 1995 to 1998 (%) - American Indian and Alaska Native
Year householder moved into unit - Moved in 1995 to 1998 (%) - Multirace
Year householder moved into unit - Moved in 1995 to 1998 (%) - Other Race
Year householder moved into unit - Moved in 1990 to 1994 (%)
Year householder moved into unit - Moved in 1990 to 1994 (%) - White
Year householder moved into unit - Moved in 1990 to 1994 (%) - Black or African American
Year householder moved into unit - Moved in 1990 to 1994 (%) - Asian
Year householder moved into unit - Moved in 1990 to 1994 (%) - Hispanic or Latino
Year householder moved into unit - Moved in 1990 to 1994 (%) - American Indian and Alaska Native
Year householder moved into unit - Moved in 1990 to 1994 (%) - Multirace
Year householder moved into unit - Moved in 1990 to 1994 (%) - Other Race
Year householder moved into unit - Moved in 1980 to 1989 (%)
Year householder moved into unit - Moved in 1980 to 1989 (%) - White
Year householder moved into unit - Moved in 1980 to 1989 (%) - Black or African American
Year householder moved into unit - Moved in 1980 to 1989 (%) - Asian
Year householder moved into unit - Moved in 1980 to 1989 (%) - Hispanic or Latino
Year householder moved into unit - Moved in 1980 to 1989 (%) - American Indian and Alaska Native
Year householder moved into unit - Moved in 1980 to 1989 (%) - Multirace
Year householder moved into unit - Moved in 1980 to 1989 (%) - Other Race
Year householder moved into unit - Moved in 1970 to 1979 (%)
Year householder moved into unit - Moved in 1970 to 1979 (%) - White
Year householder moved into unit - Moved in 1970 to 1979 (%) - Black or African American
Year householder moved into unit - Moved in 1970 to 1979 (%) - Asian
Year householder moved into unit - Moved in 1970 to 1979 (%) - Hispanic or Latino
Year householder moved into unit - Moved in 1970 to 1979 (%) - American Indian and Alaska Native
Year householder moved into unit - Moved in 1970 to 1979 (%) - Multirace
Year householder moved into unit - Moved in 1970 to 1979 (%) - Other Race
Year householder moved into unit - Moved in 1969 or earlier (%)
Year householder moved into unit - Moved in 1969 or earlier (%) - White
Year householder moved into unit - Moved in 1969 or earlier (%) - Black or African American
Year householder moved into unit - Moved in 1969 or earlier (%) - Asian
Year householder moved into unit - Moved in 1969 or earlier (%) - Hispanic or Latino
Year householder moved into unit - Moved in 1969 or earlier (%) - American Indian and Alaska Native
Year householder moved into unit - Moved in 1969 or earlier (%) - Multirace
Year householder moved into unit - Moved in 1969 or earlier (%) - Other Race
Housing units lacking complete plumbing facilities (%)
Housing units lacking complete kitchen facilities (%)
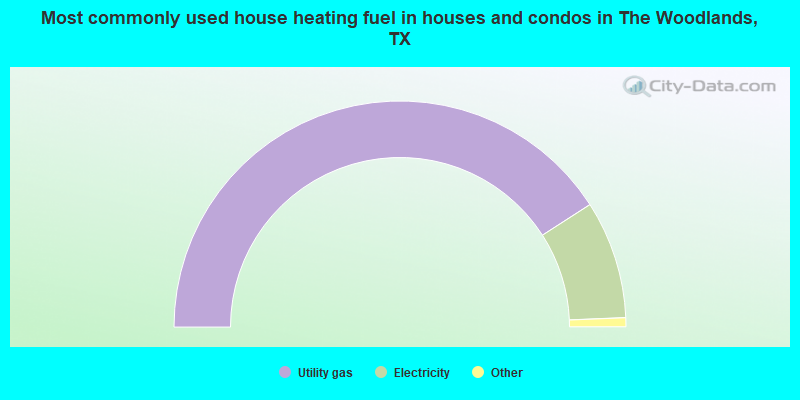
House heating fuel used in houses and condos - Utility gas (%)
House heating fuel used in houses and condos - Bottled, tank, or LP gas (%)
House heating fuel used in houses and condos - Electricity (%)
House heating fuel used in houses and condos - Fuel oil, kerosene, etc. (%)
House heating fuel used in houses and condos - Coal or coke (%)
House heating fuel used in houses and condos - Wood (%)
House heating fuel used in houses and condos - Solar energy (%)
House heating fuel used in houses and condos - Other fuel (%)
House heating fuel used in houses and condos - No fuel used (%)
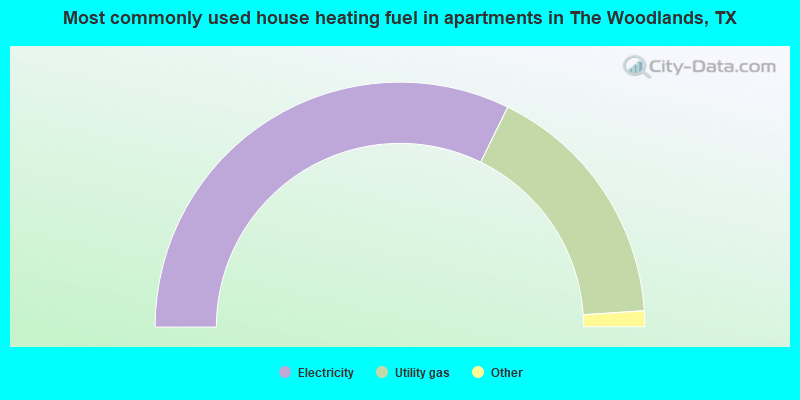
House heating fuel used in apartments - Utility gas (%)
House heating fuel used in apartments - Bottled, tank, or LP gas (%)
House heating fuel used in apartments - Electricity (%)
House heating fuel used in apartments - Fuel oil, kerosene, etc. (%)
House heating fuel used in apartments - Coal or coke (%)
House heating fuel used in apartments - Wood (%)
House heating fuel used in apartments - Solar energy (%)
House heating fuel used in apartments - Other fuel (%)
House heating fuel used in apartments - No fuel used (%)
Median year house/condo built: 1999Median year apartment built: 2004Household type by relationship:
Households: 117,970
Male householders: 24,429 (4,317 living alone ), Female householders: 21,514 (7,722 living alone )28,554 spouses (28,554 opposite-sex spouses ), 1,353 unmarried partners , (1,197 opposite-sex unmarried partners ), 38,068 children (37,138 natural , 219 adopted , 711 stepchildren ), 225 grandchildren , 85 brothers or sisters , 590 parents , 0 foster children , 596 other relatives , 2,044 non-relatives In group quarters: 512
Size of family households: 14,220 2-persons , 7,791 3-persons , 6,711 4-persons , 1,702 5-persons , 1,768 6-persons , 495 7-or-more-persons .
Size of nonfamily households: 12,039 1-person , 1,217 2-persons .
29,490 married couples with children. single-parent households (600 men , 2,969 women ).
76.1% of residents of The Woodlands speak English at home. of residents speak Spanish at home (80% speak English very well , 14% speak English well , 3% speak English not well , 2% don't speak English at all ).of residents speak other Indo-European language at home (80% speak English very well , 18% speak English well , 2% speak English not well ).of residents speak Asian or Pacific Island language at home (66% speak English very well , 18% speak English well , 15% speak English not well , 1% don't speak English at all ).of residents speak other language at home (88% speak English very well , 12% speak English well ).
Foreign born population: 31,205 (26.5%)of them are naturalized citizens )
Median number of rooms in houses and condos:
Median number of rooms in apartments
Owner-occupied Renter-occupied
Bedrooms in owner-occupied houses and condos in The Woodlands, Texas
91 no bedroom 313 1 bedroom 1,746 2 bedrooms 10,333 3 bedrooms 14,644 4 bedrooms 6,024 5+ bedrooms
Bedrooms in renter-occupied apartments in The Woodlands, Texas
0 no bedroom 5,386 1 bedroom 3,577 2 bedrooms 2,118 3 bedrooms 1,280 4 bedrooms 431 5+ bedrooms
Owner-occupied Renter-occupied
Rooms in owner-occupied houses in The Woodlands, Texas
33 1 room 68 2 rooms 458 3 rooms 961 4 rooms 3,385 5 rooms 5,063 6 rooms 4,593 7 rooms 5,360 8 rooms 13,230 9+ rooms
Rooms in renter-occupied apartments in The Woodlands, Texas
0 1 room 1,862 2 rooms 3,704 3 rooms 2,563 4 rooms 1,469 5 rooms 867 6 rooms 1,235 7 rooms 299 8 rooms 793 9+ rooms
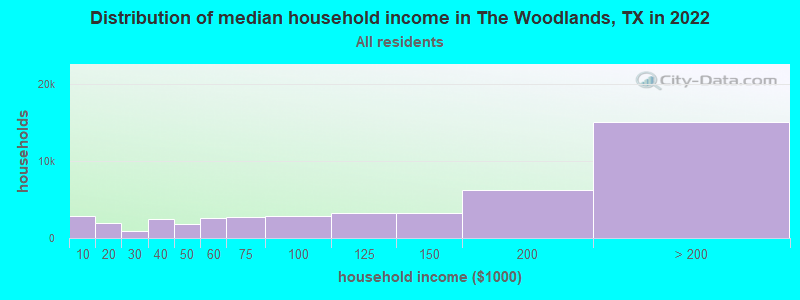
The Woodlands, TX household income distribution 2,830 Less than $10,0002,007 $10,000 to $19,999885 $20,000 to $29,9992,452 $30,000 to $39,9991,832 $40,000 to $49,9992,596 $50,000 to $59,9992,683 $60,000 to $74,9992,839 $75,000 to $99,9993,235 $100,000 to $124,9993,289 $125,000 to $149,9996,190 $150,000 to $199,99915,105 $200,000 or more
Home value of owner - occupied houses in 2022 in The Woodlands, TX 136 Less than $10,00047 $15,000 to $19,9993 $20,000 to $24,99916 $25,000 to $29,99913 $30,000 to $34,999107 $35,000 to $39,9998 $40,000 to $49,9996 $50,000 to $59,99910 $60,000 to $69,99931 $80,000 to $89,99981 $100,000 to $124,99994 $125,000 to $149,999406 $150,000 to $174,999250 $175,000 to $199,9991,974 $200,000 to $249,9992,975 $250,000 to $299,9998,170 $300,000 to $399,9996,890 $400,000 to $499,9998,590 $500,000 to $749,9995,706 $750,000 to $999,9992,578 $1,000,000 to $1,499,999675 $1,500,000 to $1,999,999539 $2,000,000 or moreRent paid by renters in 2022 in The Woodlands, TX 59 Less than $10010 $100 to $149156 $150 to $199212 $200 to $249152 $250 to $29928 $300 to $34978 $350 to $39918 $400 to $44923 $450 to $49956 $500 to $54911 $550 to $59949 $600 to $64929 $650 to $69937 $750 to $799756 $800 to $899253 $900 to $9992,460 $1,000 to $1,2491,586 $1,250 to $1,4992,894 $1,500 to $1,9992,294 $2,000 to $2,499730 $2,500 to $2,9991,465 $3,000 to $3,499668 $3,500 or more438 No cash rent
Percentage of workers working in this county: 71.1%Number of people working at home: 14,337 (24.9% of all workers )
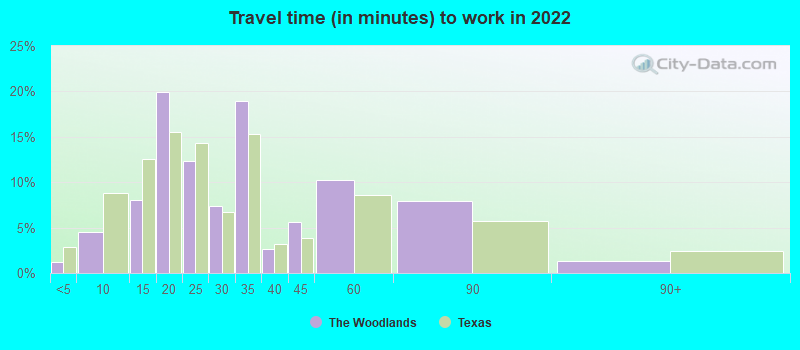
Travel time to work (commute)
Less than 5 minutes: 7045 to 9 minutes: 2,61310 to 14 minutes: 4,96215 to 19 minutes: 8,98520 to 24 minutes: 4,09725 to 29 minutes: 1,82730 to 34 minutes: 5,27335 to 39 minutes: 93940 to 44 minutes: 1,15245 to 59 minutes: 3,23060 to 89 minutes: 3,99390 or more minutes: 439
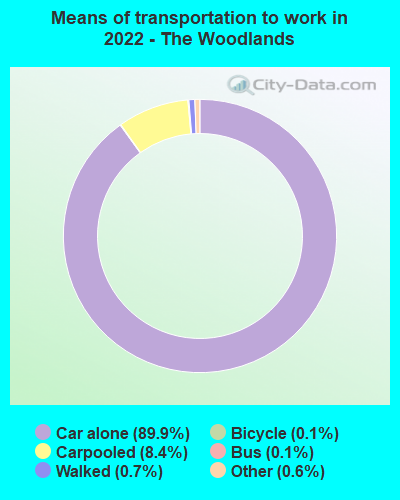
Means of transportation to work:
Drove a car alone: 52,875 (70.7%)Carpooled: 5,627 (7.5%)Bus : 35 (0.0%)Taxi: 513 (0.7%)Bicycle: 38 (0.1%)Walked: 529 (0.7%)Worked at home: 14,337 (19.2%)
Unemployment by race in 2022
Unemployment rate for White non-Hispanic residents 4.9% Males4.9% FemalesUnemployment rate for Black residents 8.9% Males3.7% FemalesUnemployment rate for American Indian and Alaska Native residents 42.0% MalesUnemployment rate for Asian residents 5.1% Males1.0% FemalesUnemployment rate for other race residents 6.4% Males19.0% FemalesUnemployment rate for two or more race residents 0.5% Males2.2% FemalesUnemployment rate for Hispanic or Latino residents 4.9% Males0.9% Females
Year of entry for the foreign-born population in The Woodlands, Texas
15,906 2010 or later 4,796 2000 to 2009 3,718 1990 to 1999 1,515 1980 to 1989 914 1970 to 1979 675 Before 1970
First ancestries reported:
English: 6,353 (11.4%)
German: 4,614 (8.3%)
American: 4,266 (7.6%)
Irish: 3,208 (5.7%)
European: 1,830 (3.3%)
Italian: 1,400 (2.5%)
Scottish: 1,326 (2.4%)
French: 924 (1.7%)
Portuguese: 704 (1.3%)
Canadian: 654 (1.2%)
Scotch-Irish: 621 (1.1%)
Turkish: 542 (1.0%)
Polish: 514 (0.9%)
British: 479 (0.9%)
Russian: 408 (0.7%)
Swedish: 378 (0.7%)
Lithuanian: 378 (0.7%)
Dutch: 365 (0.7%)
Ukrainian: 339 (0.6%)
Norwegian: 321 (0.6%)
Brazilian: 272 (0.5%)
Welsh: 233 (0.4%)
French Canadian: 222 (0.4%)
Austrian: 203 (0.4%)
Nigerian: 180 (0.3%)
Scandinavian: 177 (0.3%)
Iranian: 171 (0.3%)
Eastern European: 166 (0.3%)
Lebanese: 164 (0.3%)
Hungarian: 149 (0.3%)
Czech: 148 (0.3%)
Slovene: 129 (0.2%)
Croatian: 112 (0.2%)
Arab: 104 (0.2%)
Kenyan: 97 (0.2%)
Greek: 91 (0.2%)
Slavic: 88 (0.2%)
African: 84 (0.2%)
South African: 82 (0.1%)
Belgian: 80 (0.1%)
Danish: 75 (0.1%)
Australian: 74 (0.1%)
Jamaican: 61 (0.1%)
Maltese: 58 (0.1%)
Palestinian: 57 (0.1%)
Slovak: 54 (0.10%)
Swiss: 54 (0.10%)
Cajun: 50 (0.09%)
Northern European: 46 (0.08%)
Serbian: 34 (0.06%)
Israeli: 34 (0.06%)
Albanian: 25 (0.04%)
Finnish: 23 (0.04%)
Armenian: 20 (0.04%)
Bulgarian: 15 (0.03%)
Jordanian: 12 (0.02%)
Syrian: 9 (0.02%)
Luxembourger: 9 (0.02%)
Egyptian: 7 (0.01%)
Belizean: 7 (0.01%)
Czechoslovakian: 4 (0.01%)
Most common places of birth for foreign-born residents (%): Mexico The Woodlands:
20.9% (5,200)Texas:
48.4% (2,411,723)
Canada The Woodlands:
8.3% (2,055)Texas:
1.1% (55,371)
India The Woodlands:
6.6% (1,636)Texas:
6.1% (306,347)
Venezuela The Woodlands:
6.2% (1,546)Texas:
1.5% (72,413)
China, excluding Hong Kong and Taiwan The Woodlands:
6.1% (1,521)Texas:
2.3% (115,558)
Argentina The Woodlands:
4.3% (1,074)Texas:
0.3% (13,034)
United Kingdom, excluding England and Scotland The Woodlands:
4.1% (1,014)Texas:
0.5% (26,969)
Colombia The Woodlands:
2.9% (720)Texas:
1.2% (61,555)
England The Woodlands:
2.3% (577)Texas:
0.4% (20,885)
Turkey The Woodlands:
2.3% (570)Texas:
0.3% (13,298)
Vietnam The Woodlands:
2.2% (552)Texas:
3.7% (184,770)
Russia The Woodlands:
2.0% (496)Texas:
0.3% (16,984)
Australia The Woodlands:
2.0% (491)Texas:
0.1% (7,179)
South Africa The Woodlands:
2.0% (486)Texas:
0.2% (11,402)
El Salvador The Woodlands:
1.6% (392)Texas:
4.5% (224,455)
Place of birth for U.S.-born residents:
This state: 42,257Other state: 41,600Northeast: 7,203Midwest: 10,843South: 13,933West: 9,621 84.2% of The Woodlands residents lived in the same house 1 years ago.
Out of people who lived in different houses, 28.8% lived in this county.
Out of people who lived in different counties, 47.4% lived in Texas.
The Woodlands:
84.2%State average:
85.7%
Education attainment for males 25 years and older:
No schooling: 821Nursery to 4th grade: 545th and 6th grade: 967th and 8th grade: 09th grade: 6210th grade: 011th grade: 012th grade, no diploma: 348High school graduate (or equivalency): 2,476Less than 1 year of college: 1,655Some college more than 1 year, no degree: 2,603Associate degree: 1,068Bachelor's degree: 15,341Master's degree: 8,477Professional school degree: 1,397Doctorate degree: 1,793
Education attainment for females 25 years and older:
No schooling: 424Nursery to 4th grade: 05th and 6th grade: 287th and 8th grade: 2809th grade: 4710th grade: 15611th grade: 012th grade, no diploma: 1,525High school graduate (or equivalency): 3,248Less than 1 year of college: 3,220Some college more than 1 year, no degree: 3,181Associate degree: 2,541Bachelor's degree: 17,009Master's degree: 10,318Professional school degree: 1,686Doctorate degree: 483
Housing units in structures:
One, detached: 35,739One, attached: 2,287Two: 2495 to 9: 80410 to 19: 2,31420 to 49: 70650 or more: 5,209Mobile homes: 468Housing units lacking complete plumbing facilities in 2022: 1.3%Housing units lacking complete kitchen facilities in 2022: 1.0%House/condo owner moved in on average 10 years ago
Renter moved in on average 1 years ago
Private vs. public school enrollment:
Students in private schools in grades 1 to 8 (elementary and middle school): 860 Students in private schools in grades 9 to 12 (high school): 813 Students in private undergraduate colleges: 497