Thompsonville, MI (Michigan) Houses and Residents
| Thompsonville: | $121,852 |
| Michigan: | $224,400 |
Mean price in 2022:
Detached houses: $155,357
Here: $155,357 State: $280,038 Mobile homes: $48,602
Here: $48,602 State: $72,868
Total population: 438 (Urban population: 0, Rural population: 506 (all nonfarm))
Houses: 279 (207 occupied: 156 owner occupied, 54 renter occupied)
| % of renters here: | 26% |
| State: | 27% |
Housing density: 277 houses/condos per square mile
Median price asked for vacant for-sale houses and condos in 2022 in this county: $164,378.
Median gross rent in Thompsonville, MI in 2022: $-676,309,867
Housing units in Thompsonville with a mortgage: 95 (2 second mortgage, 0 home equity loan, 0 both second mortgage and home equity loan)
Houses without a mortgage: 0
Median household income for houses/condos with a mortgage: $62,732
Median household income for apartments without a mortgage: $69,078
Median monthly housing costs: $844
Compare current foreclosures near Thompsonville, MI:
| Photo | Address | Area | Beds / Baths | Price | Details |
|---|---|---|---|---|---|

|
#1
County Line Rd
Thompsonville, MI 49683
|
1,092 sq. feet
|
1 baths 3 beds |
show details | |

|
#2
3rd St
Thompsonville, MI 49683
|
- sq. feet
|
- baths - beds |
show details | |

|
#3
Leckrone Rd
Brethren, MI 49619
|
1,450 sq. feet
|
2 baths 3 beds |
$254,000
|
show details |

|
#4
3rd St
Thompsonville, MI 49683
|
- sq. feet
|
- baths - beds |
show details | |

|
#5
Ringneck Ln
Buckley, MI 49620
|
- sq. feet
|
2 baths 3 beds |
show details | |

|
#6
S Haze Rd
Beulah, MI 49617
|
- sq. feet
|
3 baths 4 beds |
show details | |

|
#7
Leckrone Rd
Brethren, MI 49619
|
- sq. feet
|
- baths - beds |
show details | |

|
#8
Wilderness Trl
Kaleva, MI 49645
|
- sq. feet
|
- baths - beds |
show details | |

|
#9
N 11 Rd
Mesick, MI 49668
|
- sq. feet
|
- baths - beds |
show details | |

|
#10
Laredo Dr
Kingsley, MI 49649
|
- sq. feet
|
- baths - beds |
show details |
| Photo | Address | Area | Beds / Baths | Price | Details |
|---|---|---|---|---|---|

|
#11
Mobile Trl E
Traverse City, MI 49685
|
- sq. feet
|
- baths - beds |
show details | |

|
#12
Cinder Rd
Interlochen, MI 49643
|
- sq. feet
|
- baths - beds |
show details | |

|
#13
S Curry Dr
Traverse City, MI 49685
|
- sq. feet
|
- baths - beds |
show details | |

|
#14
Litzen Rd
Copemish, MI 49625
|
- sq. feet
|
- baths - beds |
show details | |

|
#15
Ponemah Trl
Buckley, MI 49620
|
- sq. feet
|
- baths - beds |
show details | |

|
#16
N Long Lake Rd
Traverse City, MI 49685
|
- sq. feet
|
- baths - beds |
show details | |

|
#17
Sawyer Rd
Traverse City, MI 49685
|
- sq. feet
|
- baths - beds |
show details | |

|
#18
Old M 37 Hwy
Mesick, MI 49668
|
- sq. feet
|
- baths - beds |
show details | |

|
#19
Carl Rd
Traverse City, MI 49685
|
- sq. feet
|
- baths - beds |
show details | |

|
#20
Melody Ln
Interlochen, MI 49643
|
- sq. feet
|
- baths - beds |
show details |
| Photo | Address | Area | Beds / Baths | Price | Details |
|---|---|---|---|---|---|

|
#21
S Woodmeadows Dr
Buckley, MI 49620
|
- sq. feet
|
- baths - beds |
show details | |

|
#22
Deadstream Rd
Honor, MI 49640
|
- sq. feet
|
- baths - beds |
show details | |

|
#23
S M 37
Buckley, MI 49620
|
- sq. feet
|
- baths - beds |
show details | |

|
#24
Wildwood Rd
Interlochen, MI 49643
|
- sq. feet
|
- baths - beds |
show details | |

|
#25
Dugreen
Interlochen, MI 49643
|
- sq. feet
|
- baths - beds |
show details | |

|
#26
Beers Rd
Copemish, MI 49625
|
- sq. feet
|
- baths - beds |
show details | |

|
#27
Zue Rd
Buckley, MI 49620
|
- sq. feet
|
- baths - beds |
show details | |

|
#28
Spruce Dr # 6
Benzonia, MI 49616
|
- sq. feet
|
- baths - beds |
show details | |

|
#29
Sleepy Hollow Ln
Interlochen, MI 49643
|
- sq. feet
|
- baths - beds |
show details | |

|
#30
Homestead Rd
Beulah, MI 49617
|
- sq. feet
|
- baths - beds |
show details |
| Photo | Address | Area | Beds / Baths | Price | Details |
|---|---|---|---|---|---|

|
#31
N Long Lake Rd
Traverse City, MI 49685
|
- sq. feet
|
- baths - beds |
show details | |

|
Check over 1 million property listings on Foreclosure.com!
|
browse all offers | |||

Latest news about housing in Thompsonville, MI collected exclusively by city-data.com from local newspapers, TV, and radio stations

 | Calling Traverse City home! (12 replies) |

Median year apartment built: 1979
Household type by relationship:
Households: 450- Male householders: 106 (40 living alone), Female householders: 98 (33 living alone)
79 spouses (77 opposite-sex spouses), 8 unmarried partners, (8 opposite-sex unmarried partners), 126 children (111 natural, 6 adopted, 7 stepchildren), 5 grandchildren, 2 brothers or sisters, 2 parents, 0 foster children, 2 other relatives, 14 non-relatives
Size of family households: 69 2-persons, 8 3-persons, 27 4-persons, 9 5-persons, 3 6-persons.
Size of nonfamily households: 77 1-person, 13 2-persons, 1 3-persons.
67 married couples with children.
14 single-parent households (0 men, 14 women).
95.6% of residents of Thompsonville speak English at home.
0.9% of residents speak Spanish at home (100% speak English very well).
2.8% of residents speak other Indo-European language at home (67% speak English very well, 33% speak English well).
Foreign born population: 24 (5.3%)
(33.3% of them are naturalized citizens)
| Here: | 6.5 |
| State: | 6.5 |
| Here: | 3.9 |
| State: | 4.3 |

- Bedrooms in owner-occupied houses and condos in Thompsonville, Michigan
- 0no bedroom
- 01 bedroom
- 442 bedrooms
- 883 bedrooms
- 244 bedrooms
- 05+ bedrooms

- Bedrooms in renter-occupied apartments in Thompsonville, Michigan
- 6no bedroom
- 151 bedroom
- 232 bedrooms
- 93 bedrooms
- 04 bedrooms
- 05+ bedrooms

- Cars and other vehicles available in Thompsonville in owner-occupied houses/condos
- 6no vehicle
- 461 vehicle
- 782 vehicles
- 263 vehicles
- 04 vehicles
- 15+ vehicles

- Cars and other vehicles available in Thompsonville in renter-occupied apartments
- 7no vehicle
- 281 vehicle
- 182 vehicles
- 13 vehicles
- 04 vehicles
- 05+ vehicles

- Rooms in owner-occupied houses in Thompsonville, Michigan
- 01 room
- 02 rooms
- 13 rooms
- 194 rooms
- 365 rooms
- 226 rooms
- 267 rooms
- 408 rooms
- 129+ rooms

- Rooms in renter-occupied apartments in Thompsonville, Michigan
- 01 room
- 62 rooms
- 93 rooms
- 264 rooms
- 35 rooms
- 46 rooms
- 47 rooms
- 28 rooms
- 09+ rooms


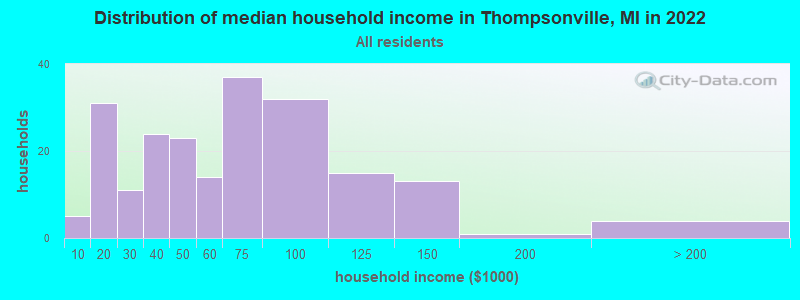
Thompsonville, MI household income distribution

- 5Less than $10,000
- 31$10,000 to $19,999
- 11$20,000 to $29,999
- 24$30,000 to $39,999
- 23$40,000 to $49,999
- 14$50,000 to $59,999
- 37$60,000 to $74,999
- 32$75,000 to $99,999
- 15$100,000 to $124,999
- 13$125,000 to $149,999
- 1$150,000 to $199,999
- 4$200,000 or more
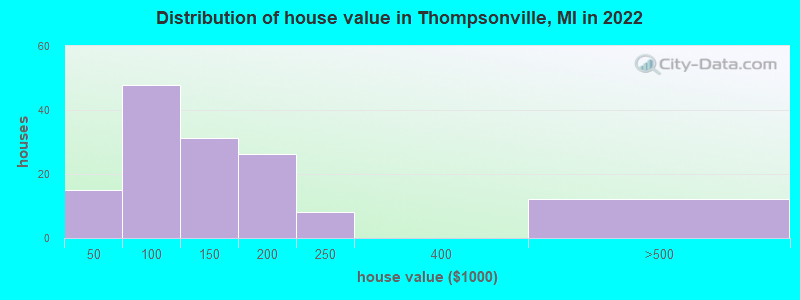
Home value of owner - occupied houses in 2022 in Thompsonville, MI
-
- 0Less than $10,000
- 1$10,000 to $14,999
- 1$20,000 to $24,999
- 5$30,000 to $34,999
- 1$35,000 to $39,999
- 3$40,000 to $49,999
- 13$50,000 to $59,999
- 8$60,000 to $69,999
- 0$70,000 to $79,999
- 9$80,000 to $89,999
- 11$90,000 to $99,999
- 14$100,000 to $124,999
- 16$125,000 to $149,999
- 16$150,000 to $174,999
- 9$175,000 to $199,999
- 7$200,000 to $249,999
- 12$400,000 to $499,999
Rent paid by renters in 2022 in Thompsonville, MI
-
- 1$100 to $149
- 7$200 to $249
- 4$250 to $299
- 9$300 to $349
- 1$500 to $549
- 1$550 to $599
- 3$750 to $799
- 3$800 to $899
- 3$900 to $999
- 5$1,000 to $1,249
- 2$1,250 to $1,499
- 8No cash rent


Percentage of workers working in this county: 56.4%
Number of people working at home: 14 (6.2% of all workers)
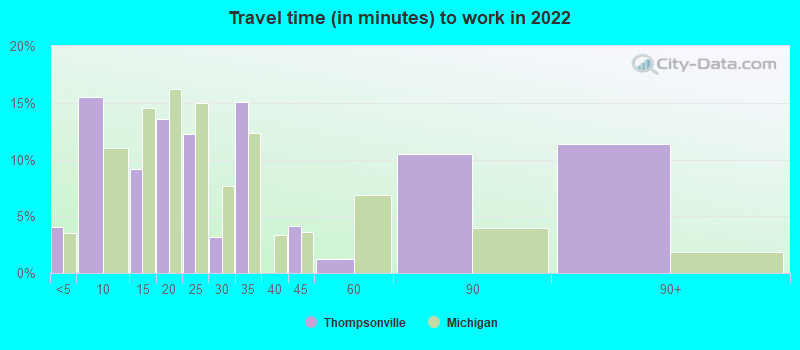
Travel time to work (commute)
- Less than 5 minutes: 30
- 5 to 9 minutes: 36
- 10 to 14 minutes: 13
- 15 to 19 minutes: 14
- 20 to 24 minutes: 19
- 25 to 29 minutes: 16
- 30 to 34 minutes: 39
- 35 to 39 minutes: 3
- 40 to 44 minutes: 9
- 45 to 59 minutes: 22
- 60 to 89 minutes: 0
- 90 or more minutes: 2
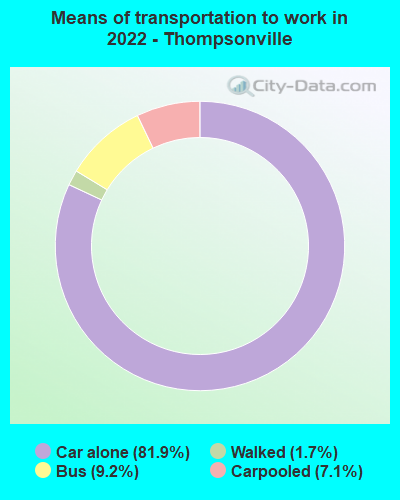
Means of transportation to work:
- Drove a car alone: 186 (74.4%)
- Carpooled: 16 (6.4%)
- Bus or trolley bus: 17 (6.8%)
- Walked: 3 (1.2%)
- Worked at home: 16 (6.4%)

- Unemployment by race in 2022
- Unemployment rate for White non-Hispanic residents
- 5.1%Males

- Year of entry for the foreign-born population in Thompsonville, Michigan
- 152010 or later
- 02000 to 2009
- 71990 to 1999
- 21980 to 1989
- 01970 to 1979
- 0Before 1970

First ancestries reported:
- German: 25 (18.9%)
- American: 16 (12.1%)
- English: 8 (6.0%)
- French: 4 (3.0%)
- French Canadian: 3 (2.3%)
- Irish: 3 (2.3%)
- Czech: 2 (1.5%)
- Scottish: 2 (1.5%)
- Czechoslovakian: 1 (0.8%)
- Dutch: 1 (0.8%)
- Polish: 1 (0.8%)
Most common places of birth for foreign-born residents (%):
| Thompsonville: | 66.7% (16) |
| Michigan: | 2.6% (18,065) |
| Thompsonville: | 29.2% (7) |
| Michigan: | 5.0% (35,052) |
| Thompsonville: | 8.3% (2) |
| Michigan: | 2.3% (16,126) |
Place of birth for U.S.-born residents:
- This state: 371
- Other state: 54
- Northeast: 4
- Midwest: 14
- South: 22
- West: 13
92.4% of Thompsonville residents lived in the same house 1 years ago.
Out of people who lived in different houses, 22.7% lived in this county.
Out of people who lived in different counties, 96.0% lived in Michigan.
| Thompsonville: | 92.4% |
| State average: | 88.4% |
Education attainment for males 25 years and older:
- No schooling: 7
- Nursery to 4th grade: 0
- 5th and 6th grade: 0
- 7th and 8th grade: 0
- 9th grade: 4
- 10th grade: 11
- 11th grade: 1
- 12th grade, no diploma: 5
- High school graduate (or equivalency): 63
- Less than 1 year of college: 28
- Some college more than 1 year, no degree: 19
- Associate degree: 7
- Bachelor's degree: 6
- Master's degree: 13
- Professional school degree: 0
- Doctorate degree: 0

Education attainment for females 25 years and older:
- No schooling: 0
- Nursery to 4th grade: 0
- 5th and 6th grade: 0
- 7th and 8th grade: 5
- 9th grade: 5
- 10th grade: 0
- 11th grade: 4
- 12th grade, no diploma: 3
- High school graduate (or equivalency): 67
- Less than 1 year of college: 22
- Some college more than 1 year, no degree: 12
- Associate degree: 20
- Bachelor's degree: 14
- Master's degree: 0
- Professional school degree: 0
- Doctorate degree: 0


Housing units in structures:
- One, detached: 191
- Two: 4
- 3 or 4: 2
- 5 to 9: 5
- 10 to 19: 34
- Mobile homes: 43
Median worth of mobile homes: $64,366
House/condo owner moved in on average 12 years ago
Renter moved in on average 3 years ago

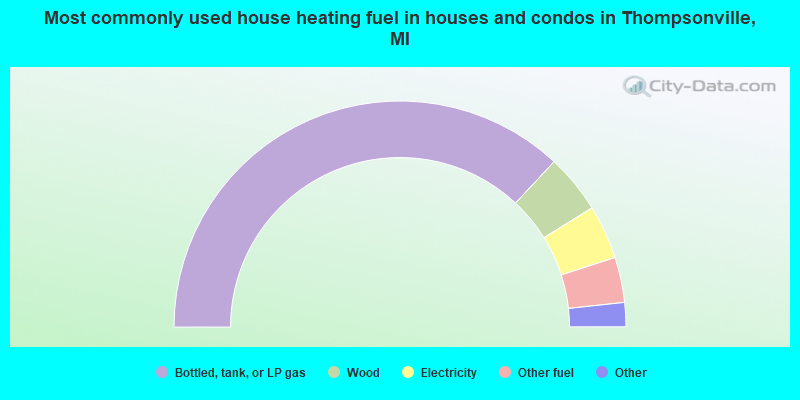
- 74.5%Bottled, tank, or LP gas
- 8.5%Wood
- 7.8%Electricity
- 6.5%Other fuel
- 1.3%Utility gas
- 1.3%Fuel oil, kerosene, etc.
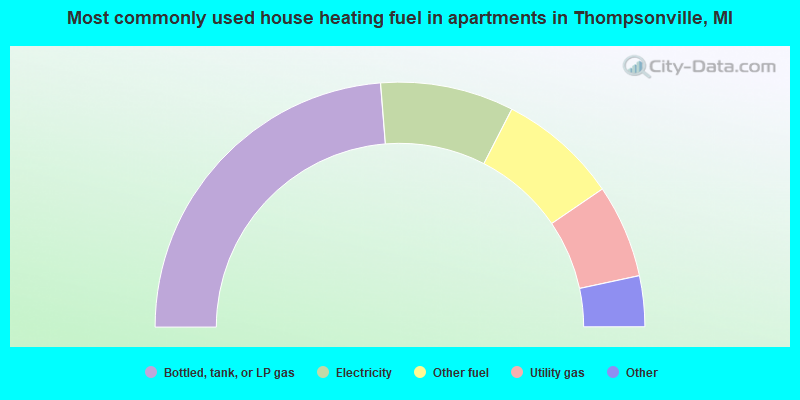
- 50.9%Bottled, tank, or LP gas
- 18.9%Electricity
- 17.0%Other fuel
- 13.2%Utility gas
Private vs. public school enrollment:
| Here: | 0.0% |
| Michigan: | 12.4% |
| Here: | 15.4% |
| Michigan: | 9.8% |
| Here: | 0.0% |
| Michigan: | 14.9% |


