Housing density: 1,350 houses/condos per square mile
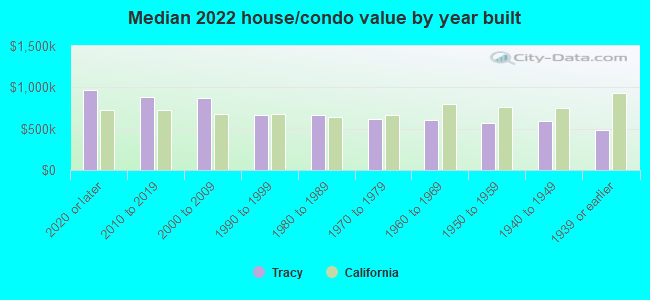
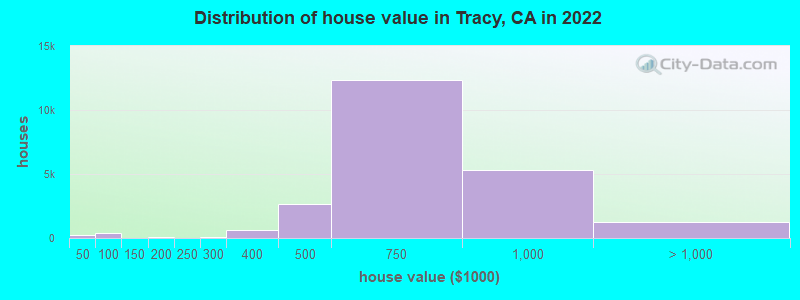
Median price asked for vacant for-sale houses and condos in 2022: $1,054,115.
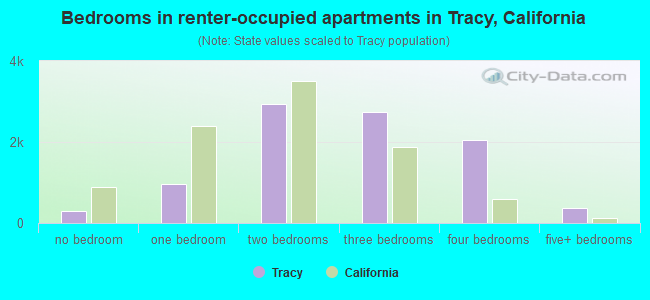
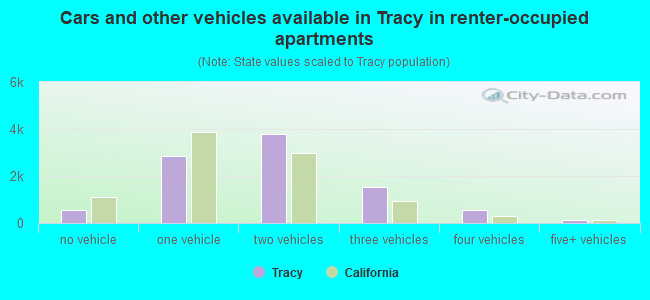
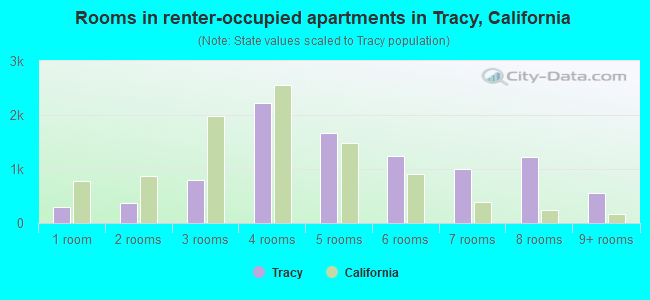
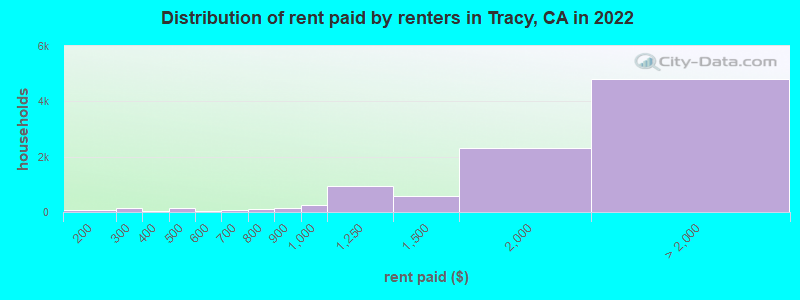
Median contract rent in 2022: $1,980 (lower quartile is $1,345, upper quartile is over $2,000)
Median rent asked for vacant for-rent units in 2022: $2,385
Median gross rent in Tracy, CA in 2022: over $2,000
Housing units in Tracy with a mortgage: 14,156 (1,711 second mortgage, 146 home equity loan, 1,250 both second mortgage and home equity loan) Houses without a mortgage: 225
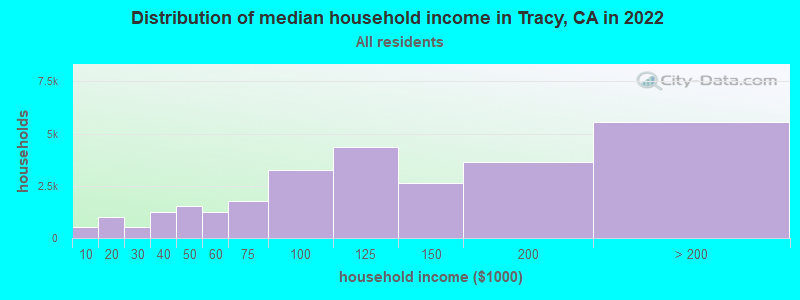
Median household income for houses/condos with a mortgage: $134,261
Median household income for apartments without a mortgage: $108,454
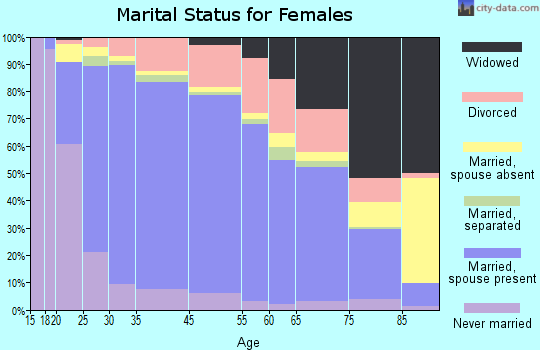
18,134 married couples with children.
4,003 single-parent households (868 men, 3,135 women).
55.2% of residents of Tracy speak English at home.
23.6% of residents speak Spanish at home (64% speak English very well, 17% speak English well, 15% speak English not well, 4% don't speak English at all).
10.5% of residents speak other Indo-European language at home (63% speak English very well, 26% speak English well, 9% speak English not well, 2% don't speak English at all).
8.1% of residents speak Asian or Pacific Island language at home (54% speak English very well, 22% speak English well, 22% speak English not well, 2% don't speak English at all).
1.9% of residents speak other language at home (37% speak English very well, 50% speak English well, 12% speak English not well, 1% don't speak English at all).
Foreign born population: 28,688 (29.5%)
(53.1% of them are naturalized citizens)
Percentage of workers working in this county: 54.3% Number of people working at home: 7,291 (16.5% of all workers)
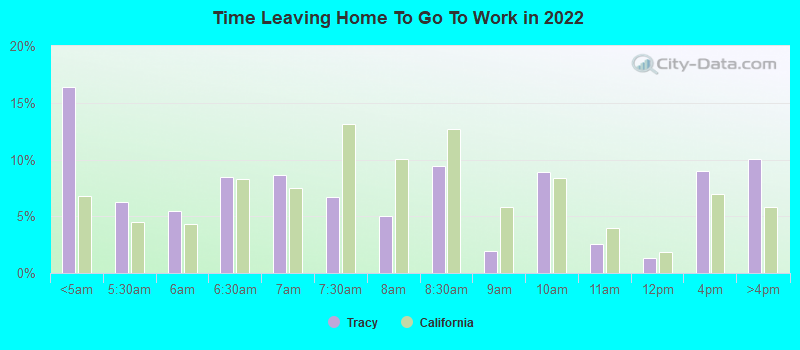
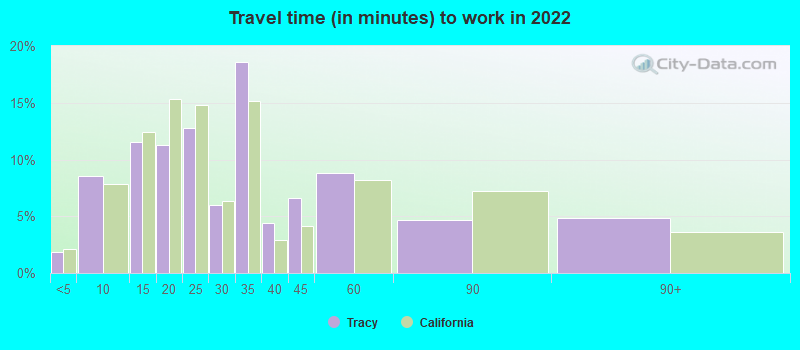
Travel time to work (commute)
Less than 5 minutes: 692
5 to 9 minutes: 3,154
10 to 14 minutes: 4,102
15 to 19 minutes: 2,456
20 to 24 minutes: 1,657
25 to 29 minutes: 1,470
30 to 34 minutes: 4,101
35 to 39 minutes: 661
40 to 44 minutes: 598
45 to 59 minutes: 4,582
60 to 89 minutes: 7,595
90 or more minutes: 5,791
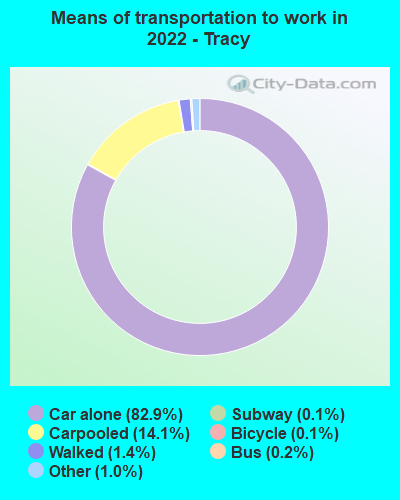
Means of transportation to work:
Drove a car alone: 29,266 (67.6%)
Carpooled: 6,543 (15.1%)
Bus: 50 (0.1%)
Long-distance train or commuter rail: 37 (0.1%)
Taxi: 468 (1.1%)
Bicycle: 54 (0.1%)
Walked: 461 (1.1%)
Worked at home: 7,270 (16.8%)
Unemployment by race in 2022
Unemployment rate for White non-Hispanic residents
3.7%Males
8.8%Females
Unemployment rate for Black residents
4.3%Males
5.4%Females
Unemployment rate for American Indian and Alaska Native residents
2.5%Males
Unemployment rate for Asian residents
2.9%Males
11.7%Females
Unemployment rate for other race residents
4.4%Males
4.5%Females
Unemployment rate for two or more race residents
4.2%Males
3.2%Females
Unemployment rate for Hispanic or Latino residents
7.1%Males
4.9%Females
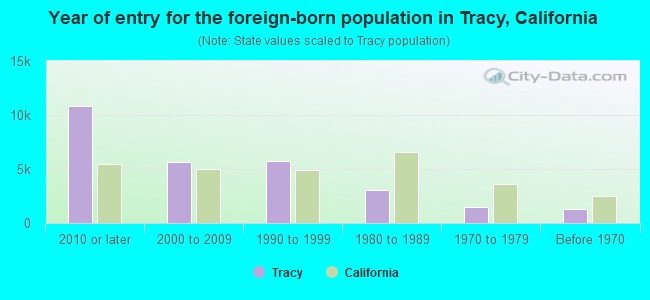
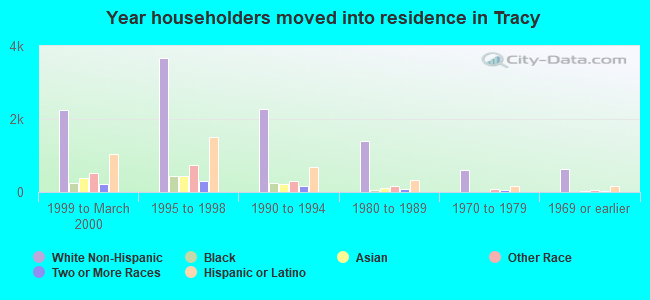
Year of entry for the foreign-born population in Tracy, California
10,8712010 or later
5,6062000 to 2009
5,7571990 to 1999
3,0191980 to 1989
1,5271970 to 1979
1,335Before 1970
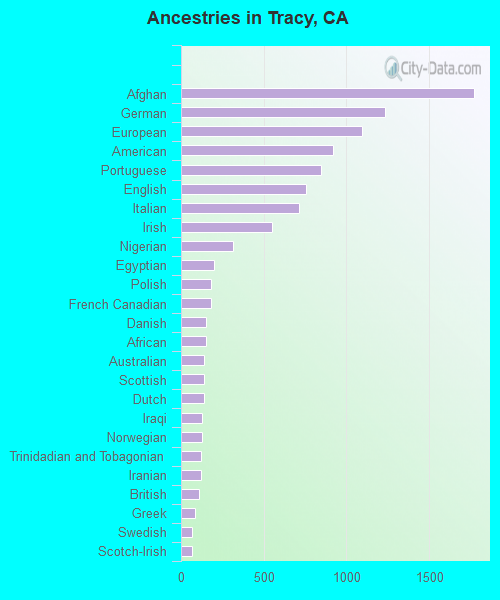
First ancestries reported:
Afghan: 1,773 (3.5%)
German: 1,236 (2.4%)
European: 1,097 (2.1%)
American: 917 (1.8%)
Portuguese: 849 (1.7%)
English: 754 (1.5%)
Italian: 715 (1.4%)
Irish: 550 (1.1%)
Nigerian: 312 (0.6%)
Egyptian: 199 (0.4%)
Polish: 183 (0.4%)
French Canadian: 182 (0.4%)
Danish: 153 (0.3%)
African: 149 (0.3%)
Australian: 140 (0.3%)
Scottish: 136 (0.3%)
Dutch: 136 (0.3%)
Iraqi: 128 (0.3%)
Norwegian: 124 (0.2%)
Trinidadian and Tobagonian: 123 (0.2%)
Iranian: 118 (0.2%)
British: 108 (0.2%)
Greek: 85 (0.2%)
Swedish: 69 (0.1%)
Scotch-Irish: 69 (0.1%)
French: 66 (0.1%)
Russian: 65 (0.1%)
Canadian: 59 (0.1%)
Sierra Leonean: 47 (0.09%)
Slovak: 43 (0.08%)
Austrian: 39 (0.08%)
Palestinian: 37 (0.07%)
Welsh: 36 (0.07%)
Hungarian: 34 (0.07%)
Eastern European: 31 (0.06%)
West Indian: 31 (0.06%)
Lebanese: 28 (0.05%)
Northern European: 27 (0.05%)
Scandinavian: 25 (0.05%)
Yugoslavian: 24 (0.05%)
Brazilian: 18 (0.04%)
Romanian: 18 (0.04%)
Ukrainian: 18 (0.04%)
Armenian: 17 (0.03%)
Ghanaian: 15 (0.03%)
Swiss: 14 (0.03%)
Slavic: 11 (0.02%)
Czechoslovakian: 7 (0.01%)
Basque: 4 (0.01%)
Most common places of birth for foreign-born residents (%):
Mexico
Tracy:
32.5% (8,473)
California:
37.2% (3,881,193)
India
Tracy:
20.8% (5,435)
California:
5.2% (539,184)
Philippines
Tracy:
11.6% (3,035)
California:
7.8% (818,297)
Afghanistan
Tracy:
6.4% (1,680)
California:
0.5% (53,260)
China, excluding Hong Kong and Taiwan
Tracy:
4.0% (1,033)
California:
6.6% (684,672)
Vietnam
Tracy:
2.7% (696)
California:
4.9% (512,335)
Pakistan
Tracy:
1.8% (470)
California:
0.5% (49,399)
El Salvador
Tracy:
1.8% (458)
California:
4.2% (440,287)
Place of birth for U.S.-born residents:
This state: 59,012
Other state: 7,003
Northeast: 1,357
Midwest: 2,527
South: 1,288
West: 1,831
87.7% of Tracy residents lived in the same house 1 years ago. Out of people who lived in different houses, 33.3% lived in this county. Out of people who lived in different counties, 95.8% lived in California.
Tracy:
87.7%
State average:
88.9%
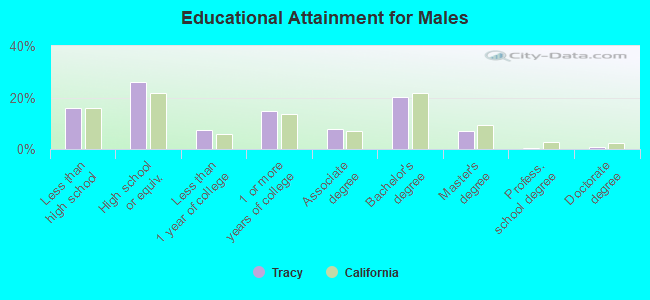
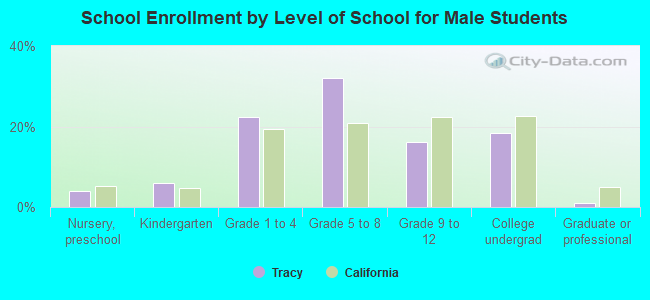
Education attainment for males 25 years and older:
No schooling: 1,257
Nursery to 4th grade: 414
5th and 6th grade: 743
7th and 8th grade: 546
9th grade: 171
10th grade: 227
11th grade: 187
12th grade, no diploma: 1,353
High school graduate (or equivalency): 7,984
Less than 1 year of college: 2,257
Some college more than 1 year, no degree: 4,578
Associate degree: 2,372
Bachelor's degree: 6,196
Master's degree: 2,143
Professional school degree: 133
Doctorate degree: 203
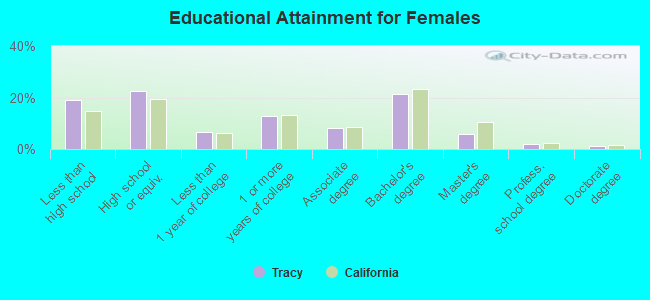
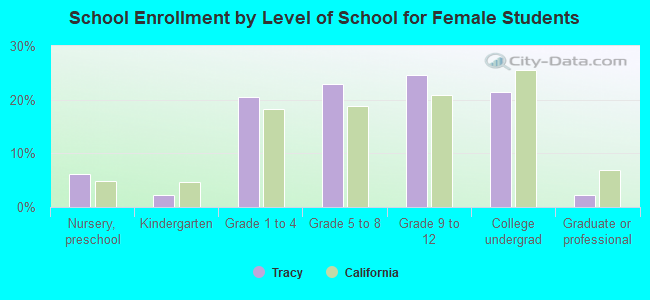
Education attainment for females 25 years and older:
No schooling: 1,838
Nursery to 4th grade: 333
5th and 6th grade: 792
7th and 8th grade: 837
9th grade: 152
10th grade: 381
11th grade: 216
12th grade, no diploma: 1,344
High school graduate (or equivalency): 6,919
Less than 1 year of college: 2,085
Some college more than 1 year, no degree: 3,992
Associate degree: 2,553
Bachelor's degree: 6,608
Master's degree: 1,783
Professional school degree: 578
Doctorate degree: 405
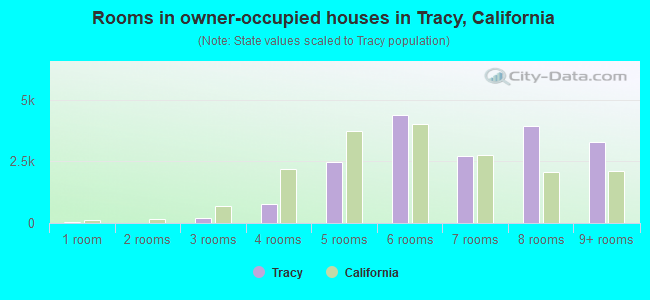
Housing units in structures:
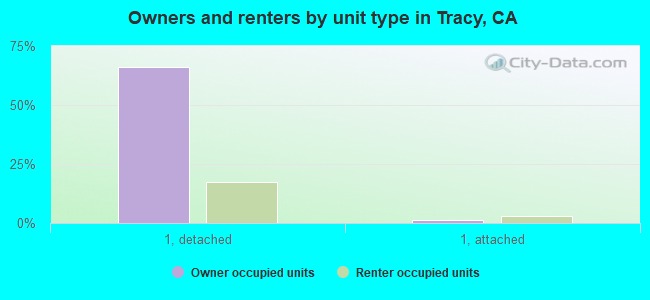
One, detached: 23,175
One, attached: 1,700
Two: 226
3 or 4: 1,166
5 to 9: 737
10 to 19: 190
20 to 49: 553
50 or more: 481
Mobile homes: 110
Housing units lacking complete plumbing facilities in 2022: 1.2%
Housing units lacking complete kitchen facilities in 2022: 0.4%
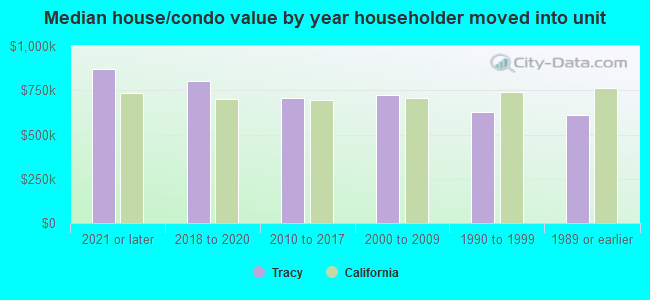
House/condo owner moved in on average 10 years ago