Trotwood, OH (Ohio) Houses and Residents
| Trotwood: | $105,028 |
| Ohio: | $204,100 |
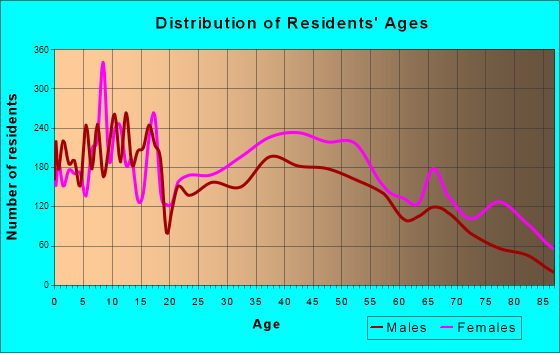
Total population: 24,171 (All urban)
Houses: 11,813 (10,262 occupied: 6,215 owner occupied, 4,353 renter occupied)
| % of renters here: | 41% |
| State: | 33% |
Housing density: 387 houses/condos per square mile
Median price asked for vacant for-sale houses and condos in 2022: $24,267.
Median contract rent in 2022: $739 (lower quartile is $573, upper quartile is $900)
Median rent asked for vacant for-rent units in 2022: $1,148
Median gross rent in Trotwood, OH in 2022: $912
Housing units in Trotwood with a mortgage: 3,580 (290 second mortgage, 0 home equity loan, 271 both second mortgage and home equity loan)
Houses without a mortgage: 253
Median household income for houses/condos with a mortgage: $73,364
Median household income for apartments without a mortgage: $42,466
Median monthly housing costs: $869
Compare current foreclosures near Trotwood, OH:
| Photo | Address | Area | Beds / Baths | Price | Details |
|---|---|---|---|---|---|

|
#1
Valley St
Dayton, OH 45404
|
1,080 sq. feet
|
2 baths 2 beds |
$127,900
|
show details |

|
#2
Shenandoah Trl
Dayton, OH 45449
|
1,140 sq. feet
|
1 baths 2 beds |
$87,500
|
show details |

|
#3
Sparks St
Dayton, OH 45426
|
1,100 sq. feet
|
1 baths 3 beds |
$159,900
|
show details |

|
#4
Miami Ave
Fairborn, OH 45324
|
720 sq. feet
|
1 baths 2 beds |
$8,500
|
show details |

|
#5
Huron Ave
Dayton, OH 45417
|
996 sq. feet
|
1 baths 2 beds |
$42,000
|
show details |

|
#6
Kingsford Dr
Dayton, OH 45426
|
1,740 sq. feet
|
2 baths 4 beds |
show details | |

|
#7
Cory Dr
Dayton, OH 45406
|
1,922 sq. feet
|
1 baths 3 beds |
show details | |

|
#8
E Market St
Germantown, OH 45327
|
1,248 sq. feet
|
1 baths 3 beds |
show details | |

|
#9
Troy Villa Blvd
Dayton, OH 45424
|
1,133 sq. feet
|
2 baths 3 beds |
show details | |

|
#10
Pepper Dr
Dayton, OH 45424
|
1,155 sq. feet
|
2 baths 4 beds |
show details |
| Photo | Address | Area | Beds / Baths | Price | Details |
|---|---|---|---|---|---|

|
#11
Evansville Ave
Dayton, OH 45406
|
1,856 sq. feet
|
2 baths 3 beds |
show details | |

|
#12
Whisper Creek Dr
Dayton, OH 45414
|
2,173 sq. feet
|
2 baths 3 beds |
show details | |

|
#13
Race Dr
Troy, OH 45373
|
1,372 sq. feet
|
1 baths 2 beds |
show details | |

|
#14
Parrot St
Dayton, OH 45410
|
- sq. feet
|
- baths - beds |
$9,750
|
show details |

|
#15
Falmouth Ave
Dayton, OH 45406
|
806 sq. feet
|
1 baths 3 beds |
show details | |

|
#16
Klose Ave
New Carlisle, OH 45344
|
999 sq. feet
|
1 baths 3 beds |
show details | |

|
#17
E Whipp Rd
Dayton, OH 45459
|
- sq. feet
|
2 baths 3 beds |
show details | |

|
#18
Blueberry Ave
Dayton, OH 45406
|
999 sq. feet
|
1 baths 3 beds |
show details | |

|
#19
Van Tress Dr
Fairborn, OH 45324
|
1,126 sq. feet
|
1 baths 3 beds |
show details | |

|
#20
E Bruce Ave
Dayton, OH 45405
|
1,470 sq. feet
|
2 baths 3 beds |
show details |
| Photo | Address | Area | Beds / Baths | Price | Details |
|---|---|---|---|---|---|

|
#21
Glenbrook Dr
Dayton, OH 45406
|
1,333 sq. feet
|
2 baths 3 beds |
show details | |

|
#22
S Plum St
Germantown, OH 45327
|
1,087 sq. feet
|
1 baths 2 beds |
show details | |

|
#23
Northwood Ave
Dayton, OH 45405
|
1,048 sq. feet
|
2 baths 3 beds |
show details | |

|
#24
S Garfield St
Dayton, OH 45403
|
1,536 sq. feet
|
1 baths 2 beds |
show details | |

|
#25
Newgate Ave
Dayton, OH 45420
|
1,050 sq. feet
|
1 baths 3 beds |
show details | |

|
#26
Franlou Ave
Dayton, OH 45432
|
1,155 sq. feet
|
1 baths 4 beds |
show details | |

|
#27
Lorimer St
Dayton, OH 45417
|
875 sq. feet
|
1 baths 3 beds |
show details | |

|
#28
Sunburst Dr
Fairborn, OH 45324
|
1,404 sq. feet
|
1 baths 3 beds |
show details | |

|
#29
Celtic Dr
Dayton, OH 45432
|
1,008 sq. feet
|
1 baths 2 beds |
show details | |

|
#30
S Tipp Cowlesville Rd
Tipp City, OH 45371
|
1,067 sq. feet
|
1 baths 2 beds |
show details |
| Photo | Address | Area | Beds / Baths | Price | Details |
|---|---|---|---|---|---|

|
#31
Malvern Ave
Dayton, OH 45406
|
1,676 sq. feet
|
1 baths 5 beds |
show details | |

|
#32
Frahn Ave
Fairborn, OH 45324
|
1,578 sq. feet
|
2 baths 3 beds |
show details | |

|
#33
S Lutheran Church Rd
New Lebanon, OH 45345
|
1,640 sq. feet
|
1 baths 2 beds |
show details | |

|
#34
W Floyd Ave
Dayton, OH 45415
|
2,487 sq. feet
|
2 baths 4 beds |
show details | |

|
#35
Kipling Dr
Dayton, OH 45406
|
1,027 sq. feet
|
1 baths 3 beds |
show details | |

|
#36
N Westedge Dr
Tipp City, OH 45371
|
960 sq. feet
|
1 baths 3 beds |
show details | |

|
#37
Carrilon Woods Dr
Dayton, OH 45458
|
3,668 sq. feet
|
3 baths 4 beds |
show details | |

|
#38
Westwood Ave
Dayton, OH 45417
|
1,495 sq. feet
|
1 baths 2 beds |
show details | |

|
#39
Spinning Rd
Dayton, OH 45431
|
1,332 sq. feet
|
1 baths 4 beds |
show details | |

|
#40
Villa Pointe Dr
Springboro, OH 45066
|
1,306 sq. feet
|
2 baths 2 beds |
show details |
| Photo | Address | Area | Beds / Baths | Price | Details |
|---|---|---|---|---|---|

|
#41
Woodland Hills Blvd
Dayton, OH 45414
|
999 sq. feet
|
1 baths 3 beds |
show details | |

|
#42
Quinn Rd
West Alexandria, OH 45381
|
1,512 sq. feet
|
1 baths 3 beds |
show details | |

|
#43
Xenia Ave
Dayton, OH 45410
|
1,796 sq. feet
|
1 baths 3 beds |
show details | |

|
#44
W 2nd St
Dayton, OH 45402
|
1,784 sq. feet
|
1 baths 3 beds |
show details | |

|
#45
Anderson St
Franklin, OH 45005
|
1,284 sq. feet
|
1 baths 2 beds |
show details | |

|
#46
E Lindsey Ave
Miamisburg, OH 45342
|
1,161 sq. feet
|
1 baths 3 beds |
show details | |

|
#47
Upper Miamisburg Rd
Miamisburg, OH 45342
|
1,945 sq. feet
|
2 baths 3 beds |
show details | |

|
#48
W Main St
Dayton, OH 45426
|
1,328 sq. feet
|
1 baths 3 beds |
show details | |

|
#49
Blackhawk Rd
Dayton, OH 45420
|
1,050 sq. feet
|
1 baths 3 beds |
show details | |

|
Check over 1 million property listings on Foreclosure.com!
|
browse all offers | |||

Latest news about housing in Trotwood, OH collected exclusively by city-data.com from local newspapers, TV, and radio stations


Median year apartment built: 1969
Household type by relationship:
Households: 23,028- Male householders: 3,894 (1,624 living alone), Female householders: 6,295 (2,473 living alone)
2,714 spouses (2,714 opposite-sex spouses), 722 unmarried partners, (722 opposite-sex unmarried partners), 6,230 children (5,952 natural, 63 adopted, 215 stepchildren), 875 grandchildren, 282 brothers or sisters, 337 parents, 48 foster children, 439 other relatives, 585 non-relatives
- In group quarters: 600
Size of family households: 2,727 2-persons, 1,611 3-persons, 755 4-persons, 318 5-persons, 205 6-persons, 61 7-or-more-persons.
Size of nonfamily households: 4,293 1-person, 534 2-persons, 11 3-persons, 4 4-persons, 20 5-persons, 4 7-or-more-persons.
1,796 married couples with children.
1,956 single-parent households (175 men, 1,781 women).
95.7% of residents of Trotwood speak English at home.
1.1% of residents speak Spanish at home (95% speak English very well, 5% speak English well).
1.9% of residents speak other Indo-European language at home (73% speak English very well, 9% speak English well, 7% speak English not well, 11% don't speak English at all).
0.1% of residents speak Asian or Pacific Island language at home (75% speak English very well, 25% speak English well).
1.2% of residents speak other language at home (62% speak English very well, 3% speak English well, 35% speak English not well).
Foreign born population: 739 (3.2%)
(68.9% of them are naturalized citizens)
| Here: | 6.2 |
| State: | 6.7 |
| Here: | 4.8 |
| State: | 4.4 |

- Bedrooms in owner-occupied houses and condos in Trotwood, Ohio
- 0no bedroom
- 1291 bedroom
- 8872 bedrooms
- 4,0883 bedrooms
- 8984 bedrooms
- 2145+ bedrooms

- Bedrooms in renter-occupied apartments in Trotwood, Ohio
- 115no bedroom
- 5991 bedroom
- 1,7942 bedrooms
- 1,4763 bedrooms
- 3124 bedrooms
- 585+ bedrooms

- Cars and other vehicles available in Trotwood in owner-occupied houses/condos
- 400no vehicle
- 2,7311 vehicle
- 1,6942 vehicles
- 8393 vehicles
- 3904 vehicles
- 1625+ vehicles

- Cars and other vehicles available in Trotwood in renter-occupied apartments
- 842no vehicle
- 2,1381 vehicle
- 9402 vehicles
- 2523 vehicles
- 754 vehicles
- 1065+ vehicles

- Rooms in owner-occupied houses in Trotwood, Ohio
- 01 room
- 02 rooms
- 783 rooms
- 7024 rooms
- 1,3325 rooms
- 1,5646 rooms
- 1,3557 rooms
- 6628 rooms
- 5229+ rooms

- Rooms in renter-occupied apartments in Trotwood, Ohio
- 1111 room
- 1472 rooms
- 5203 rooms
- 1,1614 rooms
- 1,1665 rooms
- 5906 rooms
- 4367 rooms
- 1308 rooms
- 949+ rooms


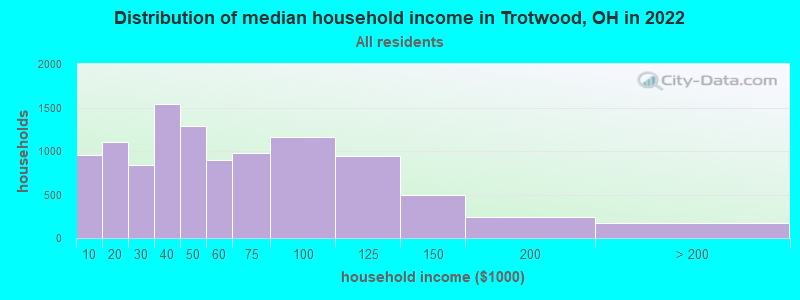
Trotwood, OH household income distribution

- 958Less than $10,000
- 1,104$10,000 to $19,999
- 837$20,000 to $29,999
- 1,538$30,000 to $39,999
- 1,285$40,000 to $49,999
- 899$50,000 to $59,999
- 981$60,000 to $74,999
- 1,156$75,000 to $99,999
- 947$100,000 to $124,999
- 491$125,000 to $149,999
- 236$150,000 to $199,999
- 175$200,000 or more
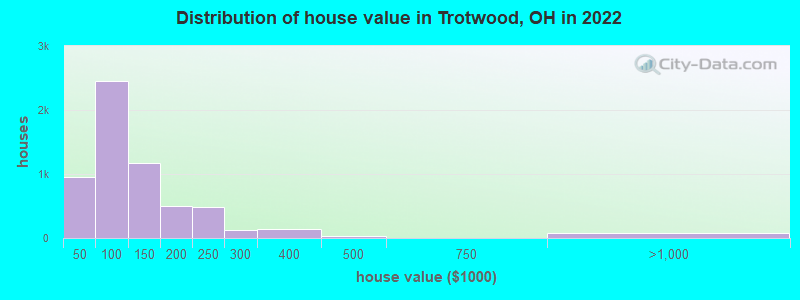
Home value of owner - occupied houses in 2022 in Trotwood, OH
-
- 119Less than $10,000
- 50$10,000 to $14,999
- 67$15,000 to $19,999
- 108$20,000 to $24,999
- 116$25,000 to $29,999
- 143$30,000 to $34,999
- 91$35,000 to $39,999
- 258$40,000 to $49,999
- 255$50,000 to $59,999
- 476$60,000 to $69,999
- 724$70,000 to $79,999
- 321$80,000 to $89,999
- 411$90,000 to $99,999
- 868$100,000 to $124,999
- 298$125,000 to $149,999
- 212$150,000 to $174,999
- 286$175,000 to $199,999
- 486$200,000 to $249,999
- 120$250,000 to $299,999
- 137$300,000 to $399,999
- 34$400,000 to $499,999
- 67$750,000 to $999,999
- 12$1,000,000 to $1,499,999
Rent paid by renters in 2022 in Trotwood, OH
-
- 64Less than $100
- 43$150 to $199
- 153$200 to $249
- 42$250 to $299
- 49$300 to $349
- 59$350 to $399
- 117$400 to $449
- 63$450 to $499
- 175$500 to $549
- 215$550 to $599
- 462$600 to $649
- 265$650 to $699
- 315$700 to $749
- 270$750 to $799
- 745$800 to $899
- 270$900 to $999
- 281$1,000 to $1,249
- 20$1,250 to $1,499
- 13$1,500 to $1,999
- 20$2,000 to $2,499
- 71$2,500 to $2,999
- 344No cash rent


Percentage of workers working in this county: 83.5%
Number of people working at home: 725 (7.4% of all workers)
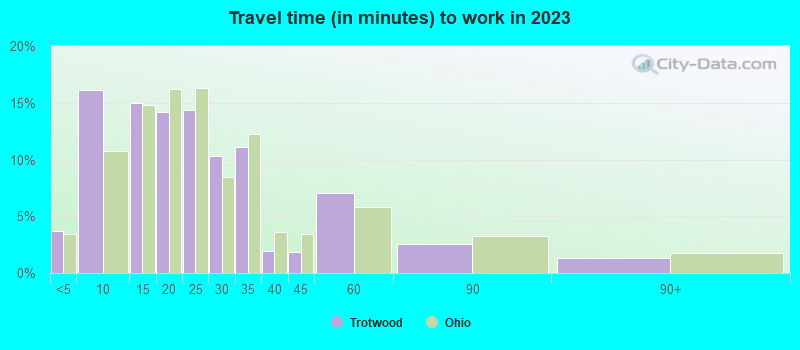
Travel time to work (commute)
- Less than 5 minutes: 107
- 5 to 9 minutes: 948
- 10 to 14 minutes: 777
- 15 to 19 minutes: 1,785
- 20 to 24 minutes: 1,678
- 25 to 29 minutes: 745
- 30 to 34 minutes: 1,433
- 35 to 39 minutes: 326
- 40 to 44 minutes: 248
- 45 to 59 minutes: 391
- 60 to 89 minutes: 223
- 90 or more minutes: 198
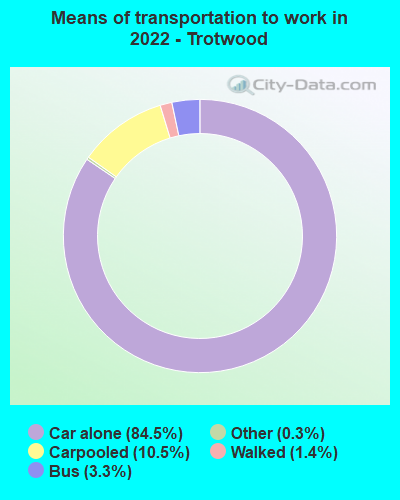
Means of transportation to work:
- Drove a car alone: 3,221 (72.1%)
- Carpooled: 417 (9.3%)
- Bus: 75 (1.7%)
- Taxi: 16 (0.4%)
- Walked: 47 (1.1%)
- Worked at home: 725 (16.2%)

- Unemployment by race in 2022
- Unemployment rate for White non-Hispanic residents
- 2.5%Males
- 2.1%Females
- Unemployment rate for Black residents
- 5.0%Males
- 12.1%Females
- Unemployment rate for two or more race residents
- 15.4%Males
- 20.1%Females

- Year of entry for the foreign-born population in Trotwood, Ohio
- 3972010 or later
- 1662000 to 2009
- 741990 to 1999
- 441980 to 1989
- 541970 to 1979
- 94Before 1970

First ancestries reported:
- German: 765 (5.0%)
- American: 517 (3.4%)
- African: 497 (3.3%)
- English: 475 (3.1%)
- Egyptian: 229 (1.5%)
- French: 158 (1.0%)
- Irish: 144 (0.9%)
- Czech: 114 (0.7%)
- Italian: 107 (0.7%)
- European: 65 (0.4%)
- Ethiopian: 38 (0.2%)
- Scottish: 31 (0.2%)
- Romanian: 30 (0.2%)
- Ukrainian: 23 (0.2%)
- Polish: 19 (0.1%)
- Scandinavian: 18 (0.1%)
- British: 17 (0.1%)
- Dutch: 16 (0.1%)
- Eastern European: 15 (0.10%)
- Swiss: 12 (0.08%)
- Turkish: 10 (0.07%)
- Liberian: 7 (0.05%)
- Swedish: 7 (0.05%)
- Jamaican: 7 (0.05%)
- Welsh: 2 (0.01%)
Most common places of birth for foreign-born residents (%):
| Trotwood: | 30.6% (238) |
| Ohio: | 0.5% (3,061) |
| Trotwood: | 24.3% (189) |
| Ohio: | 0.5% (2,773) |
| Trotwood: | 9.5% (74) |
| Ohio: | 0.3% (1,754) |
| Trotwood: | 3.3% (26) |
| Ohio: | 1.1% (6,346) |
| Trotwood: | 2.7% (21) |
| Ohio: | 0.2% (1,065) |
| Trotwood: | 2.4% (19) |
| Ohio: | 0.2% (1,151) |
| Trotwood: | 2.3% (18) |
| Ohio: | 1.4% (8,101) |
| Trotwood: | 2.1% (16) |
| Ohio: | 1.5% (8,380) |
| Trotwood: | 1.7% (13) |
| Ohio: | 0.8% (4,490) |
| Trotwood: | 1.5% (12) |
| Ohio: | 3.1% (17,818) |
Place of birth for U.S.-born residents:
- This state: 17,074
- Other state: 5,023
- Northeast: 507
- Midwest: 880
- South: 3,092
- West: 410
83.9% of Trotwood residents lived in the same house 1 years ago.
Out of people who lived in different houses, 42.3% lived in this county.
Out of people who lived in different counties, 64.0% lived in Ohio.
| Trotwood: | 83.9% |
| State average: | 87.8% |
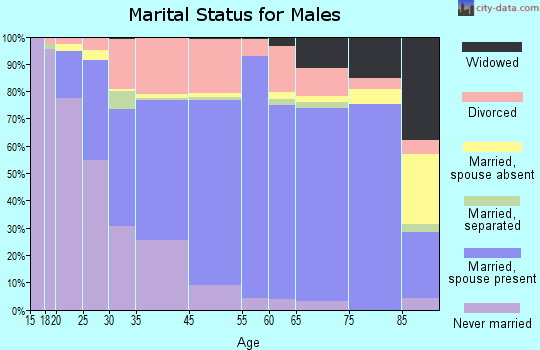
Education attainment for males 25 years and older:
- No schooling: 128
- Nursery to 4th grade: 49
- 5th and 6th grade: 4
- 7th and 8th grade: 21
- 9th grade: 52
- 10th grade: 203
- 11th grade: 159
- 12th grade, no diploma: 25
- High school graduate (or equivalency): 2,740
- Less than 1 year of college: 460
- Some college more than 1 year, no degree: 1,088
- Associate degree: 784
- Bachelor's degree: 774
- Master's degree: 493
- Professional school degree: 27
- Doctorate degree: 19

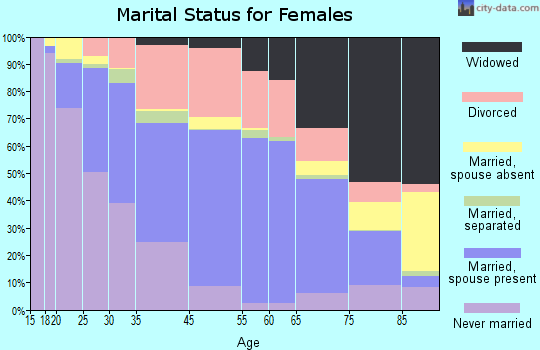
Education attainment for females 25 years and older:
- No schooling: 69
- Nursery to 4th grade: 0
- 5th and 6th grade: 36
- 7th and 8th grade: 118
- 9th grade: 50
- 10th grade: 83
- 11th grade: 203
- 12th grade, no diploma: 65
- High school graduate (or equivalency): 3,158
- Less than 1 year of college: 855
- Some college more than 1 year, no degree: 1,644
- Associate degree: 910
- Bachelor's degree: 994
- Master's degree: 852
- Professional school degree: 47
- Doctorate degree: 100

Housing units in structures:
- One, detached: 8,216
- One, attached: 599
- Two: 165
- 3 or 4: 498
- 5 to 9: 688
- 10 to 19: 805
- 20 to 49: 147
- 50 or more: 467
- Mobile homes: 224
Housing units lacking complete kitchen facilities in 2022: 4.0%
House/condo owner moved in on average 18 years ago
Renter moved in on average 4 years ago

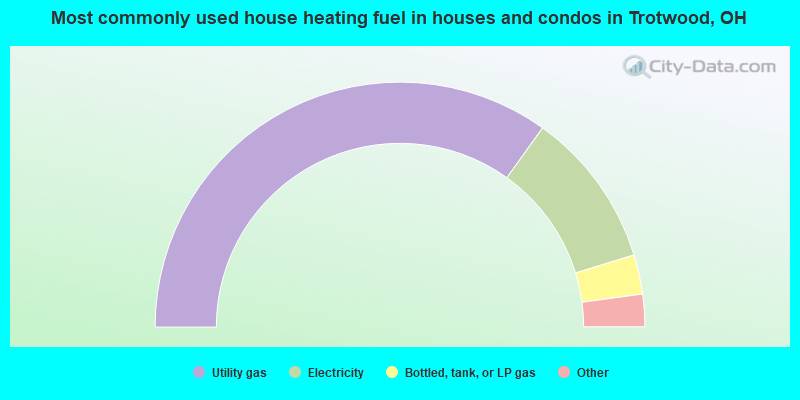
- 69.8%Utility gas
- 20.7%Electricity
- 5.2%Bottled, tank, or LP gas
- 3.3%Fuel oil, kerosene, etc.
- 1.0%Wood
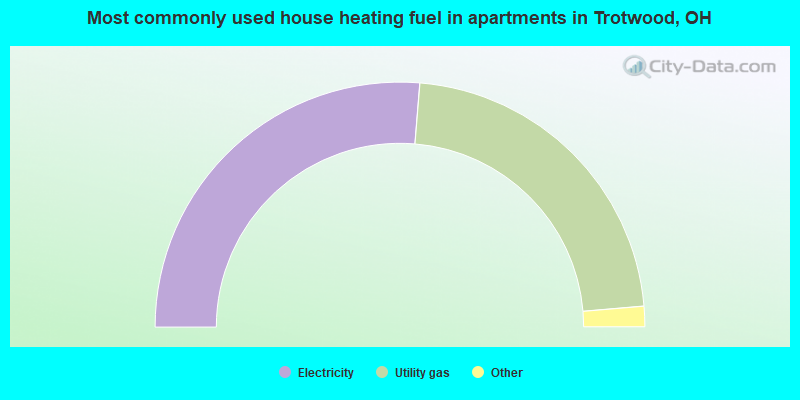
- 52.6%Electricity
- 44.7%Utility gas
- 1.7%Fuel oil, kerosene, etc.
- 0.7%Wood
- 0.3%Bottled, tank, or LP gas
Private vs. public school enrollment:
| Here: | 10.4% |
| Ohio: | 16.0% |
| Here: | 13.8% |
| Ohio: | 13.1% |
| Here: | 11.1% |
| Ohio: | 22.3% |


