Jump to a detailed profile or search site with Google Custom Search

Union City, CA (California) Houses and Residents

Estimated median house or condo value in 2022: $1,052,500 (it was $296,600 in 2000)
Union City:

$1,052,500
California:

$715,900
Lower value quartile - upper value quartile: $706,600 - $1,440,800

Mean price in 2022:

Detached houses: $1,291,679
Here:

$1,291,679
State:

$988,808

Townhouses or other attached units: $818,377
Here:

$818,377
State:

$838,546

In 2-unit structures: $789,057
Here:

$789,057
State:

$1,138,100

In 3-to-4-unit structures: $496,583
Here:

$496,583
State:

$824,253

In 5-or-more-unit structures: $481,289
Here:

$481,289
State:

$730,996

Mobile homes: $190,970
Here:

$190,970
State:

$184,506

Total population: 73,621 (Urban population: 66,650, Rural population: 211 (all nonfarm))

Houses: 22,160 (21,449 occupied: 14,289 owner occupied, 7,160 renter occupied)

% of renters here:

33%
State:

44%

Housing density: 1,151 houses/condos per square mile

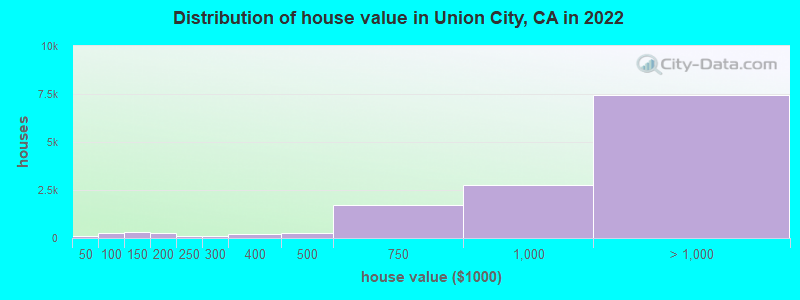
Median price asked for vacant for-sale houses and condos in 2022: $922,357.

Median contract rent in 2022: over $2,000 (lower quartile is $1,568, upper quartile is over $2,000)


Median rent asked for vacant for-rent units in 2022: $2,833


Median gross rent in Union City, CA in 2022: over $2,000

Housing units in Union City with a mortgage: 9,394 (1,173 second mortgage, 0 home equity loan, 1,076 both second mortgage and home equity loan)
Houses without a mortgage: 429

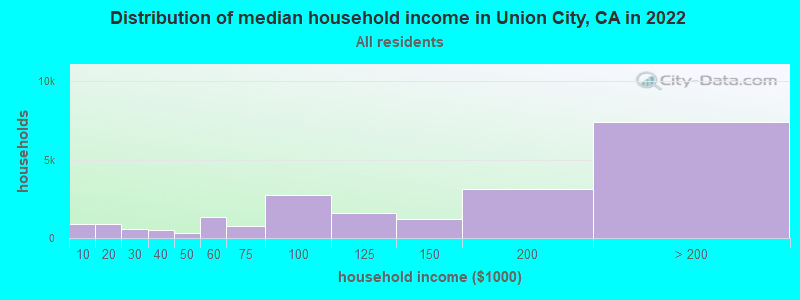
Median household income for houses/condos with a mortgage: $194,891

Median household income for apartments without a mortgage: $108,465

Median monthly housing costs: $2,412

Compare current foreclosures in Union City, CA:

Check out more offers in Union City, CA.
Powered by Foreclosure.com

Settings
X
Data:
Loading data...
Based on 2000-2020 data
Loading data...

123
Hide US histogram

Union City, California Age and Sex of Residents
Median year house/condo built: 1979

Median year apartment built: 1978

Household type by relationship:

Households: 67,049
  • Male householders: 12,021 (1,611 living alone), Female householders: 9,428 (1,848 living alone)
  • 13,522 spouses (13,231 opposite-sex spouses), 703 unmarried partners, (703 opposite-sex unmarried partners), 18,672 children (18,569 natural, 0 adopted, 103 stepchildren), 1,099 grandchildren, 989 brothers or sisters, 4,446 parents, 0 foster children, 2,280 other relatives, 2,545 non-relatives
  • In group quarters: 1,344

Size of family households: 5,810 2-persons, 4,354 3-persons, 4,331 4-persons, 1,287 5-persons, 946 6-persons, 611 7-or-more-persons.

Size of nonfamily households: 3,459 1-person, 481 2-persons, 67 3-persons, 103 4-persons.

8,489 married couples with children.
1,446 single-parent households (433 men, 1,013 women).

35.5% of residents of Union City speak English at home.
14.3% of residents speak Spanish at home (60% speak English very well, 25% speak English well, 12% speak English not well, 3% don't speak English at all).
14.7% of residents speak other Indo-European language at home (73% speak English very well, 19% speak English well, 8% speak English not well, 1% don't speak English at all).
34.7% of residents speak Asian or Pacific Island language at home (58% speak English very well, 26% speak English well, 11% speak English not well, 5% don't speak English at all).
1.2% of residents speak other language at home (62% speak English very well, 14% speak English well, 23% speak English not well).

Foreign born population: 31,077 (46.3%)
(70.4% of them are naturalized citizens)

Median number of rooms in houses and condos:
Here:

6.1
State:

6.0

Median number of rooms in apartments
Here:

4.1
State:

3.9

Owner-occupied Renter-occupied
Bedrooms in owner-occupied houses and condos in Union City, California
  • Bedrooms in owner-occupied houses and condos in Union City, California
  • 47no bedroom
  • 1181 bedroom
  • 2,3142 bedrooms
  • 5,0553 bedrooms
  • 5,3754 bedrooms
  • 1,3805+ bedrooms
Bedrooms in renter-occupied apartments in Union City, California
  • Bedrooms in renter-occupied apartments in Union City, California
  • 603no bedroom
  • 1,3551 bedroom
  • 2,8402 bedrooms
  • 1,6123 bedrooms
  • 7504 bedrooms
  • 05+ bedrooms
Owner-occupied Renter-occupied
Cars and other vehicles available in Union City in owner-occupied houses/condos
  • Cars and other vehicles available in Union City in owner-occupied houses/condos
  • 409no vehicle
  • 2,4941 vehicle
  • 6,0342 vehicles
  • 3,2583 vehicles
  • 1,2124 vehicles
  • 8825+ vehicles
Cars and other vehicles available in Union City in renter-occupied apartments
  • Cars and other vehicles available in Union City in renter-occupied apartments
  • 798no vehicle
  • 2,8441 vehicle
  • 1,7532 vehicles
  • 1,1403 vehicles
  • 4864 vehicles
  • 1395+ vehicles
Owner-occupied Renter-occupied
Rooms in owner-occupied houses in Union City, California
  • Rooms in owner-occupied houses in Union City, California
  • 471 room
  • 702 rooms
  • 7623 rooms
  • 1,3404 rooms
  • 2,8365 rooms
  • 3,2676 rooms
  • 2,7297 rooms
  • 2,1798 rooms
  • 1,0599+ rooms
Rooms in renter-occupied apartments in Union City, California
  • Rooms in renter-occupied apartments in Union City, California
  • 4001 room
  • 9272 rooms
  • 1,5363 rooms
  • 1,2644 rooms
  • 9275 rooms
  • 1,0876 rooms
  • 4437 rooms
  • 5768 rooms
  • 09+ rooms
Year house built
Median 2022 house/condo value by year built
Median house/condo value by year householder moved into unit
Breakdown of mean house values by ages of householders
Owners and renters by unit type in Union City, CA
  • Union City, CA household income distribution

  • Distribution of median household income in Union City, CA in 2022
  • 903Less than $10,000
  • 874$10,000 to $19,999
  • 592$20,000 to $29,999
  • 537$30,000 to $39,999
  • 335$40,000 to $49,999
  • 1,333$50,000 to $59,999
  • 763$60,000 to $74,999
  • 2,742$75,000 to $99,999
  • 1,584$100,000 to $124,999
  • 1,221$125,000 to $149,999
  • 3,157$150,000 to $199,999
  • 7,408$200,000 or more
  • Home value of owner - occupied houses in 2022 in Union City, CA

  • Distribution of house value in Union City, CA in 2022
  • 44Less than $10,000
  • 6$15,000 to $19,999
  • 14$20,000 to $24,999
  • 27$30,000 to $34,999
  • 7$40,000 to $49,999
  • 142$50,000 to $59,999
  • 24$60,000 to $69,999
  • 42$80,000 to $89,999
  • 27$90,000 to $99,999
  • 203$100,000 to $124,999
  • 128$125,000 to $149,999
  • 191$150,000 to $174,999
  • 75$175,000 to $199,999
  • 103$200,000 to $249,999
  • 99$250,000 to $299,999
  • 201$300,000 to $399,999
  • 264$400,000 to $499,999
  • 1,709$500,000 to $749,999
  • 2,758$750,000 to $999,999
  • 5,111$1,000,000 to $1,499,999
  • 1,932$1,500,000 to $1,999,999
  • 407$2,000,000 or more
  • Rent paid by renters in 2022 in Union City, CA

  • Distribution of rent paid by renters in Union City, CA in 2022
  • 20Less than $100
  • 7$100 to $149
  • 149$150 to $199
  • 75$200 to $249
  • 64$250 to $299
  • 4$300 to $349
  • 28$350 to $399
  • 54$400 to $449
  • 95$500 to $549
  • 63$550 to $599
  • 54$650 to $699
  • 35$700 to $749
  • 29$800 to $899
  • 103$900 to $999
  • 141$1,000 to $1,249
  • 158$1,250 to $1,499
  • 931$1,500 to $1,999
  • 1,636$2,000 to $2,499
  • 1,737$2,500 to $2,999
  • 779$3,000 to $3,499
  • 692$3,500 or more
  • 181No cash rent
Time Leaving Home To Go To Work in 2022

Percentage of workers working in this county: 69.1%
Number of people working at home: 7,355 (23.2% of all workers)

Travel time (in minutes) to work in 2022

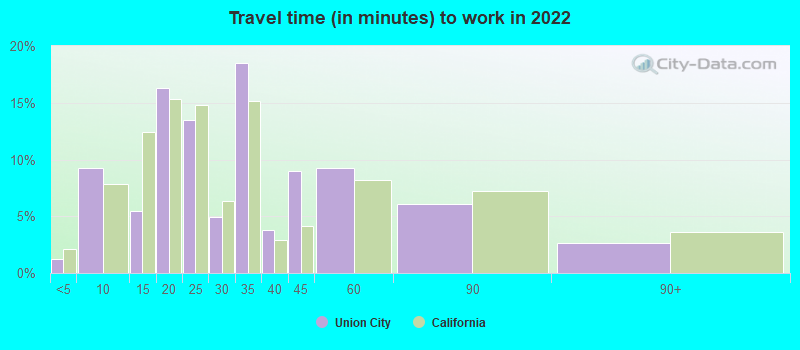
Travel time to work (commute)

  • Less than 5 minutes: 345
  • 5 to 9 minutes: 1,505
  • 10 to 14 minutes: 1,784
  • 15 to 19 minutes: 4,126
  • 20 to 24 minutes: 3,143
  • 25 to 29 minutes: 2,029
  • 30 to 34 minutes: 5,273
  • 35 to 39 minutes: 1,858
  • 40 to 44 minutes: 2,611
  • 45 to 59 minutes: 3,565
  • 60 to 89 minutes: 2,264
  • 90 or more minutes: 1,194
Means of transportation to work in 2022 - Union City

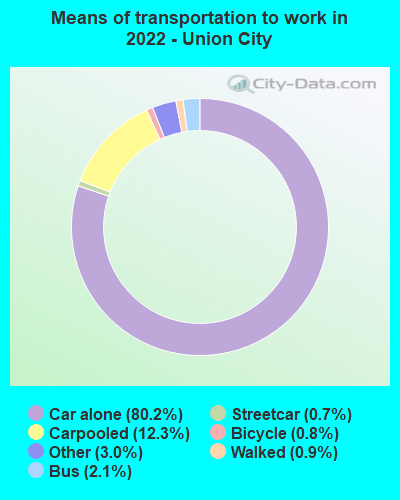
Means of transportation to work:

  • Drove a car alone: 13,306 (56.3%)
  • Carpooled: 2,130 (9.0%)
  • Bus: 290 (1.2%)
  • Subway or elevated rail: 97 (0.4%)
  • Long-distance train or commuter rail: 8 (0.0%)
  • Taxi: 518 (2.2%)
  • Bicycle: 141 (0.6%)
  • Walked: 154 (0.7%)
  • Worked at home: 7,355 (31.1%)
Class of Workers in 2022
  • Unemployment by race in 2022
  • Unemployment rate for White non-Hispanic residents
  • 8.2%Females
  • Unemployment rate for Black residents
  • 2.8%Males
  • 10.7%Females
  • Unemployment rate for American Indian and Alaska Native residents
  • 8.1%Males
  • 9.0%Females
  • Unemployment rate for Asian residents
  • 3.4%Males
  • 4.8%Females
  • Unemployment rate for other race residents
  • 4.7%Males
  • 2.7%Females
  • Unemployment rate for two or more race residents
  • 6.4%Males
  • 6.4%Females
  • Unemployment rate for Hispanic or Latino residents
  • 15.3%Males
Year of entry for the foreign-born population in Union City, California
  • Year of entry for the foreign-born population in Union City, California
  • 7,7112010 or later
  • 7,0332000 to 2009
  • 7,6011990 to 1999
  • 10,7051980 to 1989
  • 5,0921970 to 1979
  • 2,812Before 1970
Ancestries in Union City, CA

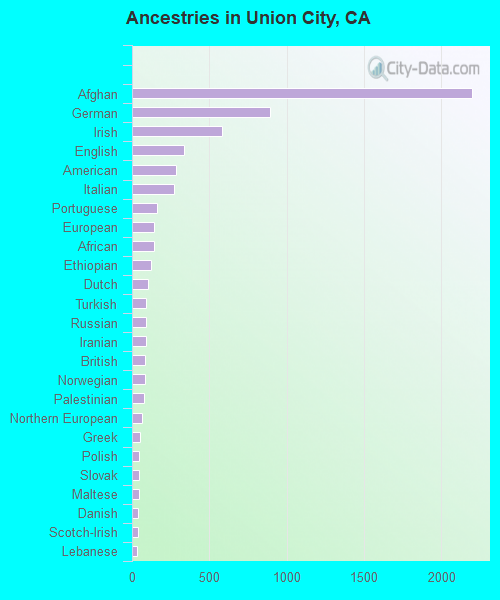
First ancestries reported:

  • Afghan: 2,200 (4.7%)
  • German: 890 (1.9%)
  • Irish: 584 (1.2%)
  • English: 337 (0.7%)
  • American: 282 (0.6%)
  • Italian: 272 (0.6%)
  • Portuguese: 165 (0.3%)
  • European: 144 (0.3%)
  • African: 144 (0.3%)
  • Ethiopian: 126 (0.3%)
  • Dutch: 103 (0.2%)
  • Turkish: 92 (0.2%)
  • Russian: 89 (0.2%)
  • Iranian: 88 (0.2%)
  • British: 86 (0.2%)
  • Norwegian: 86 (0.2%)
  • Palestinian: 80 (0.2%)
  • Northern European: 63 (0.1%)
  • Greek: 49 (0.1%)
  • Polish: 48 (0.1%)
  • Slovak: 47 (0.10%)
  • Maltese: 43 (0.09%)
  • Danish: 40 (0.08%)
  • Scotch-Irish: 37 (0.08%)
  • Lebanese: 34 (0.07%)
  • Arab: 34 (0.07%)
  • Scottish: 33 (0.07%)
  • French: 31 (0.07%)
  • Swiss: 22 (0.05%)
  • Swedish: 20 (0.04%)
  • Ukrainian: 19 (0.04%)
  • Nigerian: 18 (0.04%)
  • Scandinavian: 13 (0.03%)
  • Ghanaian: 13 (0.03%)
  • Latvian: 12 (0.03%)
  • Slavic: 11 (0.02%)
  • Hungarian: 11 (0.02%)
  • Bulgarian: 11 (0.02%)
  • Brazilian: 8 (0.02%)
  • Cypriot: 8 (0.02%)
  • Finnish: 8 (0.02%)
  • Assyrian: 7 (0.01%)
  • French Canadian: 6 (0.01%)
  • Austrian: 5 (0.01%)
  • Jordanian: 4 (0.01%)
  • Canadian: 4 (0.01%)
  • Barbadian: 4 (0.01%)
  • Slovene: 3 (0.01%)

Most common places of birth for foreign-born residents (%):

Philippines
Union City:

24.5% (8,126)
California:

7.8% (818,297)

India
Union City:

21.7% (7,200)
California:

5.2% (539,184)

China, excluding Hong Kong and Taiwan
Union City:

13.2% (4,378)
California:

6.6% (684,672)

Mexico
Union City:

10.7% (3,549)
California:

37.2% (3,881,193)

Afghanistan
Union City:

4.7% (1,573)
California:

0.5% (53,260)

Vietnam
Union City:

3.6% (1,201)
California:

4.9% (512,335)

Hong Kong
Union City:

3.2% (1,056)
California:

1.0% (105,215)

Korea
Union City:

2.2% (746)
California:

3.0% (315,248)

Taiwan
Union City:

2.1% (706)
California:

1.7% (176,274)

Indonesia
Union City:

1.5% (500)
California:

0.4% (39,097)

Place of birth for U.S.-born residents:

  • This state: 28,893
  • Other state: 6,182
  • Northeast: 1,232
  • Midwest: 1,590
  • South: 2,399
  • West: 961

89.9% of Union City residents lived in the same house 1 years ago.
   Out of people who lived in different houses, 39.4% lived in this county.
   Out of people who lived in different counties, 83.6% lived in California.


Union City:

89.9%
State average:

88.9%

Education attainment for males 25 years and older:

  • No schooling: 523
  • Nursery to 4th grade: 17
  • 5th and 6th grade: 334
  • 7th and 8th grade: 216
  • 9th grade: 107
  • 10th grade: 61
  • 11th grade: 68
  • 12th grade, no diploma: 474
  • High school graduate (or equivalency): 5,859
  • Less than 1 year of college: 1,967
  • Some college more than 1 year, no degree: 2,343
  • Associate degree: 1,332
  • Bachelor's degree: 7,534
  • Master's degree: 3,982
  • Professional school degree: 437
  • Doctorate degree: 891
Educational Attainment for Males

Education attainment for females 25 years and older:

  • No schooling: 1,305
  • Nursery to 4th grade: 89
  • 5th and 6th grade: 733
  • 7th and 8th grade: 175
  • 9th grade: 320
  • 10th grade: 82
  • 11th grade: 31
  • 12th grade, no diploma: 591
  • High school graduate (or equivalency): 3,734
  • Less than 1 year of college: 1,285
  • Some college more than 1 year, no degree: 2,702
  • Associate degree: 2,180
  • Bachelor's degree: 8,970
  • Master's degree: 3,253
  • Professional school degree: 188
  • Doctorate degree: 341
Educational Attainment for Females
Union City marital status for males
Union City marital status for females

Housing units in structures:

  • One, detached: 12,394
  • One, attached: 2,522
  • Two: 250
  • 3 or 4: 1,254
  • 5 to 9: 428
  • 10 to 19: 955
  • 20 to 49: 555
  • 50 or more: 2,522
  • Mobile homes: 1,280

Median worth of mobile homes: $165,800

Housing units lacking complete kitchen facilities in 2022: 1.8%

House/condo owner moved in on average 15 years ago

Renter moved in on average 4 years ago

Year householders moved into residence in Union City
Houses and condos Apartments
Most commonly used house heating fuel in houses and condos in Union City, CA
  • 77.7%Utility gas
  • 18.9%Electricity
  • 1.8%Bottled, tank, or LP gas
  • 1.0%No fuel used
  • 0.5%Solar energy
Most commonly used house heating fuel in apartments in Union City, CA
  • 61.9%Utility gas
  • 36.8%Electricity
  • 0.6%No fuel used
  • 0.5%Bottled, tank, or LP gas
  • 0.1%Fuel oil, kerosene, etc.

Private vs. public school enrollment:

Students in private schools in grades 1 to 8 (elementary and middle school): 498
Here:

11.4%
California:

10.5%

Students in private schools in grades 9 to 12 (high school): 696
Here:

27.9%
California:

8.5%

Students in private undergraduate colleges: 526
Here:

15.9%
California:

15.9%
School Enrollment by Level of School for Male Students
School Enrollment by Level of School for Female Students
Age and Sex of Sensory-Disabled Noninstitutionalized Residents
Age and Sex of Physically-Disabled Noninstitutionalized Residents
Age and Sex of Mentally-Disabled Noninstitutionalized Residents
Age and Sex of Self-Care Disabled Noninstitutionalized Residents
Age and Sex of Go-Outside-Home Disabled Noninstitutionalized Residents
Age and Sex of Noninstitutionalized Residents with Employment Disability