Union City, NJ (New Jersey) Houses and Residents
Estimated median house or condo value in 2022: $430,200 (it was $159,600 in 2000 )
Union City:
$430,200New Jersey:
$428,900
Lower value quartile - upper value quartile: $266,200 - $588,000Mean price in 2022: Detached houses: $343,888 Here:
$343,888State:
$537,591
Townhouses or other attached units: $468,033 Here:
$468,033State:
$381,113
In 2-unit structures: $443,095 Here:
$443,095State:
$444,476
In 3-to-4-unit structures: $432,401 Here:
$432,401State:
$457,463
In 5-or-more-unit structures: $321,357 Here:
$321,357State:
$368,745
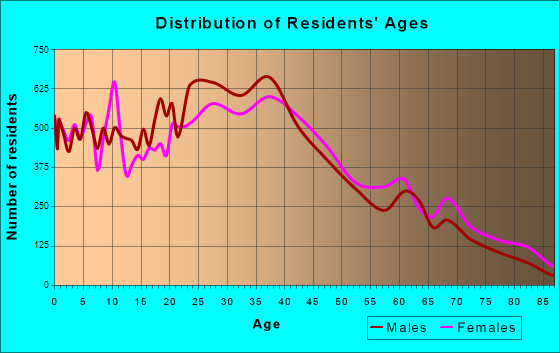
Total population: 68,668 (Urban population: 67,088, Rural population: 0)
Houses: 26,286 (25,162 occupied: 5,367 owner occupied, 19,795 renter occupied )
% of renters here:
79%State:
35%
Housing density: 20,757 houses/condos per square mile
Median price asked for vacant for-sale houses and condos in 2022: $380,506.
Median contract rent in 2022: $1,199 (lower quartile is $901, upper quartile is $1,611)
Median rent asked for vacant for-rent units in 2022: $1,027
Median gross rent in Union City, NJ in 2022: $1,356
Housing units in Union City with a mortgage: 3,291 (126 second mortgage, 0 home equity loan, 125 both second mortgage and home equity loan )Houses without a mortgage: 56
Median household income for houses/condos with a mortgage: $110,379
Median household income for apartments without a mortgage: $77,897
Median monthly housing costs: $1,412
Data:
Median house or condo value ($)
Median house or condo value ($ change since 2000)
Median house or condo value ($) - White
Median house or condo value ($) - Black or African American
Median house or condo value ($) - Asian
Median house or condo value ($) - Hispanic or Latino
Median house or condo value ($) - American Indian and Alaska Native
Median house or condo value ($) - Multirace
Median house or condo value ($) - Other Race
Median price asked for mobile homes ($)
Household density (households per square mile)
Mean house or condo value by units in structure - 1, detached ($)
Mean house or condo value by units in structure - 1, attached ($)
Mean house or condo value by units in structure - 2 ($)
Mean house or condo value by units in structure by units in structure - 3 or 4 ($)
Mean house or condo value by units in structure - 5 or more ($)
Mean house or condo value by units in structure - Boat, RV, van, etc. ($)
Mean house or condo value by units in structure - Mobile home ($)
Median contract rent ($)
Median contract rent - Lower quartile ($)
Median contract rent - Upper quartile ($)
Median gross rent ($)
Urban houses (%)
Rural houses (%)
Houses occupied (%)
Houses occupied (% change since 2000)
Houses owner occupied (%)
Houses owner occupied (% change since 2000)
Houses renter occupied (%)
Houses renter occupied (% change since 2000)
Vacant housing units - For rent (%)
Vacant housing units - For rent (% change since 2000)
Vacant housing units - For sale only (%)
Vacant housing units - For sale only (% change since 2000)
Vacant housing units - Rented or sold, not occupied (%)
Vacant housing units - Rented or sold, not occupied (% change since 2000)
Vacant housing units - For seasonal, recreational, or occasional use (%)
Vacant housing units - For seasonal, recreational, or occasional use (% change since 2000)
Vacant housing units - For migrant workers (%)
Vacant housing units - For migrant workers (% change since 2000)
Vacant housing units - Other vacant (%)
Vacant housing units - Other vacant (% change since 2000)
Median monthly housing costs ($)
Median household income for houses/condos with a mortgage ($)
Median household income for houses/condos without a mortgage ($)
Median household income ($)
Median household income ($) - White
Median household income ($) - Black or African American
Median household income ($) - Asian
Median household income ($) - Hispanic or Latino
Median household income ($) - American Indian and Alaska Native
Median household income ($) - Multirace
Median household income ($) - Other Race
Mortgage status - with mortgage (%)
Mortgage status - with second mortgage (%)
Mortgage status - with home equity loan (%)
Mortgage status - with both second mortgage and home equity loan (%)
Mortgage status - without a mortgage (%)
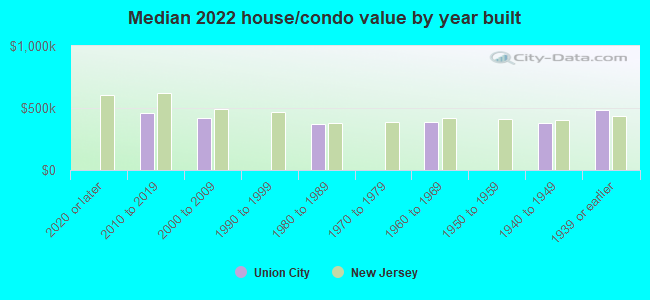
Median year house/condo built
Median year apartment built
Household type by relationship - Male householder living alone (%)
Household type by relationship - Male householder not living alone (%)
Household type by relationship - Female householder living alone (%)
Household type by relationship - Female householder not living alone (%)
Household type by relationship - Opposite-Sex spouse (%)
Household type by relationship - Same-Sex spouse (%)
Household type by relationship - Opposite-Sex unmarried partner (%)
Household type by relationship - Same-Sex unmarried partner (%)
Household type by relationship - In group quarters (%)
Size of family households - 2-person household (%)
Size of family households - 3-person household (%)
Size of family households - 4-person household (%)
Size of family households - 5-person household (%)
Size of family households - 6-person household (%)
Size of family households - 7-or-more-person household (%)
Size of nonfamily households - 1-person household (%)
Size of nonfamily households - 2-person household (%)
Size of nonfamily households - 3-person household (%)
Size of nonfamily households - 4-person household (%)
Size of nonfamily households - 5-person household (%)
Size of nonfamily households - 6-person household (%)
Size of nonfamily households - 7-or-moreperson household (%)
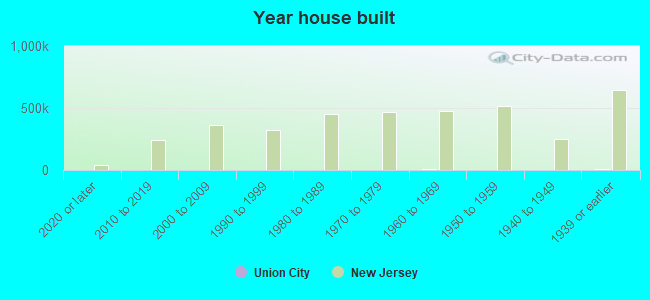
Year house built - Built 2010 or later (%)
Year house built - Built 2000 to 2009 (%)
Year house built - Built 1990 to 1999 (%)
Year house built - Built 1980 to 1989 (%)
Year house built - Built 1970 to 1979 (%)
Year house built - Built 1960 to 1969 (%)
Year house built - Built 1950 to 1959 (%)
Year house built - Built 1940 to 1949 (%)
Year house built - Built 1939 or earlier (%)
Median number of rooms in houses and condos
Median number of rooms in apartments
Median number of bedrooms in owner occupied houses
Mean number of bedrooms in owner occupied houses
Median number of bedrooms in renter occupied houses
Mean number of bedrooms in renter occupied houses
Median number of vehichles in owner occupied houses
Mean number of vehichles in owner occupied houses
Median number of vehichles in renter occupied houses
Mean number of vehichles in renter occupied houses
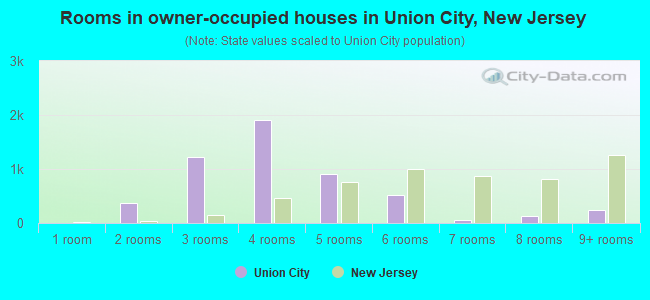
Rooms in owner-occupied houses - 1 room (%)
Rooms in owner-occupied houses - 2 rooms (%)
Rooms in owner-occupied houses - 3 rooms (%)
Rooms in owner-occupied houses - 4 rooms (%)
Rooms in owner-occupied houses - 5 rooms (%)
Rooms in owner-occupied houses - 6 rooms (%)
Rooms in owner-occupied houses - 7 rooms (%)
Rooms in owner-occupied houses - 8 rooms (%)
Rooms in owner-occupied houses - 9+ rooms (%)
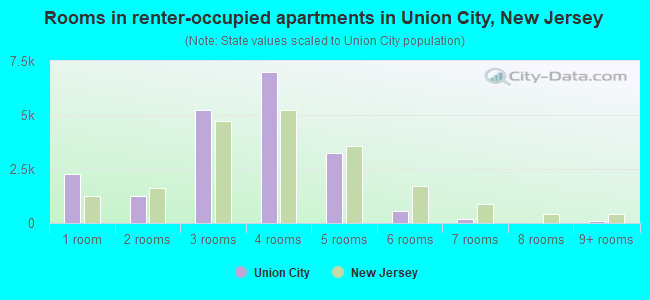
Rooms in renter-occupied houses - 1 room (%)
Rooms in renter-occupied houses - 2 rooms (%)
Rooms in renter-occupied houses - 3 rooms (%)
Rooms in renter-occupied houses - 4 rooms (%)
Rooms in renter-occupied houses - 5 rooms (%)
Rooms in renter-occupied houses - 6 rooms (%)
Rooms in renter-occupied houses - 7 rooms (%)
Rooms in renter-occupied houses - 8 rooms (%)
Rooms in renter-occupied houses - 9+ rooms (%)
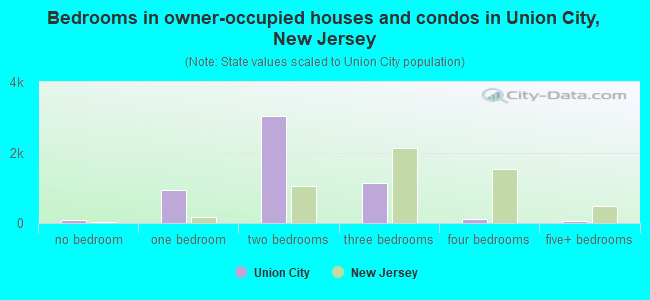
Bedrooms in owner-occupied houses - no bedrooms (%)
Bedrooms in owner-occupied houses - 1 bedroom (%)
Bedrooms in owner-occupied houses - 2 bedrooms (%)
Bedrooms in owner-occupied houses - 3 bedrooms (%)
Bedrooms in owner-occupied houses - 4 bedrooms (%)
Bedrooms in owner-occupied houses - 5+ bedrooms (%)
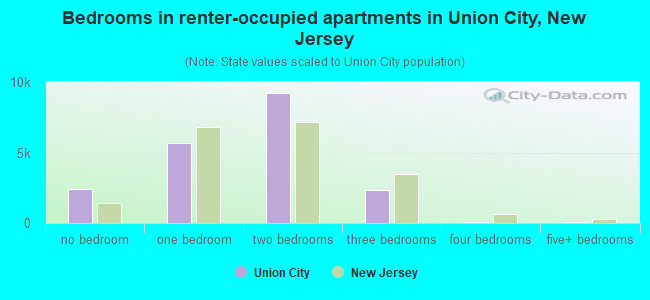
Bedrooms in renter-occupied houses - no bedrooms (%)
Bedrooms in renter-occupied houses - 1 bedroom (%)
Bedrooms in renter-occupied houses - 2 bedrooms (%)
Bedrooms in renter-occupied houses - 3 bedrooms (%)
Bedrooms in renter-occupied houses - 4 bedrooms (%)
Bedrooms in renter-occupied houses - 5+ bedrooms (%)
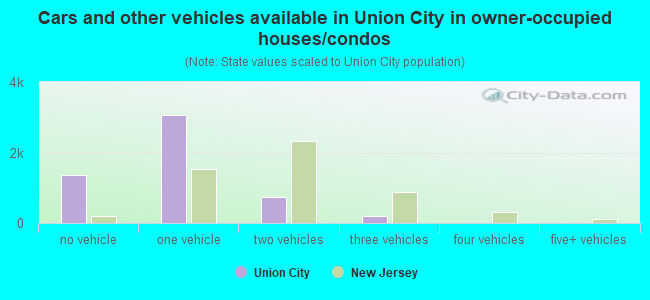
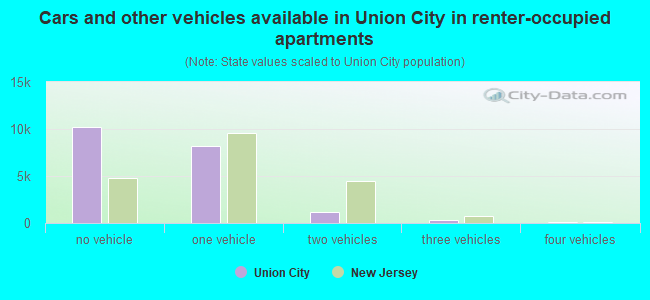
Vehicles available in owner-occupied houses - no vehicle available (%)
Vehicles available in owner-occupied houses - 1 vehicle available(%)
Vehicles available in owner-occupied houses - 2 Vehicles available (%)
Vehicles available in owner-occupied houses - 3 Vehicles available (%)
Vehicles available in owner-occupied houses - 4 Vehicles available (%)
Vehicles available in owner-occupied houses - 5+ Vehicles available (%)
Vehicles available in renter-occupied houses - no vehicle available (%)
Vehicles available in renter-occupied houses - 1 vehicle available (%)
Vehicles available in renter-occupied houses - 2 Vehicles available (%)
Vehicles available in renter-occupied houses - 3 Vehicles available (%)
Vehicles available in renter-occupied houses - 4 Vehicles available (%)
Vehicles available in renter-occupied houses - 5+ Vehicles available (%)
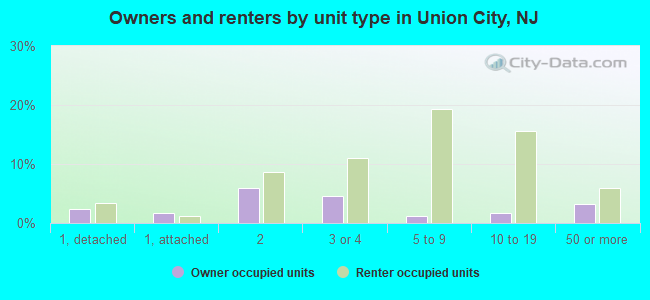
Housing units in structures - 1, detached (%)
Housing units in structures - 1, attached (%)
Housing units in structures - 2 (%)
Housing units in structures - 3 or 4 (%)
Housing units in structures - 5 to 9 (%)
Housing units in structures - 10 to 19 (%)
Housing units in structures - 20 to 49 (%)
Housing units in structures - 50 or more (%)
Housing units in structures - Mobile home (%)
Housing units in structures - Boat, RV, van, etc. (%)
Housing units in structures - Owners - 1, detached (%)
Housing units in structures - Owners - 1, attached (%)
Housing units in structures - Owners - 2 (%)
Housing units in structures - Owners - 3 or 4 (%)
Housing units in structures - Owners - 5 to 9 (%)
Housing units in structures - Owners - 10 to 19 (%)
Housing units in structures - Owners - 20 to 49 (%)
Housing units in structures - Owners - 50 or more (%)
Housing units in structures - Owners - Mobile home (%)
Housing units in structures - Owners - Boat, RV, van, etc. (%)
Housing units in structures - Renters - 1, detached (%)
Housing units in structures - Renters - 1, attached (%)
Housing units in structures - Renters - 2 (%)
Housing units in structures - Renters - 3 or 4 (%)
Housing units in structures - Renters - 5 to 9 (%)
Housing units in structures - Renters - 10 to 19 (%)
Housing units in structures - Renters - 20 to 49 (%)
Housing units in structures - Renters - 50 or more (%)
Housing units in structures - Renters - Mobile home (%)
Housing units in structures - Renters - Boat, RV, van, etc. (%)
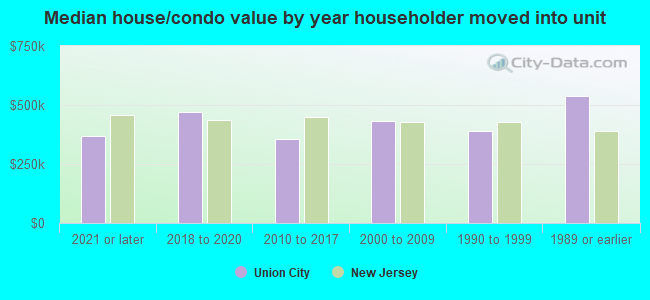
House/condo owner moved in on average (years ago)
Renter moved in on average (years ago)
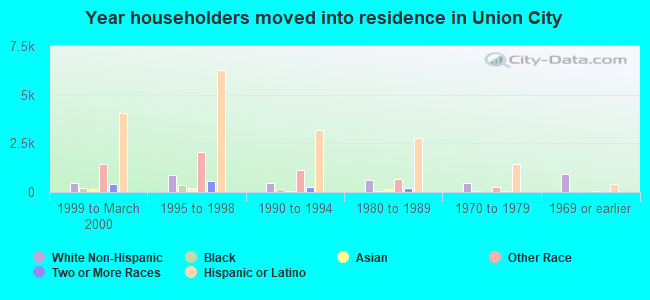
Year householder moved into unit - Moved in 1999 to March 2000 (%)
Year householder moved into unit - Moved in 1999 to March 2000 (%) - White
Year householder moved into unit - Moved in 1999 to March 2000 (%) - Black or African American
Year householder moved into unit - Moved in 1999 to March 2000 (%) - Asian
Year householder moved into unit - Moved in 1999 to March 2000 (%) - Hispanic or Latino
Year householder moved into unit - Moved in 1999 to March 2000 (%) - American Indian and Alaska Native
Year householder moved into unit - Moved in 1999 to March 2000 (%) - Multirace
Year householder moved into unit - Moved in 1999 to March 2000 (%) - Other Race
Year householder moved into unit - Moved in 1995 to 1998 (%)
Year householder moved into unit - Moved in 1995 to 1998 (%) - White
Year householder moved into unit - Moved in 1995 to 1998 (%) - Black or African American
Year householder moved into unit - Moved in 1995 to 1998 (%) - Asian
Year householder moved into unit - Moved in 1995 to 1998 (%) - Hispanic or Latino
Year householder moved into unit - Moved in 1995 to 1998 (%) - American Indian and Alaska Native
Year householder moved into unit - Moved in 1995 to 1998 (%) - Multirace
Year householder moved into unit - Moved in 1995 to 1998 (%) - Other Race
Year householder moved into unit - Moved in 1990 to 1994 (%)
Year householder moved into unit - Moved in 1990 to 1994 (%) - White
Year householder moved into unit - Moved in 1990 to 1994 (%) - Black or African American
Year householder moved into unit - Moved in 1990 to 1994 (%) - Asian
Year householder moved into unit - Moved in 1990 to 1994 (%) - Hispanic or Latino
Year householder moved into unit - Moved in 1990 to 1994 (%) - American Indian and Alaska Native
Year householder moved into unit - Moved in 1990 to 1994 (%) - Multirace
Year householder moved into unit - Moved in 1990 to 1994 (%) - Other Race
Year householder moved into unit - Moved in 1980 to 1989 (%)
Year householder moved into unit - Moved in 1980 to 1989 (%) - White
Year householder moved into unit - Moved in 1980 to 1989 (%) - Black or African American
Year householder moved into unit - Moved in 1980 to 1989 (%) - Asian
Year householder moved into unit - Moved in 1980 to 1989 (%) - Hispanic or Latino
Year householder moved into unit - Moved in 1980 to 1989 (%) - American Indian and Alaska Native
Year householder moved into unit - Moved in 1980 to 1989 (%) - Multirace
Year householder moved into unit - Moved in 1980 to 1989 (%) - Other Race
Year householder moved into unit - Moved in 1970 to 1979 (%)
Year householder moved into unit - Moved in 1970 to 1979 (%) - White
Year householder moved into unit - Moved in 1970 to 1979 (%) - Black or African American
Year householder moved into unit - Moved in 1970 to 1979 (%) - Asian
Year householder moved into unit - Moved in 1970 to 1979 (%) - Hispanic or Latino
Year householder moved into unit - Moved in 1970 to 1979 (%) - American Indian and Alaska Native
Year householder moved into unit - Moved in 1970 to 1979 (%) - Multirace
Year householder moved into unit - Moved in 1970 to 1979 (%) - Other Race
Year householder moved into unit - Moved in 1969 or earlier (%)
Year householder moved into unit - Moved in 1969 or earlier (%) - White
Year householder moved into unit - Moved in 1969 or earlier (%) - Black or African American
Year householder moved into unit - Moved in 1969 or earlier (%) - Asian
Year householder moved into unit - Moved in 1969 or earlier (%) - Hispanic or Latino
Year householder moved into unit - Moved in 1969 or earlier (%) - American Indian and Alaska Native
Year householder moved into unit - Moved in 1969 or earlier (%) - Multirace
Year householder moved into unit - Moved in 1969 or earlier (%) - Other Race
Housing units lacking complete plumbing facilities (%)
Housing units lacking complete kitchen facilities (%)
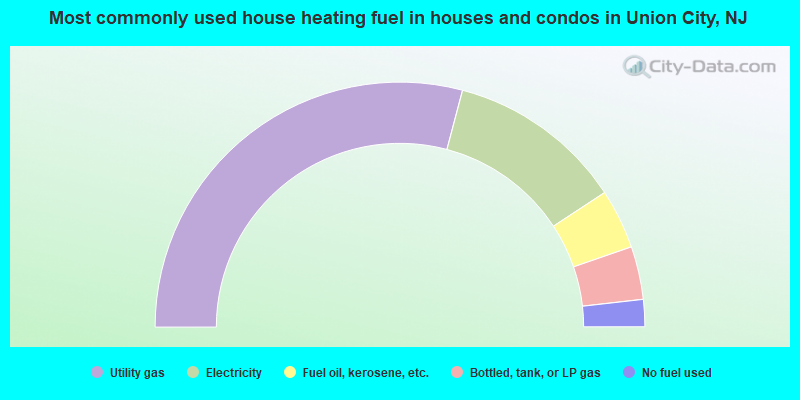
House heating fuel used in houses and condos - Utility gas (%)
House heating fuel used in houses and condos - Bottled, tank, or LP gas (%)
House heating fuel used in houses and condos - Electricity (%)
House heating fuel used in houses and condos - Fuel oil, kerosene, etc. (%)
House heating fuel used in houses and condos - Coal or coke (%)
House heating fuel used in houses and condos - Wood (%)
House heating fuel used in houses and condos - Solar energy (%)
House heating fuel used in houses and condos - Other fuel (%)
House heating fuel used in houses and condos - No fuel used (%)
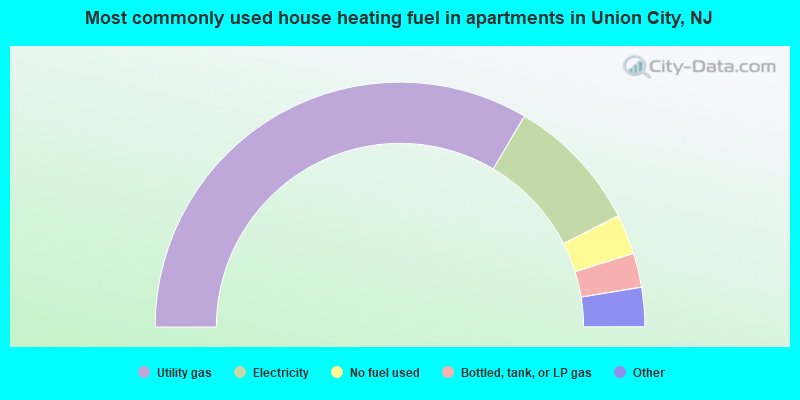
House heating fuel used in apartments - Utility gas (%)
House heating fuel used in apartments - Bottled, tank, or LP gas (%)
House heating fuel used in apartments - Electricity (%)
House heating fuel used in apartments - Fuel oil, kerosene, etc. (%)
House heating fuel used in apartments - Coal or coke (%)
House heating fuel used in apartments - Wood (%)
House heating fuel used in apartments - Solar energy (%)
House heating fuel used in apartments - Other fuel (%)
House heating fuel used in apartments - No fuel used (%)
Median year house/condo built: 1946Median year apartment built: 1963Household type by relationship:
Households: 65,365
Male householders: 10,417 (2,629 living alone ), Female householders: 14,745 (3,952 living alone )8,043 spouses (7,877 opposite-sex spouses ), 3,470 unmarried partners , (3,355 opposite-sex unmarried partners ), 18,826 children (18,302 natural , 0 adopted , 524 stepchildren ), 2,479 grandchildren , 1,483 brothers or sisters , 1,110 parents , 0 foster children , 1,663 other relatives , 2,749 non-relatives In group quarters: 380
Size of family households: 6,974 2-persons , 3,987 3-persons , 2,427 4-persons , 2,264 5-persons , 846 6-persons , 467 7-or-more-persons .
Size of nonfamily households: 6,581 1-person , 1,151 2-persons , 465 3-persons .
6,113 married couples with children. single-parent households (841 men , 5,293 women ).
19.8% of residents of Union City speak English at home. of residents speak Spanish at home (44% speak English very well , 19% speak English well , 23% speak English not well , 13% don't speak English at all ).of residents speak other Indo-European language at home (80% speak English very well , 12% speak English well , 7% speak English not well , 1% don't speak English at all ).of residents speak Asian or Pacific Island language at home (66% speak English very well , 26% speak English well , 7% speak English not well ).of residents speak other language at home (81% speak English very well , 17% speak English well , 2% speak English not well ).
Foreign born population: 37,700 (57.7%)of them are naturalized citizens )
Median number of rooms in houses and condos:
Median number of rooms in apartments
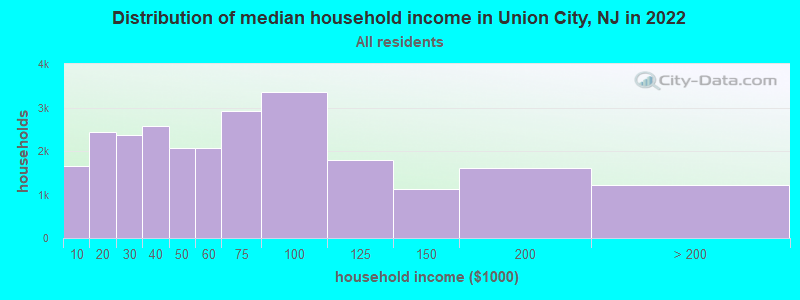
Union City, NJ household income distribution 1,648 Less than $10,0002,441 $10,000 to $19,9992,357 $20,000 to $29,9992,571 $30,000 to $39,9992,066 $40,000 to $49,9992,080 $50,000 to $59,9992,920 $60,000 to $74,9993,355 $75,000 to $99,9991,792 $100,000 to $124,9991,117 $125,000 to $149,9991,603 $150,000 to $199,9991,212 $200,000 or more
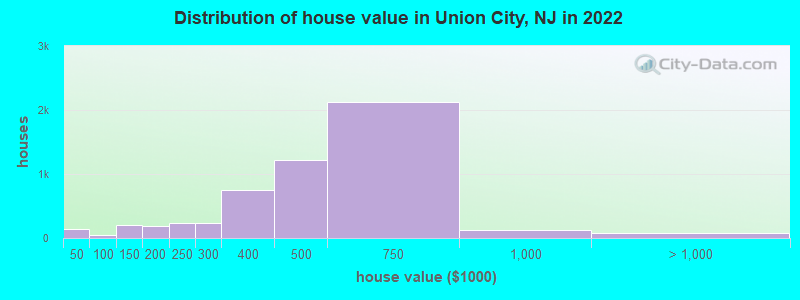
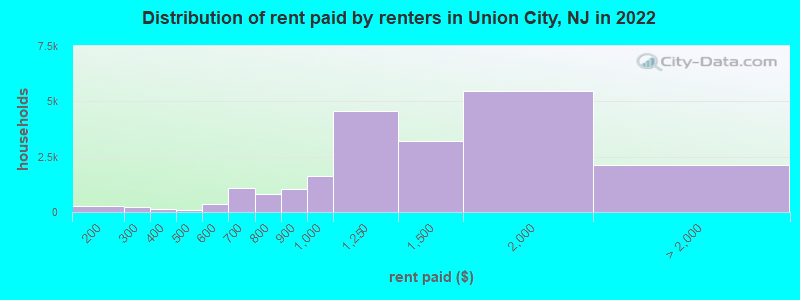
Home value of owner - occupied houses in 2022 in Union City, NJ 119 Less than $10,00013 $20,000 to $24,9999 $25,000 to $29,9995 $40,000 to $49,99929 $50,000 to $59,9996 $60,000 to $69,99961 $100,000 to $124,999144 $125,000 to $149,999110 $150,000 to $174,99970 $175,000 to $199,999236 $200,000 to $249,999238 $250,000 to $299,999752 $300,000 to $399,9991,217 $400,000 to $499,9992,121 $500,000 to $749,999120 $750,000 to $999,99978 $1,000,000 to $1,499,999Rent paid by renters in 2022 in Union City, NJ 9 Less than $10082 $100 to $149189 $150 to $199102 $200 to $249139 $250 to $29979 $300 to $34975 $350 to $39960 $400 to $44951 $450 to $499241 $500 to $549140 $550 to $599399 $600 to $649663 $650 to $699415 $700 to $749394 $750 to $7991,033 $800 to $8991,647 $900 to $9994,555 $1,000 to $1,2493,208 $1,250 to $1,4995,462 $1,500 to $1,9991,282 $2,000 to $2,499382 $2,500 to $2,999123 $3,000 to $3,49940 $3,500 or more274 No cash rent
Percentage of workers working in this county: 60.0%Number of people working at home: 3,447 (11.2% of all workers )
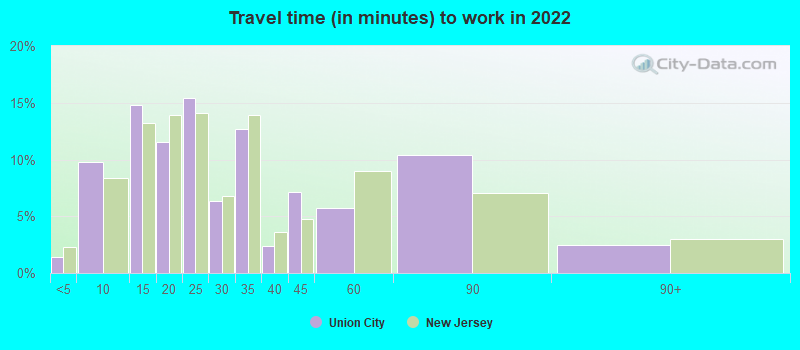
Travel time to work (commute)
Less than 5 minutes: 1015 to 9 minutes: 1,73010 to 14 minutes: 3,56915 to 19 minutes: 3,96420 to 24 minutes: 3,41225 to 29 minutes: 1,65830 to 34 minutes: 3,93535 to 39 minutes: 1,06240 to 44 minutes: 2,10445 to 59 minutes: 2,28060 to 89 minutes: 2,52290 or more minutes: 978
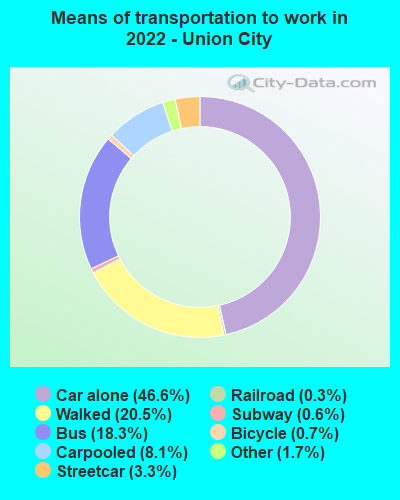
Means of transportation to work:
Drove a car alone: 6,381 (38.2%)Carpooled: 1,158 (6.9%)Bus : 2,502 (15.0%)Subway or elevated rail : 400 (2.4%)Long-distance train or commuter rail : 58 (0.3%)Light rail, streetcar or trolley : 60 (0.4%)Taxi: 264 (1.6%)Bicycle: 70 (0.4%)Walked: 2,936 (17.6%)Worked at home: 2,616 (15.7%)
Unemployment by race in 2022
Unemployment rate for White non-Hispanic residents 4.1% Males1.4% FemalesUnemployment rate for Black residents 1.0% Males2.2% FemalesUnemployment rate for American Indian and Alaska Native residents 4.8% MalesUnemployment rate for Asian residents 4.8% Males6.4% FemalesUnemployment rate for other race residents 6.9% Males11.1% FemalesUnemployment rate for two or more race residents 14.3% Males5.6% FemalesUnemployment rate for Hispanic or Latino residents 8.5% Males2.2% Females
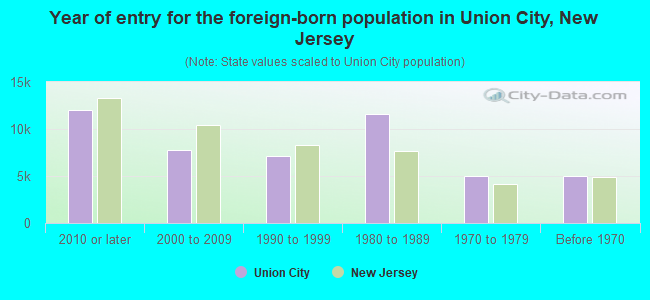
Year of entry for the foreign-born population in Union City, New Jersey
12,055 2010 or later 7,807 2000 to 2009 7,178 1990 to 1999 11,638 1980 to 1989 5,048 1970 to 1979 5,016 Before 1970
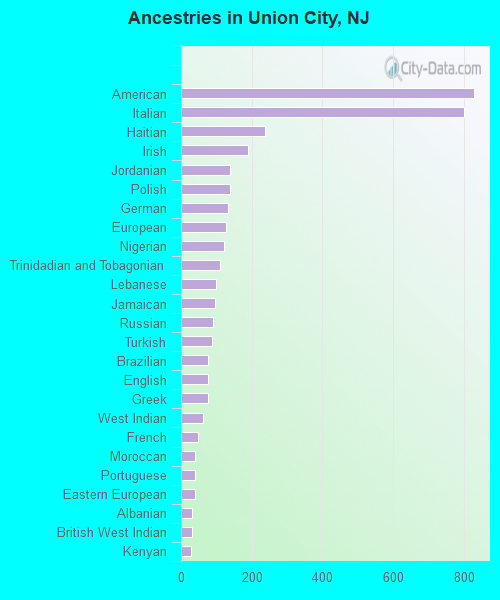
First ancestries reported:
American: 830 (1.8%)
Italian: 801 (1.7%)
Haitian: 238 (0.5%)
Irish: 189 (0.4%)
Jordanian: 140 (0.3%)
Polish: 138 (0.3%)
German: 134 (0.3%)
European: 127 (0.3%)
Nigerian: 122 (0.3%)
Trinidadian and Tobagonian: 111 (0.2%)
Lebanese: 99 (0.2%)
Jamaican: 96 (0.2%)
Russian: 90 (0.2%)
Turkish: 87 (0.2%)
Brazilian: 77 (0.2%)
English: 76 (0.2%)
Greek: 75 (0.2%)
West Indian: 62 (0.1%)
French: 49 (0.1%)
Moroccan: 41 (0.09%)
Portuguese: 41 (0.09%)
Eastern European: 39 (0.08%)
Albanian: 32 (0.07%)
British West Indian: 32 (0.07%)
Kenyan: 27 (0.06%)
Hungarian: 27 (0.06%)
Senegalese: 25 (0.05%)
Macedonian: 23 (0.05%)
Dutch: 23 (0.05%)
Egyptian: 20 (0.04%)
Swiss: 20 (0.04%)
Israeli: 20 (0.04%)
Slavic: 19 (0.04%)
Syrian: 17 (0.04%)
Romanian: 16 (0.03%)
Guyanese: 15 (0.03%)
Ukrainian: 15 (0.03%)
Scotch-Irish: 14 (0.03%)
Barbadian: 14 (0.03%)
Assyrian: 13 (0.03%)
Finnish: 13 (0.03%)
Sierra Leonean: 6 (0.01%) Most common places of birth for foreign-born residents (%): Dominican Republic Union City:
22.3% (8,319)New Jersey:
9.7% (209,055)
Ecuador Union City:
13.4% (4,992)New Jersey:
4.4% (95,275)
Cuba Union City:
13.2% (4,917)New Jersey:
2.1% (45,435)
El Salvador Union City:
9.9% (3,689)New Jersey:
2.3% (48,885)
Mexico Union City:
7.8% (2,924)New Jersey:
4.8% (102,527)
Colombia Union City:
7.4% (2,764)New Jersey:
4.2% (90,817)
Peru Union City:
4.7% (1,742)New Jersey:
2.7% (58,563)
Honduras Union City:
3.2% (1,211)New Jersey:
1.7% (37,335)
Guatemala Union City:
3.1% (1,149)New Jersey:
2.2% (46,813)
Venezuela Union City:
2.9% (1,066)New Jersey:
0.6% (12,929)
Place of birth for U.S.-born residents:
This state: 18,397Other state: 6,034Northeast: 4,339Midwest: 246South: 1,263West: 186 84.6% of Union City residents lived in the same house 1 years ago.
Out of people who lived in different houses, 37.9% lived in this county.
Out of people who lived in different counties, 55.7% lived in New Jersey.
Union City:
84.6%State average:
90.4%
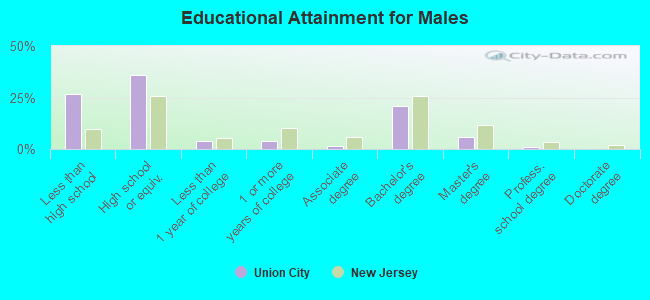
Education attainment for males 25 years and older:
No schooling: 643Nursery to 4th grade: 9455th and 6th grade: 8447th and 8th grade: 8389th grade: 58510th grade: 51211th grade: 52812th grade, no diploma: 978High school graduate (or equivalency): 7,890Less than 1 year of college: 804Some college more than 1 year, no degree: 802Associate degree: 368Bachelor's degree: 4,590Master's degree: 1,230Professional school degree: 229Doctorate degree: 40
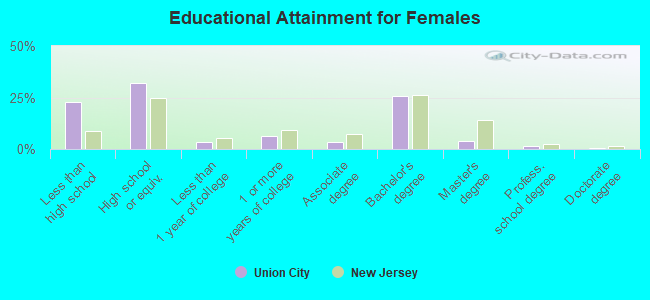
Education attainment for females 25 years and older:
No schooling: 712Nursery to 4th grade: 5165th and 6th grade: 1,4187th and 8th grade: 3459th grade: 42410th grade: 13111th grade: 41812th grade, no diploma: 1,159High school graduate (or equivalency): 7,094Less than 1 year of college: 747Some college more than 1 year, no degree: 1,412Associate degree: 805Bachelor's degree: 5,764Master's degree: 868Professional school degree: 287Doctorate degree: 146
Housing units in structures:
One, detached: 1,602One, attached: 738Two: 4,0693 or 4: 4,2565 to 9: 5,18010 to 19: 4,51420 to 49: 3,65350 or more: 2,274Housing units lacking complete plumbing facilities in 2022: 0.6%Housing units lacking complete kitchen facilities in 2022: 6.1%House/condo owner moved in on average 13 years ago
Renter moved in on average 7 years ago
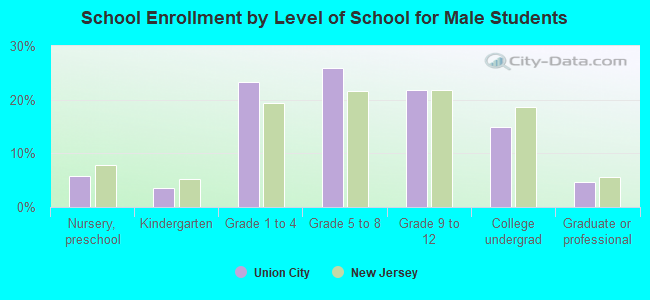
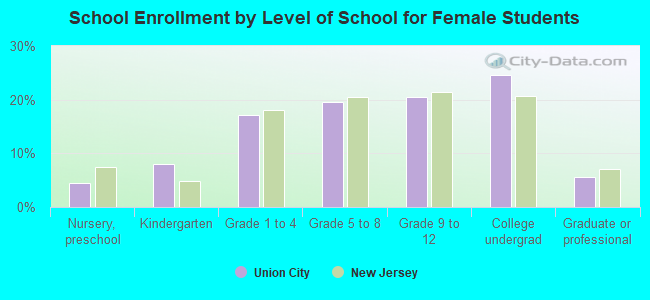
Private vs. public school enrollment:
Students in private schools in grades 1 to 8 (elementary and middle school): 172 Here:
2.5%New Jersey:
12.3%
Students in private schools in grades 9 to 12 (high school): 232 Here:
6.9%New Jersey:
13.1%
Students in private undergraduate colleges: 769 Here:
23.0%New Jersey:
33.2%