Virginia Beach, VA (Virginia) Houses and Residents
Estimated median house or condo value in 2022: $370,300 (it was $121,500 in 2000 )
Virginia Beach:
$370,300Virginia:
$365,700
Lower value quartile - upper value quartile: $266,600 - $515,800Mean price in 2022: Detached houses: $477,539 Here:
$477,539State:
$472,865
Townhouses or other attached units: $318,974 Here:
$318,974State:
$457,437
In 2-unit structures: $459,170 Here:
$459,170State:
$396,289
In 3-to-4-unit structures: $153,857 Here:
$153,857State:
$252,346
In 5-or-more-unit structures: $267,210 Here:
$267,210State:
$382,551
Mobile homes: $37,015 Here:
$37,015State:
$100,736
Total population: 450,980 (Urban population: 419,437, Rural population: 5,820 (267 farm, 5,553 nonfarm ))
Houses: 191,169 (179,752 occupied: 114,026 owner occupied, 65,726 renter occupied )
% of renters here:
37%State:
33%
Housing density: 770 houses/condos per square mile
Median price asked for vacant for-sale houses and condos in 2022: $346,084.
Median contract rent in 2022: $1,400 (lower quartile is $1,129, upper quartile is $1,761)
Median rent asked for vacant for-rent units in 2022: $2,360
Median gross rent in Virginia Beach, VA in 2022: $1,550
Housing units in Virginia Beach with a mortgage: 84,143 (8,269 second mortgage, 592 home equity loan, 6,452 both second mortgage and home equity loan )Houses without a mortgage: 2,784
Median household income for houses/condos with a mortgage: $106,718
Median household income for apartments without a mortgage: $87,972
Median monthly housing costs: $1,596
Data:
Median house or condo value ($)
Median house or condo value ($ change since 2000)
Median house or condo value ($) - White
Median house or condo value ($) - Black or African American
Median house or condo value ($) - Asian
Median house or condo value ($) - Hispanic or Latino
Median house or condo value ($) - American Indian and Alaska Native
Median house or condo value ($) - Multirace
Median house or condo value ($) - Other Race
Median price asked for mobile homes ($)
Household density (households per square mile)
Mean house or condo value by units in structure - 1, detached ($)
Mean house or condo value by units in structure - 1, attached ($)
Mean house or condo value by units in structure - 2 ($)
Mean house or condo value by units in structure by units in structure - 3 or 4 ($)
Mean house or condo value by units in structure - 5 or more ($)
Mean house or condo value by units in structure - Boat, RV, van, etc. ($)
Mean house or condo value by units in structure - Mobile home ($)
Median contract rent ($)
Median contract rent - Lower quartile ($)
Median contract rent - Upper quartile ($)
Median gross rent ($)
Urban houses (%)
Rural houses (%)
Houses occupied (%)
Houses occupied (% change since 2000)
Houses owner occupied (%)
Houses owner occupied (% change since 2000)
Houses renter occupied (%)
Houses renter occupied (% change since 2000)
Vacant housing units - For rent (%)
Vacant housing units - For rent (% change since 2000)
Vacant housing units - For sale only (%)
Vacant housing units - For sale only (% change since 2000)
Vacant housing units - Rented or sold, not occupied (%)
Vacant housing units - Rented or sold, not occupied (% change since 2000)
Vacant housing units - For seasonal, recreational, or occasional use (%)
Vacant housing units - For seasonal, recreational, or occasional use (% change since 2000)
Vacant housing units - For migrant workers (%)
Vacant housing units - For migrant workers (% change since 2000)
Vacant housing units - Other vacant (%)
Vacant housing units - Other vacant (% change since 2000)
Median monthly housing costs ($)
Median household income for houses/condos with a mortgage ($)
Median household income for houses/condos without a mortgage ($)
Median household income ($)
Median household income ($) - White
Median household income ($) - Black or African American
Median household income ($) - Asian
Median household income ($) - Hispanic or Latino
Median household income ($) - American Indian and Alaska Native
Median household income ($) - Multirace
Median household income ($) - Other Race
Mortgage status - with mortgage (%)
Mortgage status - with second mortgage (%)
Mortgage status - with home equity loan (%)
Mortgage status - with both second mortgage and home equity loan (%)
Mortgage status - without a mortgage (%)
Median year house/condo built
Median year apartment built
Household type by relationship - Male householder living alone (%)
Household type by relationship - Male householder not living alone (%)
Household type by relationship - Female householder living alone (%)
Household type by relationship - Female householder not living alone (%)
Household type by relationship - Opposite-Sex spouse (%)
Household type by relationship - Same-Sex spouse (%)
Household type by relationship - Opposite-Sex unmarried partner (%)
Household type by relationship - Same-Sex unmarried partner (%)
Household type by relationship - In group quarters (%)
Size of family households - 2-person household (%)
Size of family households - 3-person household (%)
Size of family households - 4-person household (%)
Size of family households - 5-person household (%)
Size of family households - 6-person household (%)
Size of family households - 7-or-more-person household (%)
Size of nonfamily households - 1-person household (%)
Size of nonfamily households - 2-person household (%)
Size of nonfamily households - 3-person household (%)
Size of nonfamily households - 4-person household (%)
Size of nonfamily households - 5-person household (%)
Size of nonfamily households - 6-person household (%)
Size of nonfamily households - 7-or-moreperson household (%)
Year house built - Built 2010 or later (%)
Year house built - Built 2000 to 2009 (%)
Year house built - Built 1990 to 1999 (%)
Year house built - Built 1980 to 1989 (%)
Year house built - Built 1970 to 1979 (%)
Year house built - Built 1960 to 1969 (%)
Year house built - Built 1950 to 1959 (%)
Year house built - Built 1940 to 1949 (%)
Year house built - Built 1939 or earlier (%)
Median number of rooms in houses and condos
Median number of rooms in apartments
Median number of bedrooms in owner occupied houses
Mean number of bedrooms in owner occupied houses
Median number of bedrooms in renter occupied houses
Mean number of bedrooms in renter occupied houses
Median number of vehichles in owner occupied houses
Mean number of vehichles in owner occupied houses
Median number of vehichles in renter occupied houses
Mean number of vehichles in renter occupied houses
Rooms in owner-occupied houses - 1 room (%)
Rooms in owner-occupied houses - 2 rooms (%)
Rooms in owner-occupied houses - 3 rooms (%)
Rooms in owner-occupied houses - 4 rooms (%)
Rooms in owner-occupied houses - 5 rooms (%)
Rooms in owner-occupied houses - 6 rooms (%)
Rooms in owner-occupied houses - 7 rooms (%)
Rooms in owner-occupied houses - 8 rooms (%)
Rooms in owner-occupied houses - 9+ rooms (%)
Rooms in renter-occupied houses - 1 room (%)
Rooms in renter-occupied houses - 2 rooms (%)
Rooms in renter-occupied houses - 3 rooms (%)
Rooms in renter-occupied houses - 4 rooms (%)
Rooms in renter-occupied houses - 5 rooms (%)
Rooms in renter-occupied houses - 6 rooms (%)
Rooms in renter-occupied houses - 7 rooms (%)
Rooms in renter-occupied houses - 8 rooms (%)
Rooms in renter-occupied houses - 9+ rooms (%)
Bedrooms in owner-occupied houses - no bedrooms (%)
Bedrooms in owner-occupied houses - 1 bedroom (%)
Bedrooms in owner-occupied houses - 2 bedrooms (%)
Bedrooms in owner-occupied houses - 3 bedrooms (%)
Bedrooms in owner-occupied houses - 4 bedrooms (%)
Bedrooms in owner-occupied houses - 5+ bedrooms (%)
Bedrooms in renter-occupied houses - no bedrooms (%)
Bedrooms in renter-occupied houses - 1 bedroom (%)
Bedrooms in renter-occupied houses - 2 bedrooms (%)
Bedrooms in renter-occupied houses - 3 bedrooms (%)
Bedrooms in renter-occupied houses - 4 bedrooms (%)
Bedrooms in renter-occupied houses - 5+ bedrooms (%)
Vehicles available in owner-occupied houses - no vehicle available (%)
Vehicles available in owner-occupied houses - 1 vehicle available(%)
Vehicles available in owner-occupied houses - 2 Vehicles available (%)
Vehicles available in owner-occupied houses - 3 Vehicles available (%)
Vehicles available in owner-occupied houses - 4 Vehicles available (%)
Vehicles available in owner-occupied houses - 5+ Vehicles available (%)
Vehicles available in renter-occupied houses - no vehicle available (%)
Vehicles available in renter-occupied houses - 1 vehicle available (%)
Vehicles available in renter-occupied houses - 2 Vehicles available (%)
Vehicles available in renter-occupied houses - 3 Vehicles available (%)
Vehicles available in renter-occupied houses - 4 Vehicles available (%)
Vehicles available in renter-occupied houses - 5+ Vehicles available (%)
Housing units in structures - 1, detached (%)
Housing units in structures - 1, attached (%)
Housing units in structures - 2 (%)
Housing units in structures - 3 or 4 (%)
Housing units in structures - 5 to 9 (%)
Housing units in structures - 10 to 19 (%)
Housing units in structures - 20 to 49 (%)
Housing units in structures - 50 or more (%)
Housing units in structures - Mobile home (%)
Housing units in structures - Boat, RV, van, etc. (%)
Housing units in structures - Owners - 1, detached (%)
Housing units in structures - Owners - 1, attached (%)
Housing units in structures - Owners - 2 (%)
Housing units in structures - Owners - 3 or 4 (%)
Housing units in structures - Owners - 5 to 9 (%)
Housing units in structures - Owners - 10 to 19 (%)
Housing units in structures - Owners - 20 to 49 (%)
Housing units in structures - Owners - 50 or more (%)
Housing units in structures - Owners - Mobile home (%)
Housing units in structures - Owners - Boat, RV, van, etc. (%)
Housing units in structures - Renters - 1, detached (%)
Housing units in structures - Renters - 1, attached (%)
Housing units in structures - Renters - 2 (%)
Housing units in structures - Renters - 3 or 4 (%)
Housing units in structures - Renters - 5 to 9 (%)
Housing units in structures - Renters - 10 to 19 (%)
Housing units in structures - Renters - 20 to 49 (%)
Housing units in structures - Renters - 50 or more (%)
Housing units in structures - Renters - Mobile home (%)
Housing units in structures - Renters - Boat, RV, van, etc. (%)
House/condo owner moved in on average (years ago)
Renter moved in on average (years ago)
Year householder moved into unit - Moved in 1999 to March 2000 (%)
Year householder moved into unit - Moved in 1999 to March 2000 (%) - White
Year householder moved into unit - Moved in 1999 to March 2000 (%) - Black or African American
Year householder moved into unit - Moved in 1999 to March 2000 (%) - Asian
Year householder moved into unit - Moved in 1999 to March 2000 (%) - Hispanic or Latino
Year householder moved into unit - Moved in 1999 to March 2000 (%) - American Indian and Alaska Native
Year householder moved into unit - Moved in 1999 to March 2000 (%) - Multirace
Year householder moved into unit - Moved in 1999 to March 2000 (%) - Other Race
Year householder moved into unit - Moved in 1995 to 1998 (%)
Year householder moved into unit - Moved in 1995 to 1998 (%) - White
Year householder moved into unit - Moved in 1995 to 1998 (%) - Black or African American
Year householder moved into unit - Moved in 1995 to 1998 (%) - Asian
Year householder moved into unit - Moved in 1995 to 1998 (%) - Hispanic or Latino
Year householder moved into unit - Moved in 1995 to 1998 (%) - American Indian and Alaska Native
Year householder moved into unit - Moved in 1995 to 1998 (%) - Multirace
Year householder moved into unit - Moved in 1995 to 1998 (%) - Other Race
Year householder moved into unit - Moved in 1990 to 1994 (%)
Year householder moved into unit - Moved in 1990 to 1994 (%) - White
Year householder moved into unit - Moved in 1990 to 1994 (%) - Black or African American
Year householder moved into unit - Moved in 1990 to 1994 (%) - Asian
Year householder moved into unit - Moved in 1990 to 1994 (%) - Hispanic or Latino
Year householder moved into unit - Moved in 1990 to 1994 (%) - American Indian and Alaska Native
Year householder moved into unit - Moved in 1990 to 1994 (%) - Multirace
Year householder moved into unit - Moved in 1990 to 1994 (%) - Other Race
Year householder moved into unit - Moved in 1980 to 1989 (%)
Year householder moved into unit - Moved in 1980 to 1989 (%) - White
Year householder moved into unit - Moved in 1980 to 1989 (%) - Black or African American
Year householder moved into unit - Moved in 1980 to 1989 (%) - Asian
Year householder moved into unit - Moved in 1980 to 1989 (%) - Hispanic or Latino
Year householder moved into unit - Moved in 1980 to 1989 (%) - American Indian and Alaska Native
Year householder moved into unit - Moved in 1980 to 1989 (%) - Multirace
Year householder moved into unit - Moved in 1980 to 1989 (%) - Other Race
Year householder moved into unit - Moved in 1970 to 1979 (%)
Year householder moved into unit - Moved in 1970 to 1979 (%) - White
Year householder moved into unit - Moved in 1970 to 1979 (%) - Black or African American
Year householder moved into unit - Moved in 1970 to 1979 (%) - Asian
Year householder moved into unit - Moved in 1970 to 1979 (%) - Hispanic or Latino
Year householder moved into unit - Moved in 1970 to 1979 (%) - American Indian and Alaska Native
Year householder moved into unit - Moved in 1970 to 1979 (%) - Multirace
Year householder moved into unit - Moved in 1970 to 1979 (%) - Other Race
Year householder moved into unit - Moved in 1969 or earlier (%)
Year householder moved into unit - Moved in 1969 or earlier (%) - White
Year householder moved into unit - Moved in 1969 or earlier (%) - Black or African American
Year householder moved into unit - Moved in 1969 or earlier (%) - Asian
Year householder moved into unit - Moved in 1969 or earlier (%) - Hispanic or Latino
Year householder moved into unit - Moved in 1969 or earlier (%) - American Indian and Alaska Native
Year householder moved into unit - Moved in 1969 or earlier (%) - Multirace
Year householder moved into unit - Moved in 1969 or earlier (%) - Other Race
Housing units lacking complete plumbing facilities (%)
Housing units lacking complete kitchen facilities (%)
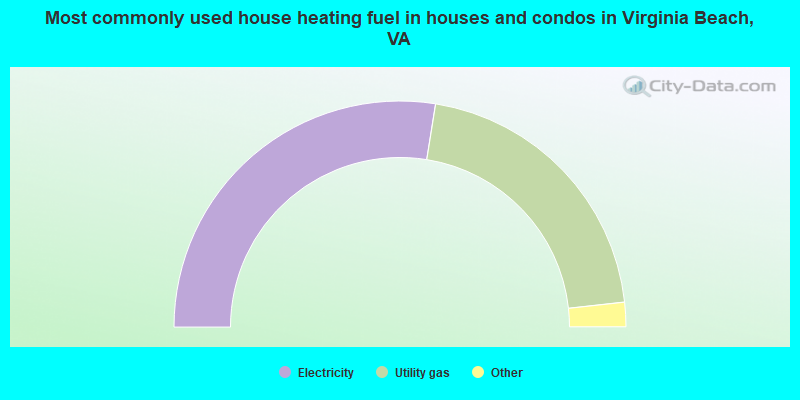
House heating fuel used in houses and condos - Utility gas (%)
House heating fuel used in houses and condos - Bottled, tank, or LP gas (%)
House heating fuel used in houses and condos - Electricity (%)
House heating fuel used in houses and condos - Fuel oil, kerosene, etc. (%)
House heating fuel used in houses and condos - Coal or coke (%)
House heating fuel used in houses and condos - Wood (%)
House heating fuel used in houses and condos - Solar energy (%)
House heating fuel used in houses and condos - Other fuel (%)
House heating fuel used in houses and condos - No fuel used (%)
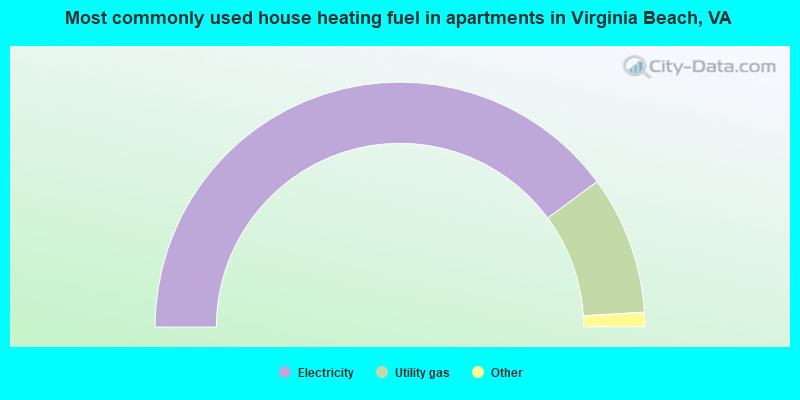
House heating fuel used in apartments - Utility gas (%)
House heating fuel used in apartments - Bottled, tank, or LP gas (%)
House heating fuel used in apartments - Electricity (%)
House heating fuel used in apartments - Fuel oil, kerosene, etc. (%)
House heating fuel used in apartments - Coal or coke (%)
House heating fuel used in apartments - Wood (%)
House heating fuel used in apartments - Solar energy (%)
House heating fuel used in apartments - Other fuel (%)
House heating fuel used in apartments - No fuel used (%)
Median year house/condo built: 1983Median year apartment built: 1984Household type by relationship:
Households: 455,618
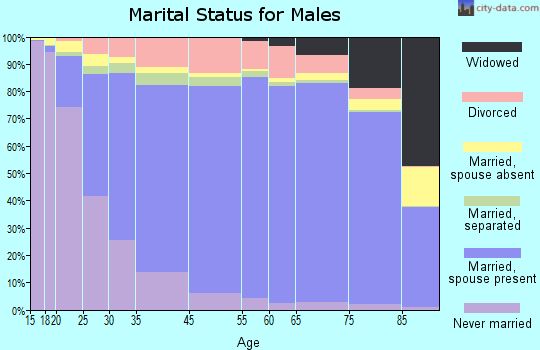
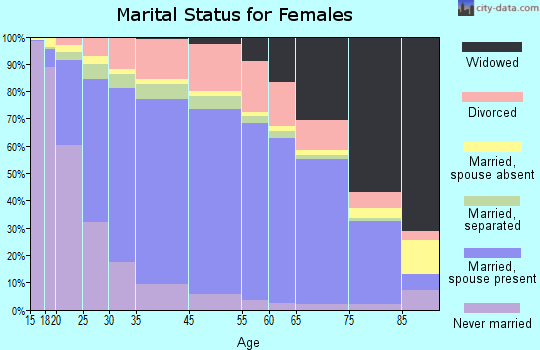
Male householders: 91,323 (21,550 living alone ), Female householders: 88,429 (28,344 living alone )84,010 spouses (83,462 opposite-sex spouses ), 12,772 unmarried partners , (11,995 opposite-sex unmarried partners ), 131,140 children (124,222 natural , 1,707 adopted , 5,211 stepchildren ), 8,542 grandchildren , 6,288 brothers or sisters , 6,983 parents , 99 foster children , 5,868 other relatives , 12,845 non-relatives In group quarters: 7,319
Size of family households: 53,339 2-persons , 30,343 3-persons , 20,067 4-persons , 7,999 5-persons , 3,370 6-persons , 1,851 7-or-more-persons .
Size of nonfamily households: 49,894 1-person , 11,075 2-persons , 1,076 3-persons , 677 4-persons , 61 6-persons .
60,153 married couples with children. single-parent households (7,454 men , 22,394 women ).
87.9% of residents of Virginia Beach speak English at home. of residents speak Spanish at home (70% speak English very well , 12% speak English well , 11% speak English not well , 7% don't speak English at all ).of residents speak other Indo-European language at home (75% speak English very well , 15% speak English well , 10% speak English not well , 1% don't speak English at all ).of residents speak Asian or Pacific Island language at home (63% speak English very well , 25% speak English well , 10% speak English not well , 2% don't speak English at all ).of residents speak other language at home (90% speak English very well , 8% speak English well , 2% speak English not well ).
Foreign born population: 42,796 (9.4%)of them are naturalized citizens )
Median number of rooms in houses and condos:
Median number of rooms in apartments
Owner-occupied Renter-occupied
Bedrooms in owner-occupied houses and condos in Virginia Beach, Virginia
106 no bedroom 850 1 bedroom 12,921 2 bedrooms 52,129 3 bedrooms 35,987 4 bedrooms 12,033 5+ bedrooms
Bedrooms in renter-occupied apartments in Virginia Beach, Virginia
1,126 no bedroom 14,300 1 bedroom 28,459 2 bedrooms 17,168 3 bedrooms 4,462 4 bedrooms 211 5+ bedrooms
Owner-occupied Renter-occupied
Cars and other vehicles available in Virginia Beach in owner-occupied houses/condos
1,346 no vehicle 28,613 1 vehicle 49,917 2 vehicles 23,568 3 vehicles 7,368 4 vehicles 3,214 5+ vehicles
Cars and other vehicles available in Virginia Beach in renter-occupied apartments
5,571 no vehicle 33,216 1 vehicle 20,395 2 vehicles 4,638 3 vehicles 1,345 4 vehicles 561 5+ vehicles
Owner-occupied Renter-occupied
Rooms in owner-occupied houses in Virginia Beach, Virginia
47 1 room 123 2 rooms 1,309 3 rooms 9,114 4 rooms 14,273 5 rooms 23,227 6 rooms 17,981 7 rooms 19,996 8 rooms 27,956 9+ rooms
Rooms in renter-occupied apartments in Virginia Beach, Virginia
1,069 1 room 2,820 2 rooms 12,822 3 rooms 19,263 4 rooms 9,614 5 rooms 8,942 6 rooms 5,988 7 rooms 2,317 8 rooms 2,891 9+ rooms
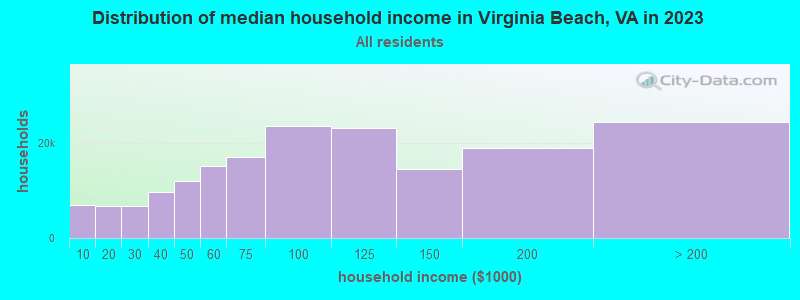
Virginia Beach, VA household income distribution 8,962 Less than $10,0007,511 $10,000 to $19,9999,147 $20,000 to $29,9999,938 $30,000 to $39,99912,580 $40,000 to $49,99914,895 $50,000 to $59,99919,055 $60,000 to $74,99922,882 $75,000 to $99,99921,478 $100,000 to $124,99915,451 $125,000 to $149,99917,194 $150,000 to $199,99920,659 $200,000 or more
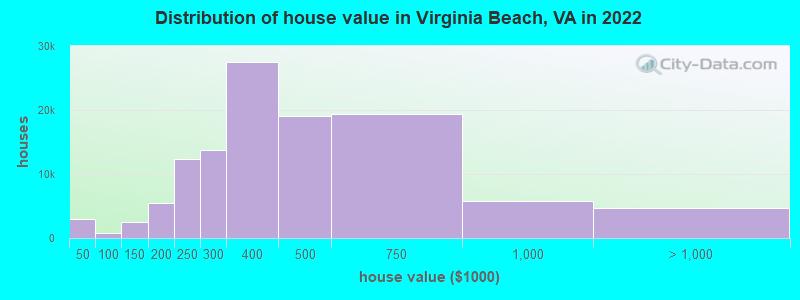
Home value of owner - occupied houses in 2022 in Virginia Beach, VA 1,370 Less than $10,000190 $10,000 to $14,999269 $15,000 to $19,999333 $20,000 to $24,999237 $25,000 to $29,999257 $30,000 to $34,999152 $35,000 to $39,999144 $40,000 to $49,999148 $50,000 to $59,99945 $60,000 to $69,99932 $70,000 to $79,999193 $80,000 to $89,999213 $90,000 to $99,999967 $100,000 to $124,9991,546 $125,000 to $149,9992,297 $150,000 to $174,9993,141 $175,000 to $199,99912,411 $200,000 to $249,99913,770 $250,000 to $299,99927,457 $300,000 to $399,99919,127 $400,000 to $499,99919,335 $500,000 to $749,9995,737 $750,000 to $999,9992,852 $1,000,000 to $1,499,999751 $1,500,000 to $1,999,9991,052 $2,000,000 or moreRent paid by renters in 2022 in Virginia Beach, VA 276 Less than $10070 $100 to $149685 $200 to $249243 $300 to $34998 $350 to $399330 $500 to $54978 $550 to $599212 $600 to $649270 $650 to $699535 $700 to $7492,256 $800 to $8994,678 $900 to $99911,949 $1,000 to $1,24916,817 $1,250 to $1,49917,656 $1,500 to $1,9995,091 $2,000 to $2,499836 $2,500 to $2,999290 $3,000 to $3,4991,245 $3,500 or more2,111 No cash rent
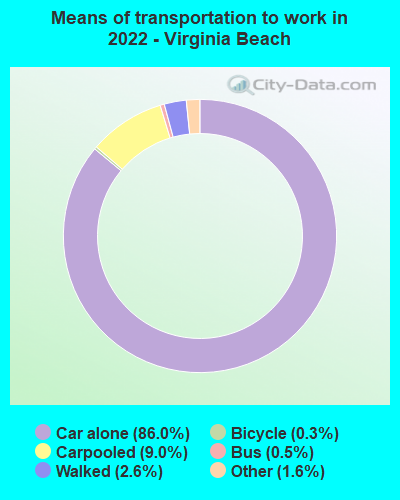
Percentage of workers working in this county: 69.1%Number of people working at home: 36,727 (15.5% of all workers )
Travel time to work (commute)
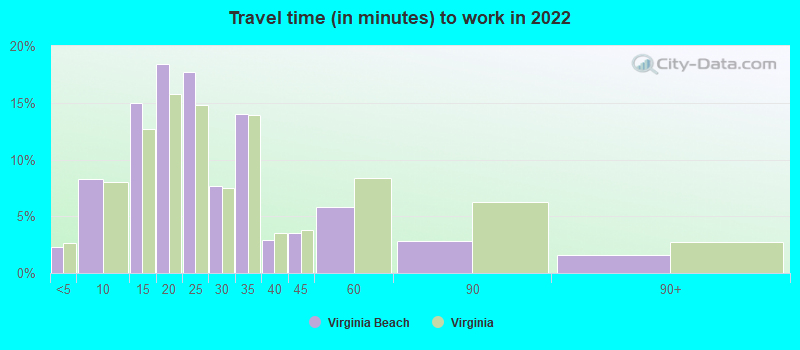
Less than 5 minutes: 4,2605 to 9 minutes: 14,76210 to 14 minutes: 28,85515 to 19 minutes: 37,52020 to 24 minutes: 37,39725 to 29 minutes: 17,24730 to 34 minutes: 31,95835 to 39 minutes: 4,92440 to 44 minutes: 4,92745 to 59 minutes: 10,86960 to 89 minutes: 4,96190 or more minutes: 2,825
Means of transportation to work:
Drove a car alone: 163,231 (72.1%)Carpooled: 16,992 (7.5%)Bus : 967 (0.4%)Light rail, streetcar or trolley : 50 (0.0%)Taxi: 3,026 (1.3%)Bicycle: 487 (0.2%)Walked: 4,988 (2.2%)Worked at home: 36,727 (16.2%)
Unemployment by race in 2022
Unemployment rate for White non-Hispanic residents 3.0% Males2.4% FemalesUnemployment rate for Black residents 6.3% Males3.9% FemalesUnemployment rate for Asian residents 4.4% Males1.8% FemalesUnemployment rate for other race residents 6.7% MalesUnemployment rate for two or more race residents 5.5% Males3.0% FemalesUnemployment rate for Hispanic or Latino residents 6.7% Males3.5% Females
Year of entry for the foreign-born population in Virginia Beach, Virginia
13,744 2010 or later 8,562 2000 to 2009 7,144 1990 to 1999 7,324 1980 to 1989 6,197 1970 to 1979 5,769 Before 1970
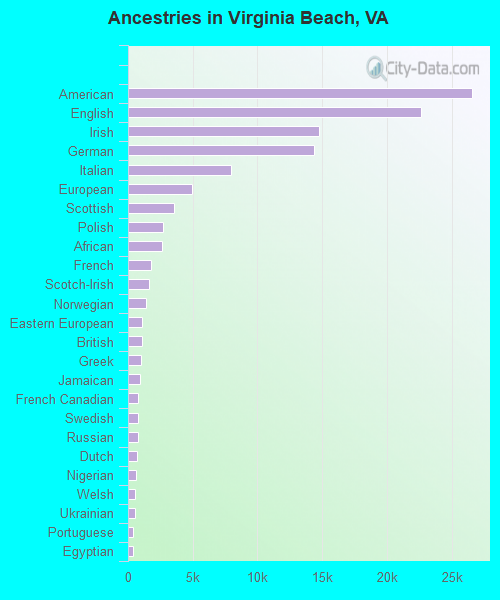
First ancestries reported:
American: 26,550 (11.8%)
English: 22,632 (10.0%)
Irish: 14,727 (6.5%)
German: 14,337 (6.4%)
Italian: 7,982 (3.5%)
European: 4,930 (2.2%)
Scottish: 3,566 (1.6%)
Polish: 2,694 (1.2%)
African: 2,646 (1.2%)
French: 1,738 (0.8%)
Scotch-Irish: 1,647 (0.7%)
Norwegian: 1,367 (0.6%)
Eastern European: 1,068 (0.5%)
British: 1,044 (0.5%)
Greek: 1,023 (0.5%)
Jamaican: 949 (0.4%)
French Canadian: 810 (0.4%)
Swedish: 769 (0.3%)
Russian: 762 (0.3%)
Dutch: 669 (0.3%)
Nigerian: 649 (0.3%)
Welsh: 540 (0.2%)
Ukrainian: 535 (0.2%)
Portuguese: 393 (0.2%)
Egyptian: 369 (0.2%)
Scandinavian: 365 (0.2%)
Lithuanian: 362 (0.2%)
Albanian: 355 (0.2%)
Northern European: 342 (0.2%)
Czech: 326 (0.1%)
Slovak: 324 (0.1%)
Ghanaian: 318 (0.1%)
Canadian: 313 (0.1%)
Haitian: 266 (0.1%)
Turkish: 257 (0.1%)
Romanian: 243 (0.1%)
Lebanese: 237 (0.1%)
Austrian: 235 (0.1%)
West Indian: 220 (0.10%)
Hungarian: 218 (0.10%)
Brazilian: 201 (0.09%)
Danish: 189 (0.08%)
Armenian: 145 (0.06%)
Israeli: 133 (0.06%)
Bulgarian: 132 (0.06%)
Trinidadian and Tobagonian: 132 (0.06%)
Swiss: 128 (0.06%)
British West Indian: 128 (0.06%)
Ethiopian: 116 (0.05%)
Palestinian: 102 (0.05%)
Cypriot: 101 (0.04%)
Liberian: 99 (0.04%)
Finnish: 95 (0.04%)
Afghan: 94 (0.04%)
Guyanese: 93 (0.04%)
South African: 90 (0.04%)
Iranian: 89 (0.04%)
Czechoslovakian: 87 (0.04%)
Belgian: 84 (0.04%)
Icelander: 67 (0.03%)
Moroccan: 65 (0.03%)
Syrian: 60 (0.03%)
Serbian: 56 (0.02%)
Pennsylvania German: 44 (0.02%)
Australian: 44 (0.02%)
Sudanese: 41 (0.02%)
Slavic: 37 (0.02%)
Celtic: 37 (0.02%)
Cape Verdean: 27 (0.01%)
Dutch West Indian: 27 (0.01%)
Slovene: 25 (0.01%)
Estonian: 22 (0.01%)
Croatian: 22 (0.01%)
Barbadian: 19 (0.01%)
Senegalese: 18 (0.01%)
Kenyan: 18 (0.01%)
Belizean: 16 (0.01%)
Latvian: 12 (0.01%)
Most common places of birth for foreign-born residents (%): Philippines Virginia Beach:
28.7% (12,376)Virginia:
4.8% (52,629)
India Virginia Beach:
6.4% (2,741)Virginia:
9.0% (97,830)
China, excluding Hong Kong and Taiwan Virginia Beach:
4.3% (1,836)Virginia:
3.9% (42,989)
Vietnam Virginia Beach:
4.1% (1,774)Virginia:
4.2% (45,750)
Mexico Virginia Beach:
3.7% (1,608)Virginia:
5.3% (57,498)
Colombia Virginia Beach:
2.1% (921)Virginia:
1.3% (14,435)
Germany Virginia Beach:
1.9% (832)Virginia:
1.7% (18,227)
Brazil Virginia Beach:
1.9% (798)Virginia:
0.7% (8,081)
El Salvador Virginia Beach:
1.8% (782)Virginia:
9.9% (107,534)
Venezuela Virginia Beach:
1.7% (751)Virginia:
0.8% (8,186)
Canada Virginia Beach:
1.7% (743)Virginia:
1.2% (12,984)
Jamaica Virginia Beach:
1.7% (732)Virginia:
1.0% (10,734)
Honduras Virginia Beach:
1.6% (690)Virginia:
3.0% (32,892)
United Kingdom, excluding England and Scotland Virginia Beach:
1.6% (680)Virginia:
0.8% (8,513)
Nigeria Virginia Beach:
1.6% (674)Virginia:
0.6% (6,956)
Peru Virginia Beach:
1.5% (656)Virginia:
2.4% (26,366)
Place of birth for U.S.-born residents:
This state: 191,979Other state: 209,170Northeast: 67,254Midwest: 33,108South: 77,239West: 31,569 84.1% of Virginia Beach residents lived in the same house 1 years ago.
Out of people who lived in different houses, 27.3% lived in this county.
Out of people who lived in different counties, 49.4% lived in Virginia.
Virginia Beach:
84.1%State average:
86.6%
Education attainment for males 25 years and older:
No schooling: 2,135Nursery to 4th grade: 4955th and 6th grade: 1127th and 8th grade: 1,0729th grade: 76810th grade: 1,59711th grade: 1,22312th grade, no diploma: 2,533High school graduate (or equivalency): 36,288Less than 1 year of college: 10,974Some college more than 1 year, no degree: 24,416Associate degree: 12,657Bachelor's degree: 34,453Master's degree: 16,317Professional school degree: 3,362Doctorate degree: 3,997
Education attainment for females 25 years and older:
No schooling: 1,708Nursery to 4th grade: 05th and 6th grade: 4087th and 8th grade: 1,0939th grade: 60810th grade: 1,25811th grade: 1,48812th grade, no diploma: 1,668High school graduate (or equivalency): 34,746Less than 1 year of college: 11,873Some college more than 1 year, no degree: 22,624Associate degree: 17,734Bachelor's degree: 41,177Master's degree: 21,267Professional school degree: 3,268Doctorate degree: 3,947
Housing units in structures:
One, detached: 101,431One, attached: 31,186Two: 2,4933 or 4: 9,7425 to 9: 17,96710 to 19: 10,08520 to 49: 3,38750 or more: 13,260Mobile homes: 1,547Boats, RVs, vans, etc.: 71Median worth of mobile homes: $17,300
Housing units lacking complete plumbing facilities in 2022: 0.6%Housing units lacking complete kitchen facilities in 2022: 0.7%House/condo owner moved in on average 10 years ago
Renter moved in on average 2 years ago
Private vs. public school enrollment:
Students in private schools in grades 1 to 8 (elementary and middle school): 5,945 Students in private schools in grades 9 to 12 (high school): 1,378 Students in private undergraduate colleges: 5,032