Walnut Park, CA (California) Houses and Residents
| Walnut Park: | $610,636 |
| California: | $715,900 |
Total population: 15,966 (All urban)
Houses: 3,946 (3,865 occupied: 2,027 owner occupied, 1,853 renter occupied)
| % of renters here: | 48% |
| State: | 44% |
Housing density: 5,346 houses/condos per square mile
Median price asked for vacant for-sale houses and condos in 2022 in this county: $1,291,802.
Median contract rent in 2022: $1,224 (lower quartile is $996, upper quartile is $1,540)
Median rent asked for vacant for-rent units in 2022: $1,069
Median gross rent in Walnut Park, CA in 2022: $1,341
Housing units in Walnut Park with a mortgage: 1,398 (99 second mortgage, 0 home equity loan, 80 both second mortgage and home equity loan)
Houses without a mortgage: 13
Median household income for houses/condos with a mortgage: $93,861
Median household income for apartments without a mortgage: $92,710
Median monthly housing costs: $1,463
Compare current foreclosures near Walnut Park, CA:
| Photo | Address | Area | Beds / Baths | Price | Details |
|---|---|---|---|---|---|

|
#1
Millbury Ave
Baldwin Park, CA 91706
|
1,632 sq. feet
|
2 baths 4 beds |
$895,000
|
show details |

|
#2
Hawkstone Ave
Whittier, CA 90605
|
1,444 sq. feet
|
2 baths 4 beds |
$674,900
|
show details |

|
#3
Cedarbrook Dr
Beverly Hills, CA 90210
|
2,371 sq. feet
|
2 baths 3 beds |
$2,350,000
|
show details |

|
#4
Horn Ave Apt 618
West Hollywood, CA 90069
|
797 sq. feet
|
1 baths 1 beds |
$650,000
|
show details |

|
#5
Flicker Way
West Hollywood, CA 90069
|
1,612 sq. feet
|
3 baths 3 beds |
$2,195,500
|
show details |

|
#6
Wilshire Blvd Apt 703
Los Angeles, CA 90024
|
2,245 sq. feet
|
2 baths 2 beds |
$1,750,000
|
show details |

|
#7
N Beachwood Dr
Los Angeles, CA 90068
|
1,848 sq. feet
|
2 baths 2 beds |
show details | |

|
#8
N Commonwealth Ave
Los Angeles, CA 90004
|
3,937 sq. feet
|
6 baths 6 beds |
show details | |

|
#9
Bohlig Rd Apt 45
Los Angeles, CA 90032
|
813 sq. feet
|
2 baths 2 beds |
show details | |

|
#10
Marina City Dr Unit 116
Marina Del Rey, CA 90292
|
1,722 sq. feet
|
2 baths 3 beds |
show details |
| Photo | Address | Area | Beds / Baths | Price | Details |
|---|---|---|---|---|---|

|
#11
Mira Mar Ave
Long Beach, CA 90814
|
1,902 sq. feet
|
2 baths 4 beds |
show details | |

|
#12
Redondo Avenue, Units 5-8
Long Beach, CA 90804
|
3,360 sq. feet
|
4 baths 8 beds |
show details | |

|
#13
And 6111 Northside Drive
Los Angeles, CA 90022
|
1,329 sq. feet
|
4 baths 3 beds |
show details | |

|
#14
W Arbor St # 57
Long Beach, CA 90805
|
1,585 sq. feet
|
2 baths 3 beds |
show details | |

|
#15
Norwalk Blvd Apt
Hawaiian Gardens, CA 90716
|
800 sq. feet
|
2 baths 1 beds |
show details | |

|
#16
E 60th St
Los Angeles, CA 90001
|
1,883 sq. feet
|
3 baths 5 beds |
show details | |

|
#17
6th Ave
Venice, CA 90291
|
3,192 sq. feet
|
3 baths 6 beds |
show details | |

|
#18
W 110th St
Inglewood, CA 90303
|
3,481 sq. feet
|
4 baths 6 beds |
show details | |

|
#19
Date St
Montebello, CA 90640
|
1,440 sq. feet
|
2 baths 3 beds |
show details | |

|
#20
E 54th St
Maywood, CA 90270
|
1,066 sq. feet
|
1 baths 2 beds |
show details |
| Photo | Address | Area | Beds / Baths | Price | Details |
|---|---|---|---|---|---|

|
#21
Dicky St
Whittier, CA 90606
|
896 sq. feet
|
1 baths 2 beds |
show details | |

|
#22
W Sunset Blvd
Los Angeles, CA 90049
|
3,627 sq. feet
|
5 baths 4 beds |
show details | |

|
#23
E Victoria Ave
Montebello, CA 90640
|
1,025 sq. feet
|
1 baths 2 beds |
show details | |

|
#24
-1626 W 11th St
Los Angeles, CA 90015
|
- sq. feet
|
1 baths 3 beds |
show details | |

|
#25
Strongs Dr
Venice, CA 90291
|
1,723 sq. feet
|
2 baths 2 beds |
show details | |

|
#26
& 5917a Everett Ave
Huntington Park, CA 90255
|
- sq. feet
|
1 baths 2 beds |
show details | |

|
#27
S New England St
Los Angeles, CA 90006
|
1,509 sq. feet
|
4 baths 5 beds |
show details | |

|
#28
Veragua Dr
Playa Del Rey, CA 90293
|
6,881 sq. feet
|
5 baths 5 beds |
show details | |

|
#29
Fredonia Dr
Los Angeles, CA 90068
|
1,564 sq. feet
|
2 baths 2 beds |
show details | |

|
#30
4th Ave
Los Angeles, CA 90008
|
1,265 sq. feet
|
1 baths 2 beds |
show details |
| Photo | Address | Area | Beds / Baths | Price | Details |
|---|---|---|---|---|---|

|
#31
W Pepper Tree Dr
Anaheim, CA 92801
|
1,160 sq. feet
|
1 baths 3 beds |
show details | |

|
#32
Leapwood Ave
Carson, CA 90746
|
1,478 sq. feet
|
2 baths 4 beds |
show details | |

|
#33
4th Ave
Los Angeles, CA 90008
|
1,392 sq. feet
|
2 baths 2 beds |
show details | |

|
#34
W 76th St
Inglewood, CA 90305
|
1,668 sq. feet
|
2 baths 3 beds |
show details | |

|
#35
Meadow Grove St
La Canada Flintridge, CA 91011
|
8,618 sq. feet
|
8 baths 7 beds |
show details | |

|
#36
N Fickett St
Los Angeles, CA 90033
|
944 sq. feet
|
2 baths 2 beds |
show details | |

|
#37
Acacia St
Los Angeles, CA 90056
|
2,186 sq. feet
|
2 baths 3 beds |
show details | |

|
#38
Faust Ave
Long Beach, CA 90808
|
1,434 sq. feet
|
2 baths 3 beds |
show details | |

|
#39
Hazelwood Ave
Los Angeles, CA 90041
|
4,755 sq. feet
|
8 baths 8 beds |
show details | |

|
#40
Bonnie Brae St
Hermosa Beach, CA 90254
|
2,471 sq. feet
|
3 baths 3 beds |
show details |
| Photo | Address | Area | Beds / Baths | Price | Details |
|---|---|---|---|---|---|

|
#41
Monterey Rd
Los Angeles, CA 90032
|
1,129 sq. feet
|
1 baths 2 beds |
show details | |

|
#42
Cortland Ave
Paramount, CA 90723
|
2,354 sq. feet
|
3 baths 4 beds |
show details | |

|
#43
Daroca Ave
San Gabriel, CA 91775
|
1,318 sq. feet
|
2 baths 2 beds |
show details | |

|
#44
Molette St
Norwalk, CA 90650
|
1,082 sq. feet
|
1 baths 4 beds |
show details | |

|
#45
Parise Dr
Whittier, CA 90604
|
1,198 sq. feet
|
2 baths 3 beds |
show details | |

|
#46
S Cochran Ave
Los Angeles, CA 90036
|
3,288 sq. feet
|
4 baths 4 beds |
show details | |

|
#47
Camulos St
Los Angeles, CA 90033
|
1,222 sq. feet
|
2 baths 4 beds |
show details | |

|
#48
N Croft Ave Apt 301
West Hollywood, CA 90069
|
1,680 sq. feet
|
2 baths 2 beds |
show details | |

|
#49
Simon St
Fullerton, CA 92833
|
3,202 sq. feet
|
2 baths 5 beds |
show details | |

|
Check over 1 million property listings on Foreclosure.com!
|
browse all offers | |||


Median year apartment built: 1944
Household type by relationship:
Households: 15,857- Male householders: 2,075 (142 living alone), Female householders: 1,662 (117 living alone)
1,977 spouses (1,970 opposite-sex spouses), 324 unmarried partners, (308 opposite-sex unmarried partners), 5,637 children (5,389 natural, 41 adopted, 206 stepchildren), 1,121 grandchildren, 377 brothers or sisters, 545 parents, 0 foster children, 1,061 other relatives, 1,063 non-relatives
- In group quarters: 10
Size of family households: 625 2-persons, 704 3-persons, 695 4-persons, 510 5-persons, 331 6-persons, 409 7-or-more-persons.
Size of nonfamily households: 279 1-person, 147 2-persons, 42 3-persons, 7 4-persons, 10 5-persons, 45 7-or-more-persons.
1,762 married couples with children.
917 single-parent households (261 men, 656 women).
11.6% of residents of Walnut Park speak English at home.
87.0% of residents speak Spanish at home (49% speak English very well, 19% speak English well, 21% speak English not well, 10% don't speak English at all).
0.2% of residents speak other Indo-European language at home (35% speak English very well, 50% speak English well, 15% speak English not well).
0.5% of residents speak Asian or Pacific Island language at home (92% speak English very well, 8% speak English well).
0.1% of residents speak other language at home (100% speak English very well).
Foreign born population: 7,085 (44.7%)
(42.1% of them are naturalized citizens)
| Here: | 5.3 |
| State: | 6.0 |
| Here: | 3.8 |
| State: | 3.9 |

- Bedrooms in owner-occupied houses and condos in Walnut Park, California
- 52no bedroom
- 181 bedroom
- 7152 bedrooms
- 8433 bedrooms
- 3264 bedrooms
- 735+ bedrooms

- Bedrooms in renter-occupied apartments in Walnut Park, California
- 272no bedroom
- 5961 bedroom
- 6922 bedrooms
- 1523 bedrooms
- 1414 bedrooms
- 05+ bedrooms

- Cars and other vehicles available in Walnut Park in owner-occupied houses/condos
- 105no vehicle
- 2121 vehicle
- 6312 vehicles
- 6693 vehicles
- 2104 vehicles
- 2005+ vehicles

- Cars and other vehicles available in Walnut Park in renter-occupied apartments
- 198no vehicle
- 6661 vehicle
- 6482 vehicles
- 1963 vehicles
- 544 vehicles
- 915+ vehicles

- Rooms in owner-occupied houses in Walnut Park, California
- 01 room
- 332 rooms
- 843 rooms
- 3174 rooms
- 6195 rooms
- 4796 rooms
- 2387 rooms
- 1418 rooms
- 1179+ rooms

- Rooms in renter-occupied apartments in Walnut Park, California
- 2621 room
- 902 rooms
- 4403 rooms
- 5064 rooms
- 2845 rooms
- 1656 rooms
- 927 rooms
- 148 rooms
- 09+ rooms


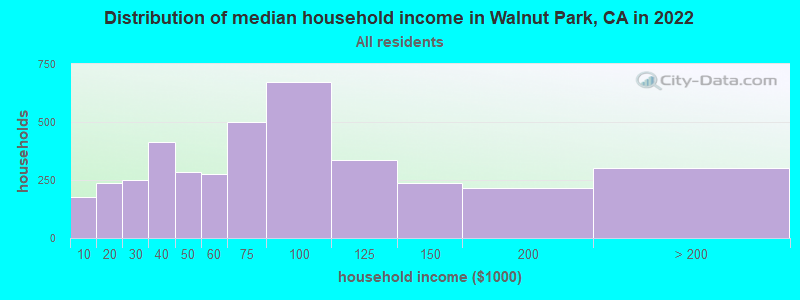
Walnut Park, CA household income distribution

- 178Less than $10,000
- 238$10,000 to $19,999
- 248$20,000 to $29,999
- 414$30,000 to $39,999
- 285$40,000 to $49,999
- 276$50,000 to $59,999
- 500$60,000 to $74,999
- 671$75,000 to $99,999
- 335$100,000 to $124,999
- 236$125,000 to $149,999
- 216$150,000 to $199,999
- 300$200,000 or more
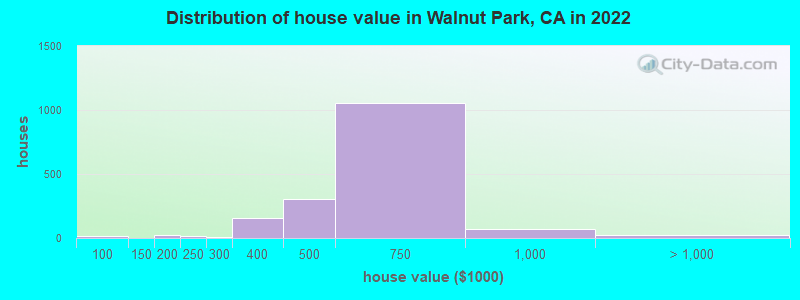
Home value of owner - occupied houses in 2022 in Walnut Park, CA
-
- 8Less than $10,000
- 13$60,000 to $69,999
- 4$70,000 to $79,999
- 23$175,000 to $199,999
- 18$200,000 to $249,999
- 3$250,000 to $299,999
- 154$300,000 to $399,999
- 301$400,000 to $499,999
- 1,056$500,000 to $749,999
- 71$750,000 to $999,999
- 9$1,000,000 to $1,499,999
- 15$2,000,000 or more
Rent paid by renters in 2022 in Walnut Park, CA
-
- 12$350 to $399
- 30$400 to $449
- 19$450 to $499
- 25$500 to $549
- 11$550 to $599
- 19$600 to $649
- 5$650 to $699
- 42$700 to $749
- 6$750 to $799
- 100$800 to $899
- 190$900 to $999
- 506$1,000 to $1,249
- 337$1,250 to $1,499
- 280$1,500 to $1,999
- 192$2,000 to $2,499
- 75No cash rent

Percentage of workers working in this county: 95.7%
Number of people working at home: 509 (7.2% of all workers)
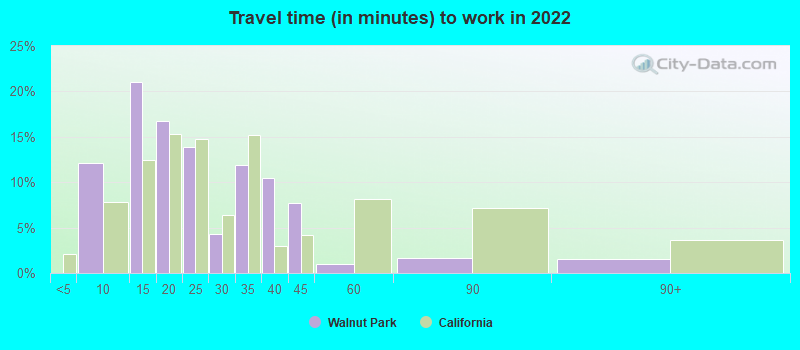
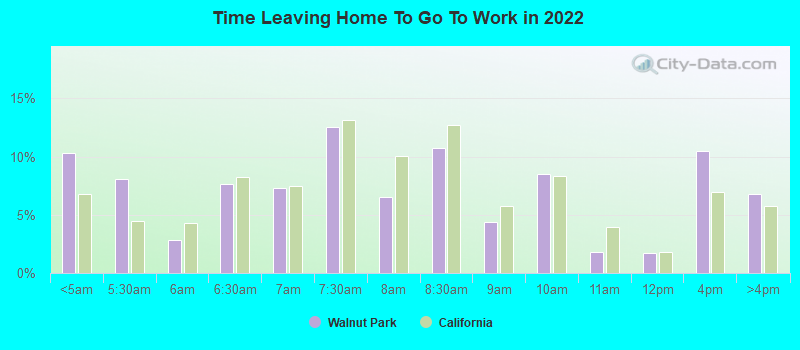
Travel time to work (commute)
- Less than 5 minutes: 112
- 5 to 9 minutes: 279
- 10 to 14 minutes: 543
- 15 to 19 minutes: 636
- 20 to 24 minutes: 609
- 25 to 29 minutes: 299
- 30 to 34 minutes: 1,175
- 35 to 39 minutes: 299
- 40 to 44 minutes: 623
- 45 to 59 minutes: 870
- 60 to 89 minutes: 668
- 90 or more minutes: 232
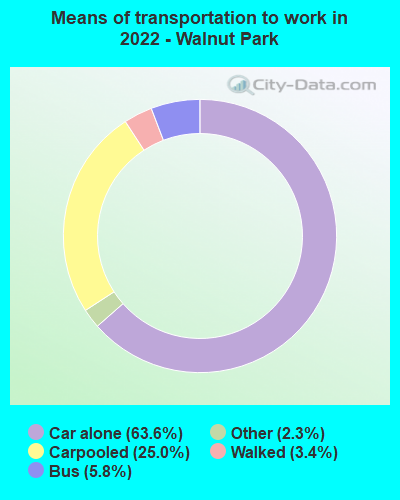
Means of transportation to work:
- Drove a car alone: 428 (38.7%)
- Carpooled: 186 (16.8%)
- Bus: 35 (3.2%)
- Taxi: 16 (1.4%)
- Walked: 24 (2.2%)
- Worked at home: 509 (46.1%)
- Unemployment by race in 2022
- Unemployment rate for White non-Hispanic residents
- 22.8%Males
- Unemployment rate for Black residents
- 100.0%Males
- Unemployment rate for American Indian and Alaska Native residents
- 22.8%Females
- Unemployment rate for other race residents
- 10.5%Males
- 4.5%Females
- Unemployment rate for two or more race residents
- 9.7%Males
- 1.5%Females
- Unemployment rate for Hispanic or Latino residents
- 9.7%Males
- 4.9%Females

- Year of entry for the foreign-born population in Walnut Park, California
- 4382010 or later
- 1,2592000 to 2009
- 1,5191990 to 1999
- 2,8141980 to 1989
- 2,1271970 to 1979
- 1,249Before 1970

First ancestries reported:
- American: 27 (0.2%)
- English: 25 (0.2%)
- Italian: 23 (0.2%)
- German: 16 (0.1%)
- Greek: 5 (0.04%)
Most common places of birth for foreign-born residents (%):
| Walnut Park: | 75.7% (5,360) |
| California: | 37.2% (3,881,193) |
| Walnut Park: | 11.2% (795) |
| California: | 4.2% (440,287) |
| Walnut Park: | 4.6% (324) |
| California: | 2.8% (290,436) |
| Walnut Park: | 2.8% (198) |
| California: | 0.7% (74,025) |
Place of birth for U.S.-born residents:
- This state: 8,357
- Other state: 296
- Northeast: 2
- Midwest: 43
- South: 127
- West: 115
95.8% of Walnut Park residents lived in the same house 1 years ago.
Out of people who lived in different houses, 42.2% lived in this county.
Out of people who lived in different counties, 94.4% lived in California.
| Walnut Park: | 95.8% |
| State average: | 88.9% |
Education attainment for males 25 years and older:
- No schooling: 479
- Nursery to 4th grade: 305
- 5th and 6th grade: 551
- 7th and 8th grade: 81
- 9th grade: 351
- 10th grade: 160
- 11th grade: 234
- 12th grade, no diploma: 110
- High school graduate (or equivalency): 1,508
- Less than 1 year of college: 294
- Some college more than 1 year, no degree: 455
- Associate degree: 274
- Bachelor's degree: 502
- Master's degree: 26
- Professional school degree: 10
- Doctorate degree: 21

Education attainment for females 25 years and older:
- No schooling: 384
- Nursery to 4th grade: 451
- 5th and 6th grade: 570
- 7th and 8th grade: 170
- 9th grade: 347
- 10th grade: 197
- 11th grade: 123
- 12th grade, no diploma: 183
- High school graduate (or equivalency): 1,296
- Less than 1 year of college: 250
- Some college more than 1 year, no degree: 413
- Associate degree: 187
- Bachelor's degree: 318
- Master's degree: 110
- Professional school degree: 41
- Doctorate degree: 0


Housing units in structures:
- One, detached: 2,729
- One, attached: 300
- Two: 321
- 3 or 4: 340
- 5 to 9: 112
- 10 to 19: 14
- 20 to 49: 50
- 50 or more: 35
- Mobile homes: 29
- Boats, RVs, vans, etc.: 12
Housing units lacking complete kitchen facilities in 2022: 1.8%
House/condo owner moved in on average 24 years ago
Renter moved in on average 7 years ago

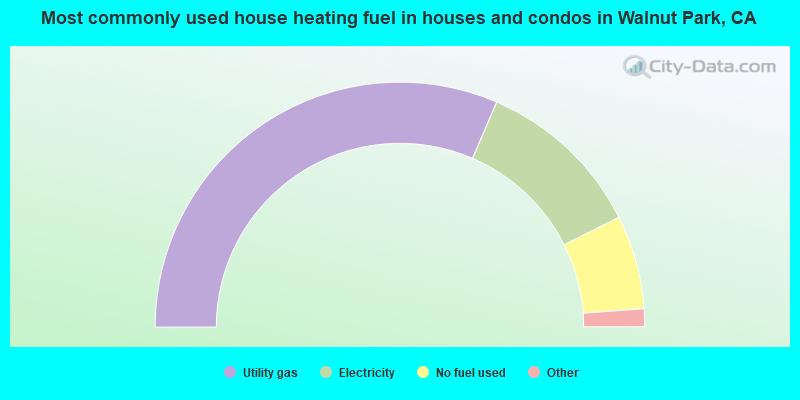
- 63.0%Utility gas
- 22.3%Electricity
- 12.4%No fuel used
- 1.2%Bottled, tank, or LP gas
- 1.2%Other fuel
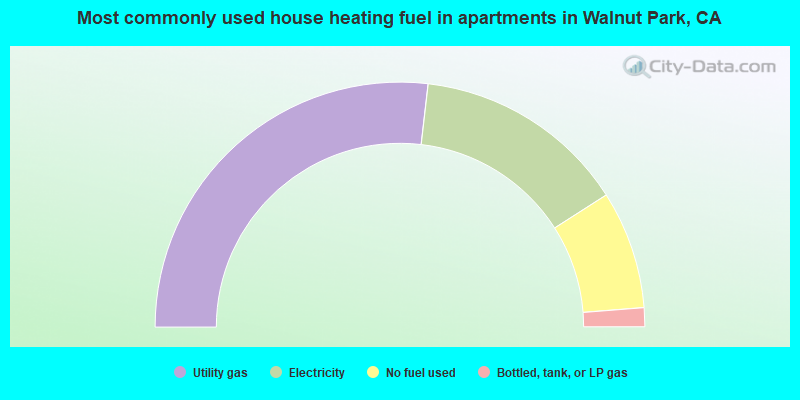
- 53.7%Utility gas
- 28.2%Electricity
- 15.6%No fuel used
- 2.5%Bottled, tank, or LP gas
Private vs. public school enrollment:
| Here: | 4.8% |
| California: | 10.5% |
| Here: | 8.7% |
| California: | 8.5% |
| Here: | 18.7% |
| California: | 15.9% |


