Waterville, ME (Maine) Houses and Residents
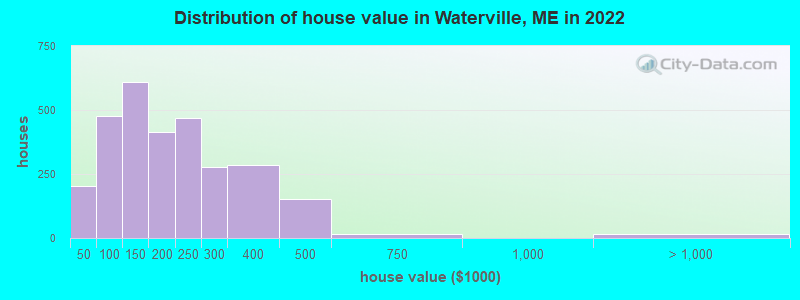
Estimated median house or condo value in 2022: $178,226 (it was $76,200 in 2000 )
Waterville:
$178,226Maine:
$290,600
Lower value quartile - upper value quartile: $118,761 - $275,409Mean price in 2022: Detached houses: $215,501 Here:
$215,501State:
$364,324
Townhouses or other attached units: $295,383 Here:
$295,383State:
$496,775
In 2-unit structures: $128,920 Here:
$128,920State:
$349,654
In 3-to-4-unit structures: $139,441 Here:
$139,441State:
$366,418
In 5-or-more-unit structures: $85,013 Here:
$85,013State:
$342,001
Mobile homes: $66,196 Here:
$66,196State:
$142,980
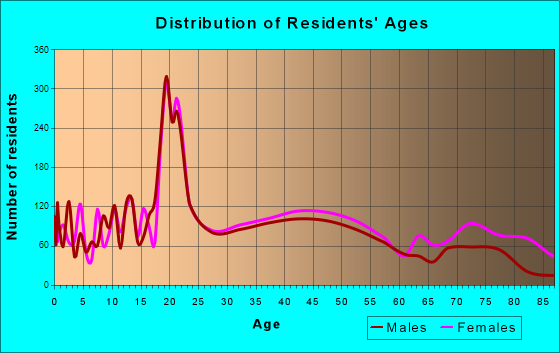
Total population: 16,182 (Urban population: 13,977 (all inside urban clusters), Rural population: 1,628 (all nonfarm) )
Houses: 6,763 (6,437 occupied: 3,004 owner occupied, 3,499 renter occupied )
% of renters here:
54%State:
26%
Housing density: 498 houses/condos per square mile
Median price asked for vacant for-sale houses and condos in 2022: $92,044.
Median contract rent in 2022: $897 (lower quartile is $661, upper quartile is $1,047)
Median rent asked for vacant for-rent units in 2022: $911
Median gross rent in Waterville, ME in 2022: $928
Housing units in Waterville with a mortgage: 1,645 (186 second mortgage, 24 home equity loan, 169 both second mortgage and home equity loan )Houses without a mortgage: 99
Median household income for houses/condos with a mortgage: $90,749
Median household income for apartments without a mortgage: $50,322
Median monthly housing costs: $892
Data:
Median house or condo value ($)
Median house or condo value ($ change since 2000)
Median house or condo value ($) - White
Median house or condo value ($) - Black or African American
Median house or condo value ($) - Asian
Median house or condo value ($) - Hispanic or Latino
Median house or condo value ($) - American Indian and Alaska Native
Median house or condo value ($) - Multirace
Median house or condo value ($) - Other Race
Median price asked for mobile homes ($)
Household density (households per square mile)
Mean house or condo value by units in structure - 1, detached ($)
Mean house or condo value by units in structure - 1, attached ($)
Mean house or condo value by units in structure - 2 ($)
Mean house or condo value by units in structure by units in structure - 3 or 4 ($)
Mean house or condo value by units in structure - 5 or more ($)
Mean house or condo value by units in structure - Boat, RV, van, etc. ($)
Mean house or condo value by units in structure - Mobile home ($)
Median contract rent ($)
Median contract rent - Lower quartile ($)
Median contract rent - Upper quartile ($)
Median gross rent ($)
Urban houses (%)
Rural houses (%)
Houses occupied (%)
Houses occupied (% change since 2000)
Houses owner occupied (%)
Houses owner occupied (% change since 2000)
Houses renter occupied (%)
Houses renter occupied (% change since 2000)
Vacant housing units - For rent (%)
Vacant housing units - For rent (% change since 2000)
Vacant housing units - For sale only (%)
Vacant housing units - For sale only (% change since 2000)
Vacant housing units - Rented or sold, not occupied (%)
Vacant housing units - Rented or sold, not occupied (% change since 2000)
Vacant housing units - For seasonal, recreational, or occasional use (%)
Vacant housing units - For seasonal, recreational, or occasional use (% change since 2000)
Vacant housing units - For migrant workers (%)
Vacant housing units - For migrant workers (% change since 2000)
Vacant housing units - Other vacant (%)
Vacant housing units - Other vacant (% change since 2000)
Median monthly housing costs ($)
Median household income for houses/condos with a mortgage ($)
Median household income for houses/condos without a mortgage ($)
Median household income ($)
Median household income ($) - White
Median household income ($) - Black or African American
Median household income ($) - Asian
Median household income ($) - Hispanic or Latino
Median household income ($) - American Indian and Alaska Native
Median household income ($) - Multirace
Median household income ($) - Other Race
Mortgage status - with mortgage (%)
Mortgage status - with second mortgage (%)
Mortgage status - with home equity loan (%)
Mortgage status - with both second mortgage and home equity loan (%)
Mortgage status - without a mortgage (%)
Median year house/condo built
Median year apartment built
Household type by relationship - Male householder living alone (%)
Household type by relationship - Male householder not living alone (%)
Household type by relationship - Female householder living alone (%)
Household type by relationship - Female householder not living alone (%)
Household type by relationship - Opposite-Sex spouse (%)
Household type by relationship - Same-Sex spouse (%)
Household type by relationship - Opposite-Sex unmarried partner (%)
Household type by relationship - Same-Sex unmarried partner (%)
Household type by relationship - In group quarters (%)
Size of family households - 2-person household (%)
Size of family households - 3-person household (%)
Size of family households - 4-person household (%)
Size of family households - 5-person household (%)
Size of family households - 6-person household (%)
Size of family households - 7-or-more-person household (%)
Size of nonfamily households - 1-person household (%)
Size of nonfamily households - 2-person household (%)
Size of nonfamily households - 3-person household (%)
Size of nonfamily households - 4-person household (%)
Size of nonfamily households - 5-person household (%)
Size of nonfamily households - 6-person household (%)
Size of nonfamily households - 7-or-moreperson household (%)
Year house built - Built 2010 or later (%)
Year house built - Built 2000 to 2009 (%)
Year house built - Built 1990 to 1999 (%)
Year house built - Built 1980 to 1989 (%)
Year house built - Built 1970 to 1979 (%)
Year house built - Built 1960 to 1969 (%)
Year house built - Built 1950 to 1959 (%)
Year house built - Built 1940 to 1949 (%)
Year house built - Built 1939 or earlier (%)
Median number of rooms in houses and condos
Median number of rooms in apartments
Median number of bedrooms in owner occupied houses
Mean number of bedrooms in owner occupied houses
Median number of bedrooms in renter occupied houses
Mean number of bedrooms in renter occupied houses
Median number of vehichles in owner occupied houses
Mean number of vehichles in owner occupied houses
Median number of vehichles in renter occupied houses
Mean number of vehichles in renter occupied houses
Rooms in owner-occupied houses - 1 room (%)
Rooms in owner-occupied houses - 2 rooms (%)
Rooms in owner-occupied houses - 3 rooms (%)
Rooms in owner-occupied houses - 4 rooms (%)
Rooms in owner-occupied houses - 5 rooms (%)
Rooms in owner-occupied houses - 6 rooms (%)
Rooms in owner-occupied houses - 7 rooms (%)
Rooms in owner-occupied houses - 8 rooms (%)
Rooms in owner-occupied houses - 9+ rooms (%)
Rooms in renter-occupied houses - 1 room (%)
Rooms in renter-occupied houses - 2 rooms (%)
Rooms in renter-occupied houses - 3 rooms (%)
Rooms in renter-occupied houses - 4 rooms (%)
Rooms in renter-occupied houses - 5 rooms (%)
Rooms in renter-occupied houses - 6 rooms (%)
Rooms in renter-occupied houses - 7 rooms (%)
Rooms in renter-occupied houses - 8 rooms (%)
Rooms in renter-occupied houses - 9+ rooms (%)
Bedrooms in owner-occupied houses - no bedrooms (%)
Bedrooms in owner-occupied houses - 1 bedroom (%)
Bedrooms in owner-occupied houses - 2 bedrooms (%)
Bedrooms in owner-occupied houses - 3 bedrooms (%)
Bedrooms in owner-occupied houses - 4 bedrooms (%)
Bedrooms in owner-occupied houses - 5+ bedrooms (%)
Bedrooms in renter-occupied houses - no bedrooms (%)
Bedrooms in renter-occupied houses - 1 bedroom (%)
Bedrooms in renter-occupied houses - 2 bedrooms (%)
Bedrooms in renter-occupied houses - 3 bedrooms (%)
Bedrooms in renter-occupied houses - 4 bedrooms (%)
Bedrooms in renter-occupied houses - 5+ bedrooms (%)
Vehicles available in owner-occupied houses - no vehicle available (%)
Vehicles available in owner-occupied houses - 1 vehicle available(%)
Vehicles available in owner-occupied houses - 2 Vehicles available (%)
Vehicles available in owner-occupied houses - 3 Vehicles available (%)
Vehicles available in owner-occupied houses - 4 Vehicles available (%)
Vehicles available in owner-occupied houses - 5+ Vehicles available (%)
Vehicles available in renter-occupied houses - no vehicle available (%)
Vehicles available in renter-occupied houses - 1 vehicle available (%)
Vehicles available in renter-occupied houses - 2 Vehicles available (%)
Vehicles available in renter-occupied houses - 3 Vehicles available (%)
Vehicles available in renter-occupied houses - 4 Vehicles available (%)
Vehicles available in renter-occupied houses - 5+ Vehicles available (%)
Housing units in structures - 1, detached (%)
Housing units in structures - 1, attached (%)
Housing units in structures - 2 (%)
Housing units in structures - 3 or 4 (%)
Housing units in structures - 5 to 9 (%)
Housing units in structures - 10 to 19 (%)
Housing units in structures - 20 to 49 (%)
Housing units in structures - 50 or more (%)
Housing units in structures - Mobile home (%)
Housing units in structures - Boat, RV, van, etc. (%)
Housing units in structures - Owners - 1, detached (%)
Housing units in structures - Owners - 1, attached (%)
Housing units in structures - Owners - 2 (%)
Housing units in structures - Owners - 3 or 4 (%)
Housing units in structures - Owners - 5 to 9 (%)
Housing units in structures - Owners - 10 to 19 (%)
Housing units in structures - Owners - 20 to 49 (%)
Housing units in structures - Owners - 50 or more (%)
Housing units in structures - Owners - Mobile home (%)
Housing units in structures - Owners - Boat, RV, van, etc. (%)
Housing units in structures - Renters - 1, detached (%)
Housing units in structures - Renters - 1, attached (%)
Housing units in structures - Renters - 2 (%)
Housing units in structures - Renters - 3 or 4 (%)
Housing units in structures - Renters - 5 to 9 (%)
Housing units in structures - Renters - 10 to 19 (%)
Housing units in structures - Renters - 20 to 49 (%)
Housing units in structures - Renters - 50 or more (%)
Housing units in structures - Renters - Mobile home (%)
Housing units in structures - Renters - Boat, RV, van, etc. (%)
House/condo owner moved in on average (years ago)
Renter moved in on average (years ago)
Year householder moved into unit - Moved in 1999 to March 2000 (%)
Year householder moved into unit - Moved in 1999 to March 2000 (%) - White
Year householder moved into unit - Moved in 1999 to March 2000 (%) - Black or African American
Year householder moved into unit - Moved in 1999 to March 2000 (%) - Asian
Year householder moved into unit - Moved in 1999 to March 2000 (%) - Hispanic or Latino
Year householder moved into unit - Moved in 1999 to March 2000 (%) - American Indian and Alaska Native
Year householder moved into unit - Moved in 1999 to March 2000 (%) - Multirace
Year householder moved into unit - Moved in 1999 to March 2000 (%) - Other Race
Year householder moved into unit - Moved in 1995 to 1998 (%)
Year householder moved into unit - Moved in 1995 to 1998 (%) - White
Year householder moved into unit - Moved in 1995 to 1998 (%) - Black or African American
Year householder moved into unit - Moved in 1995 to 1998 (%) - Asian
Year householder moved into unit - Moved in 1995 to 1998 (%) - Hispanic or Latino
Year householder moved into unit - Moved in 1995 to 1998 (%) - American Indian and Alaska Native
Year householder moved into unit - Moved in 1995 to 1998 (%) - Multirace
Year householder moved into unit - Moved in 1995 to 1998 (%) - Other Race
Year householder moved into unit - Moved in 1990 to 1994 (%)
Year householder moved into unit - Moved in 1990 to 1994 (%) - White
Year householder moved into unit - Moved in 1990 to 1994 (%) - Black or African American
Year householder moved into unit - Moved in 1990 to 1994 (%) - Asian
Year householder moved into unit - Moved in 1990 to 1994 (%) - Hispanic or Latino
Year householder moved into unit - Moved in 1990 to 1994 (%) - American Indian and Alaska Native
Year householder moved into unit - Moved in 1990 to 1994 (%) - Multirace
Year householder moved into unit - Moved in 1990 to 1994 (%) - Other Race
Year householder moved into unit - Moved in 1980 to 1989 (%)
Year householder moved into unit - Moved in 1980 to 1989 (%) - White
Year householder moved into unit - Moved in 1980 to 1989 (%) - Black or African American
Year householder moved into unit - Moved in 1980 to 1989 (%) - Asian
Year householder moved into unit - Moved in 1980 to 1989 (%) - Hispanic or Latino
Year householder moved into unit - Moved in 1980 to 1989 (%) - American Indian and Alaska Native
Year householder moved into unit - Moved in 1980 to 1989 (%) - Multirace
Year householder moved into unit - Moved in 1980 to 1989 (%) - Other Race
Year householder moved into unit - Moved in 1970 to 1979 (%)
Year householder moved into unit - Moved in 1970 to 1979 (%) - White
Year householder moved into unit - Moved in 1970 to 1979 (%) - Black or African American
Year householder moved into unit - Moved in 1970 to 1979 (%) - Asian
Year householder moved into unit - Moved in 1970 to 1979 (%) - Hispanic or Latino
Year householder moved into unit - Moved in 1970 to 1979 (%) - American Indian and Alaska Native
Year householder moved into unit - Moved in 1970 to 1979 (%) - Multirace
Year householder moved into unit - Moved in 1970 to 1979 (%) - Other Race
Year householder moved into unit - Moved in 1969 or earlier (%)
Year householder moved into unit - Moved in 1969 or earlier (%) - White
Year householder moved into unit - Moved in 1969 or earlier (%) - Black or African American
Year householder moved into unit - Moved in 1969 or earlier (%) - Asian
Year householder moved into unit - Moved in 1969 or earlier (%) - Hispanic or Latino
Year householder moved into unit - Moved in 1969 or earlier (%) - American Indian and Alaska Native
Year householder moved into unit - Moved in 1969 or earlier (%) - Multirace
Year householder moved into unit - Moved in 1969 or earlier (%) - Other Race
Housing units lacking complete plumbing facilities (%)
Housing units lacking complete kitchen facilities (%)
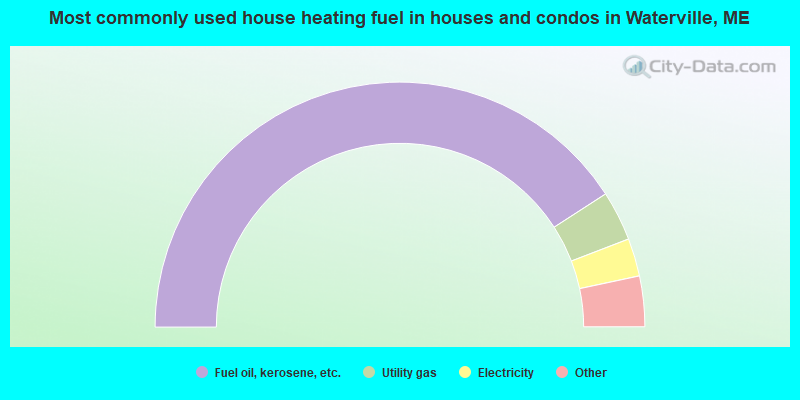
House heating fuel used in houses and condos - Utility gas (%)
House heating fuel used in houses and condos - Bottled, tank, or LP gas (%)
House heating fuel used in houses and condos - Electricity (%)
House heating fuel used in houses and condos - Fuel oil, kerosene, etc. (%)
House heating fuel used in houses and condos - Coal or coke (%)
House heating fuel used in houses and condos - Wood (%)
House heating fuel used in houses and condos - Solar energy (%)
House heating fuel used in houses and condos - Other fuel (%)
House heating fuel used in houses and condos - No fuel used (%)
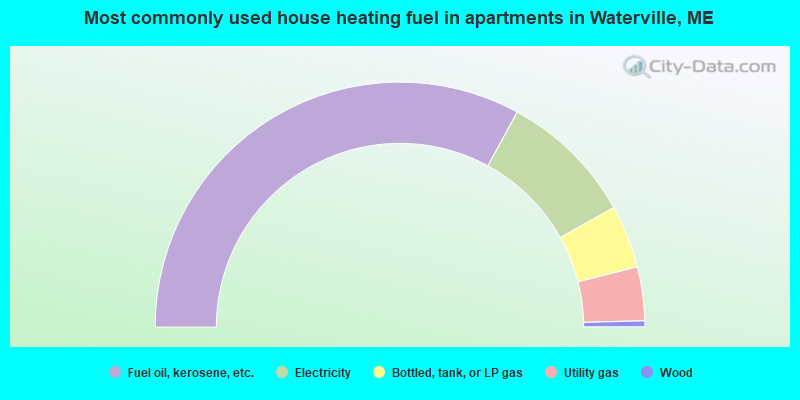
House heating fuel used in apartments - Utility gas (%)
House heating fuel used in apartments - Bottled, tank, or LP gas (%)
House heating fuel used in apartments - Electricity (%)
House heating fuel used in apartments - Fuel oil, kerosene, etc. (%)
House heating fuel used in apartments - Coal or coke (%)
House heating fuel used in apartments - Wood (%)
House heating fuel used in apartments - Solar energy (%)
House heating fuel used in apartments - Other fuel (%)
House heating fuel used in apartments - No fuel used (%)
Latest news about housing in Waterville, ME collected exclusively by city-data.com from local newspapers, TV, and radio stations
Median year house/condo built: 1954Median year apartment built: 1958Household type by relationship:
Households: 15,980
Male householders: 2,961 (1,201 living alone ), Female householders: 3,483 (1,426 living alone )2,039 spouses (2,013 opposite-sex spouses ), 601 unmarried partners , (601 opposite-sex unmarried partners ), 3,410 children (3,209 natural , 19 adopted , 182 stepchildren ), 282 grandchildren , 139 brothers or sisters , 61 parents , 0 foster children , 110 other relatives , 590 non-relatives In group quarters: 2,299
Size of family households: 1,635 2-persons , 678 3-persons , 571 4-persons , 163 5-persons , 70 6-persons , 27 7-or-more-persons .
Size of nonfamily households: 2,805 1-person , 461 2-persons , 83 3-persons , 54 4-persons .
1,209 married couples with children. single-parent households (628 men , 946 women ).
92.9% of residents of Waterville speak English at home. of residents speak Spanish at home (80% speak English very well , 20% speak English well ).of residents speak other Indo-European language at home (87% speak English very well , 10% speak English well , 3% speak English not well ).of residents speak Asian or Pacific Island language at home (63% speak English very well , 35% speak English well , 2% speak English not well ).of residents speak other language at home (100% speak English very well ).
Foreign born population: 832 (5.2%)of them are naturalized citizens )
Median number of rooms in houses and condos:
Median number of rooms in apartments
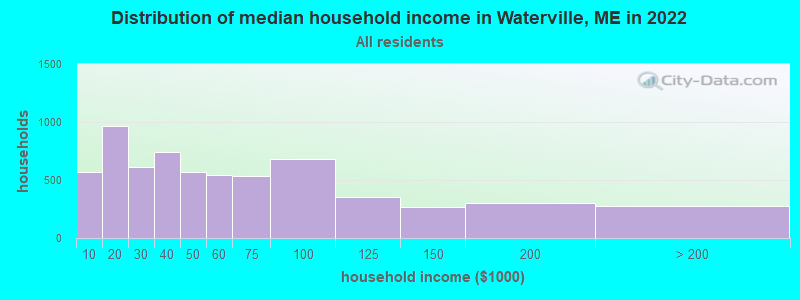
Waterville, ME household income distribution 571 Less than $10,000964 $10,000 to $19,999608 $20,000 to $29,999743 $30,000 to $39,999573 $40,000 to $49,999544 $50,000 to $59,999532 $60,000 to $74,999684 $75,000 to $99,999355 $100,000 to $124,999263 $125,000 to $149,999302 $150,000 to $199,999280 $200,000 or more
Home value of owner - occupied houses in 2022 in Waterville, ME 3 $15,000 to $19,99985 $20,000 to $24,99935 $25,000 to $29,99976 $40,000 to $49,99932 $50,000 to $59,99991 $60,000 to $69,99969 $70,000 to $79,999155 $80,000 to $89,99949 $90,000 to $99,999398 $100,000 to $124,999210 $125,000 to $149,999195 $150,000 to $174,999218 $175,000 to $199,999467 $200,000 to $249,999276 $250,000 to $299,999286 $300,000 to $399,999153 $400,000 to $499,99915 $500,000 to $749,9999 $1,000,000 to $1,499,9995 $2,000,000 or moreRent paid by renters in 2022 in Waterville, ME 30 Less than $10050 $200 to $249100 $250 to $29929 $300 to $349207 $350 to $399161 $400 to $449113 $450 to $49950 $500 to $549118 $550 to $59972 $600 to $649127 $650 to $699124 $700 to $749234 $750 to $799604 $800 to $899632 $900 to $999456 $1,000 to $1,249270 $1,250 to $1,499118 $1,500 to $1,99920 $3,500 or more81 No cash rent
Percentage of workers working in this county: 88.9%Number of people working at home: 1,031 (15.1% of all workers )
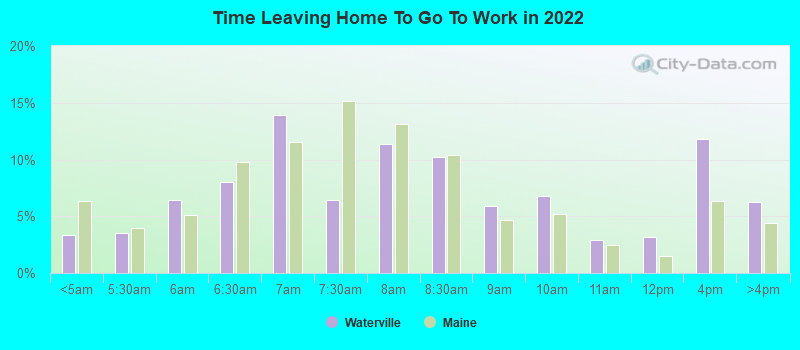
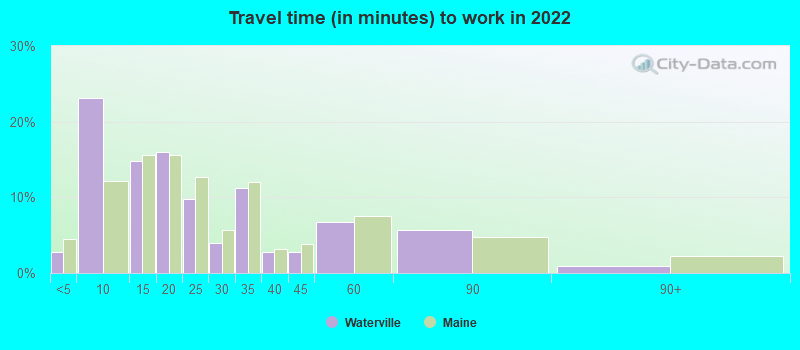
Travel time to work (commute)
Less than 5 minutes: 2415 to 9 minutes: 1,74410 to 14 minutes: 1,14015 to 19 minutes: 52020 to 24 minutes: 42525 to 29 minutes: 21130 to 34 minutes: 48835 to 39 minutes: 19340 to 44 minutes: 6645 to 59 minutes: 17360 to 89 minutes: 25190 or more minutes: 23
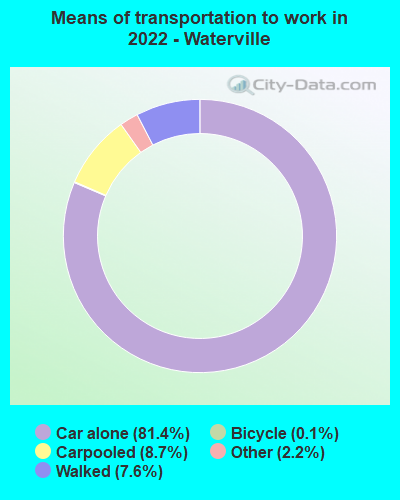
Means of transportation to work:
Drove a car alone: 8,992 (72.4%)Carpooled: 939 (7.6%)Bus : 7 (0.1%)Taxi: 338 (2.7%)Bicycle: 23 (0.2%)Walked: 912 (7.3%)Worked at home: 1,031 (8.3%)
Unemployment by race in 2022
Unemployment rate for White non-Hispanic residents 6.0% Males2.1% FemalesUnemployment rate for Black residents 4.1% FemalesUnemployment rate for American Indian and Alaska Native residents 11.3% MalesUnemployment rate for two or more race residents 17.7% Females
Year of entry for the foreign-born population in Waterville, Maine
441 2010 or later 100 2000 to 2009 83 1990 to 1999 80 1980 to 1989 100 1970 to 1979 220 Before 1970
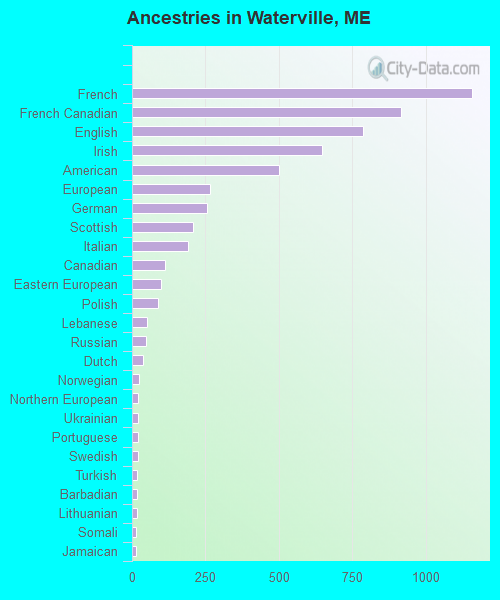
First ancestries reported:
French: 1,157 (17.4%)
French Canadian: 915 (13.8%)
English: 787 (11.8%)
Irish: 645 (9.7%)
American: 501 (7.5%)
European: 265 (4.0%)
German: 255 (3.8%)
Scottish: 208 (3.1%)
Italian: 191 (2.9%)
Canadian: 112 (1.7%)
Eastern European: 98 (1.5%)
Polish: 90 (1.4%)
Lebanese: 50 (0.8%)
Russian: 48 (0.7%)
Dutch: 37 (0.6%)
Norwegian: 25 (0.4%)
Northern European: 22 (0.3%)
Ukrainian: 22 (0.3%)
Portuguese: 19 (0.3%)
Swedish: 19 (0.3%)
Turkish: 18 (0.3%)
Barbadian: 17 (0.3%)
Lithuanian: 16 (0.2%)
Somali: 13 (0.2%)
Jamaican: 12 (0.2%)
Finnish: 10 (0.2%)
Welsh: 8 (0.1%)
Scotch-Irish: 5 (0.08%)
African: 3 (0.05%) Most common places of birth for foreign-born residents (%): China, excluding Hong Kong and Taiwan Waterville:
25.9% (192)Maine:
4.6% (2,392)
Canada Waterville:
13.7% (102)Maine:
18.9% (9,810)
England Waterville:
6.7% (50)Maine:
3.1% (1,593)
Taiwan Waterville:
5.9% (44)Maine:
0.8% (434)
Philippines Waterville:
5.7% (42)Maine:
4.0% (2,054)
Vietnam Waterville:
4.7% (35)Maine:
2.0% (1,031)
Italy Waterville:
3.6% (27)Maine:
0.7% (349)
Germany Waterville:
3.4% (25)Maine:
3.9% (2,005)
Korea Waterville:
3.2% (24)Maine:
2.2% (1,146)
India Waterville:
2.7% (20)Maine:
2.0% (1,031)
Brazil Waterville:
2.7% (20)Maine:
1.1% (549)
Turkey Waterville:
2.4% (18)Maine:
0.4% (189)
Netherlands Waterville:
1.9% (14)Maine:
0.7% (371)
El Salvador Waterville:
1.8% (13)Maine:
0.4% (215)
Mexico Waterville:
1.8% (13)Maine:
1.6% (841)
Jamaica Waterville:
1.6% (12)Maine:
1.8% (912)
Place of birth for U.S.-born residents:
This state: 9,803Other state: 5,417Northeast: 3,094Midwest: 835South: 902West: 607 75.6% of Waterville residents lived in the same house 1 years ago.
Out of people who lived in different houses, 35.4% lived in this county.
Out of people who lived in different counties, 39.5% lived in Maine.
Waterville:
75.6%State average:
89.7%
Education attainment for males 25 years and older:
No schooling: 90Nursery to 4th grade: 235th and 6th grade: 657th and 8th grade: 189th grade: 8510th grade: 3311th grade: 3012th grade, no diploma: 102High school graduate (or equivalency): 1,149Less than 1 year of college: 244Some college more than 1 year, no degree: 580Associate degree: 509Bachelor's degree: 748Master's degree: 193Professional school degree: 257Doctorate degree: 299
Education attainment for females 25 years and older:
No schooling: 17Nursery to 4th grade: 05th and 6th grade: 27th and 8th grade: 809th grade: 5010th grade: 2611th grade: 14812th grade, no diploma: 49High school graduate (or equivalency): 1,711Less than 1 year of college: 472Some college more than 1 year, no degree: 808Associate degree: 450Bachelor's degree: 888Master's degree: 402Professional school degree: 38Doctorate degree: 183
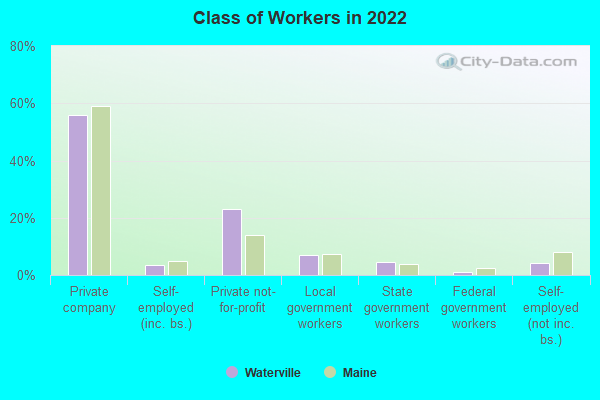
Housing units in structures:
One, detached: 2,681One, attached: 128Two: 1,4363 or 4: 7845 to 9: 59910 to 19: 22320 to 49: 56050 or more: 79Mobile homes: 269Median worth of mobile homes: $104,455
Housing units lacking complete plumbing facilities in 2022: 1.0%Housing units lacking complete kitchen facilities in 2022: 2.7%House/condo owner moved in on average 12 years ago
Renter moved in on average 1 years ago
Private vs. public school enrollment:
Students in private schools in grades 1 to 8 (elementary and middle school): 197 Students in private schools in grades 9 to 12 (high school): 76 Students in private undergraduate colleges: 2,051