West Allis, WI (Wisconsin) Houses and Residents
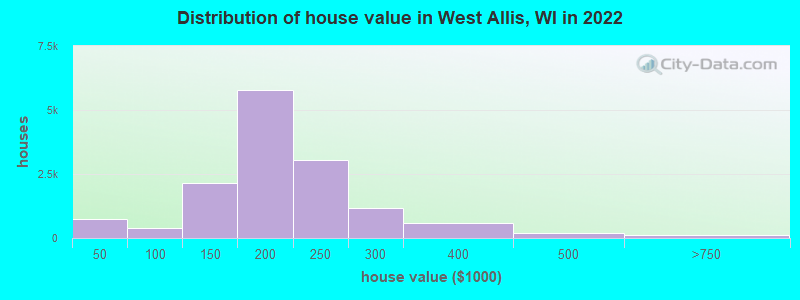
Estimated median house or condo value in 2022: $190,980 (it was $99,600 in 2000 )
West Allis:
$190,980Wisconsin:
$252,800
Lower value quartile - upper value quartile: $162,188 - $233,637Mean price in 2022: Detached houses: $210,386 Here:
$210,386State:
$308,468
Townhouses or other attached units: $184,838 Here:
$184,838State:
$265,873
In 2-unit structures: $194,802 Here:
$194,802State:
$203,667
In 3-to-4-unit structures: $385,568 Here:
$385,568State:
$216,833
In 5-or-more-unit structures: $113,432 Here:
$113,432State:
$280,537
Mobile homes: $25,671 Here:
$25,671State:
$79,042
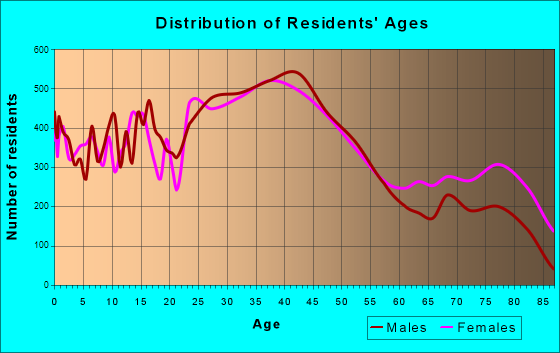
Total population: 60,624 (All urban)
Houses: 29,536 (27,613 occupied: 14,544 owner occupied, 13,015 renter occupied )
% of renters here:
47%State:
32%
Housing density: 2,603 houses/condos per square mile
Median price asked for vacant for-sale houses and condos in 2022: $240,394.
Median contract rent in 2022: $819 (lower quartile is $639, upper quartile is $1,066)
Median rent asked for vacant for-rent units in 2022: $953
Median gross rent in West Allis, WI in 2022: $954
Housing units in West Allis with a mortgage: 10,010 (1,102 second mortgage, 37 home equity loan, 973 both second mortgage and home equity loan )Houses without a mortgage: 789
Median household income for houses/condos with a mortgage: $86,864
Median household income for apartments without a mortgage: $70,089
Median monthly housing costs: $1,041
Data:
Median house or condo value ($)
Median house or condo value ($ change since 2000)
Median house or condo value ($) - White
Median house or condo value ($) - Black or African American
Median house or condo value ($) - Asian
Median house or condo value ($) - Hispanic or Latino
Median house or condo value ($) - American Indian and Alaska Native
Median house or condo value ($) - Multirace
Median house or condo value ($) - Other Race
Median price asked for mobile homes ($)
Household density (households per square mile)
Mean house or condo value by units in structure - 1, detached ($)
Mean house or condo value by units in structure - 1, attached ($)
Mean house or condo value by units in structure - 2 ($)
Mean house or condo value by units in structure by units in structure - 3 or 4 ($)
Mean house or condo value by units in structure - 5 or more ($)
Mean house or condo value by units in structure - Boat, RV, van, etc. ($)
Mean house or condo value by units in structure - Mobile home ($)
Median contract rent ($)
Median contract rent - Lower quartile ($)
Median contract rent - Upper quartile ($)
Median gross rent ($)
Urban houses (%)
Rural houses (%)
Houses occupied (%)
Houses occupied (% change since 2000)
Houses owner occupied (%)
Houses owner occupied (% change since 2000)
Houses renter occupied (%)
Houses renter occupied (% change since 2000)
Vacant housing units - For rent (%)
Vacant housing units - For rent (% change since 2000)
Vacant housing units - For sale only (%)
Vacant housing units - For sale only (% change since 2000)
Vacant housing units - Rented or sold, not occupied (%)
Vacant housing units - Rented or sold, not occupied (% change since 2000)
Vacant housing units - For seasonal, recreational, or occasional use (%)
Vacant housing units - For seasonal, recreational, or occasional use (% change since 2000)
Vacant housing units - For migrant workers (%)
Vacant housing units - For migrant workers (% change since 2000)
Vacant housing units - Other vacant (%)
Vacant housing units - Other vacant (% change since 2000)
Median monthly housing costs ($)
Median household income for houses/condos with a mortgage ($)
Median household income for houses/condos without a mortgage ($)
Median household income ($)
Median household income ($) - White
Median household income ($) - Black or African American
Median household income ($) - Asian
Median household income ($) - Hispanic or Latino
Median household income ($) - American Indian and Alaska Native
Median household income ($) - Multirace
Median household income ($) - Other Race
Mortgage status - with mortgage (%)
Mortgage status - with second mortgage (%)
Mortgage status - with home equity loan (%)
Mortgage status - with both second mortgage and home equity loan (%)
Mortgage status - without a mortgage (%)
Median year house/condo built
Median year apartment built
Household type by relationship - Male householder living alone (%)
Household type by relationship - Male householder not living alone (%)
Household type by relationship - Female householder living alone (%)
Household type by relationship - Female householder not living alone (%)
Household type by relationship - Opposite-Sex spouse (%)
Household type by relationship - Same-Sex spouse (%)
Household type by relationship - Opposite-Sex unmarried partner (%)
Household type by relationship - Same-Sex unmarried partner (%)
Household type by relationship - In group quarters (%)
Size of family households - 2-person household (%)
Size of family households - 3-person household (%)
Size of family households - 4-person household (%)
Size of family households - 5-person household (%)
Size of family households - 6-person household (%)
Size of family households - 7-or-more-person household (%)
Size of nonfamily households - 1-person household (%)
Size of nonfamily households - 2-person household (%)
Size of nonfamily households - 3-person household (%)
Size of nonfamily households - 4-person household (%)
Size of nonfamily households - 5-person household (%)
Size of nonfamily households - 6-person household (%)
Size of nonfamily households - 7-or-moreperson household (%)
Year house built - Built 2010 or later (%)
Year house built - Built 2000 to 2009 (%)
Year house built - Built 1990 to 1999 (%)
Year house built - Built 1980 to 1989 (%)
Year house built - Built 1970 to 1979 (%)
Year house built - Built 1960 to 1969 (%)
Year house built - Built 1950 to 1959 (%)
Year house built - Built 1940 to 1949 (%)
Year house built - Built 1939 or earlier (%)
Median number of rooms in houses and condos
Median number of rooms in apartments
Median number of bedrooms in owner occupied houses
Mean number of bedrooms in owner occupied houses
Median number of bedrooms in renter occupied houses
Mean number of bedrooms in renter occupied houses
Median number of vehichles in owner occupied houses
Mean number of vehichles in owner occupied houses
Median number of vehichles in renter occupied houses
Mean number of vehichles in renter occupied houses
Rooms in owner-occupied houses - 1 room (%)
Rooms in owner-occupied houses - 2 rooms (%)
Rooms in owner-occupied houses - 3 rooms (%)
Rooms in owner-occupied houses - 4 rooms (%)
Rooms in owner-occupied houses - 5 rooms (%)
Rooms in owner-occupied houses - 6 rooms (%)
Rooms in owner-occupied houses - 7 rooms (%)
Rooms in owner-occupied houses - 8 rooms (%)
Rooms in owner-occupied houses - 9+ rooms (%)
Rooms in renter-occupied houses - 1 room (%)
Rooms in renter-occupied houses - 2 rooms (%)
Rooms in renter-occupied houses - 3 rooms (%)
Rooms in renter-occupied houses - 4 rooms (%)
Rooms in renter-occupied houses - 5 rooms (%)
Rooms in renter-occupied houses - 6 rooms (%)
Rooms in renter-occupied houses - 7 rooms (%)
Rooms in renter-occupied houses - 8 rooms (%)
Rooms in renter-occupied houses - 9+ rooms (%)
Bedrooms in owner-occupied houses - no bedrooms (%)
Bedrooms in owner-occupied houses - 1 bedroom (%)
Bedrooms in owner-occupied houses - 2 bedrooms (%)
Bedrooms in owner-occupied houses - 3 bedrooms (%)
Bedrooms in owner-occupied houses - 4 bedrooms (%)
Bedrooms in owner-occupied houses - 5+ bedrooms (%)
Bedrooms in renter-occupied houses - no bedrooms (%)
Bedrooms in renter-occupied houses - 1 bedroom (%)
Bedrooms in renter-occupied houses - 2 bedrooms (%)
Bedrooms in renter-occupied houses - 3 bedrooms (%)
Bedrooms in renter-occupied houses - 4 bedrooms (%)
Bedrooms in renter-occupied houses - 5+ bedrooms (%)
Vehicles available in owner-occupied houses - no vehicle available (%)
Vehicles available in owner-occupied houses - 1 vehicle available(%)
Vehicles available in owner-occupied houses - 2 Vehicles available (%)
Vehicles available in owner-occupied houses - 3 Vehicles available (%)
Vehicles available in owner-occupied houses - 4 Vehicles available (%)
Vehicles available in owner-occupied houses - 5+ Vehicles available (%)
Vehicles available in renter-occupied houses - no vehicle available (%)
Vehicles available in renter-occupied houses - 1 vehicle available (%)
Vehicles available in renter-occupied houses - 2 Vehicles available (%)
Vehicles available in renter-occupied houses - 3 Vehicles available (%)
Vehicles available in renter-occupied houses - 4 Vehicles available (%)
Vehicles available in renter-occupied houses - 5+ Vehicles available (%)
Housing units in structures - 1, detached (%)
Housing units in structures - 1, attached (%)
Housing units in structures - 2 (%)
Housing units in structures - 3 or 4 (%)
Housing units in structures - 5 to 9 (%)
Housing units in structures - 10 to 19 (%)
Housing units in structures - 20 to 49 (%)
Housing units in structures - 50 or more (%)
Housing units in structures - Mobile home (%)
Housing units in structures - Boat, RV, van, etc. (%)
Housing units in structures - Owners - 1, detached (%)
Housing units in structures - Owners - 1, attached (%)
Housing units in structures - Owners - 2 (%)
Housing units in structures - Owners - 3 or 4 (%)
Housing units in structures - Owners - 5 to 9 (%)
Housing units in structures - Owners - 10 to 19 (%)
Housing units in structures - Owners - 20 to 49 (%)
Housing units in structures - Owners - 50 or more (%)
Housing units in structures - Owners - Mobile home (%)
Housing units in structures - Owners - Boat, RV, van, etc. (%)
Housing units in structures - Renters - 1, detached (%)
Housing units in structures - Renters - 1, attached (%)
Housing units in structures - Renters - 2 (%)
Housing units in structures - Renters - 3 or 4 (%)
Housing units in structures - Renters - 5 to 9 (%)
Housing units in structures - Renters - 10 to 19 (%)
Housing units in structures - Renters - 20 to 49 (%)
Housing units in structures - Renters - 50 or more (%)
Housing units in structures - Renters - Mobile home (%)
Housing units in structures - Renters - Boat, RV, van, etc. (%)
House/condo owner moved in on average (years ago)
Renter moved in on average (years ago)
Year householder moved into unit - Moved in 1999 to March 2000 (%)
Year householder moved into unit - Moved in 1999 to March 2000 (%) - White
Year householder moved into unit - Moved in 1999 to March 2000 (%) - Black or African American
Year householder moved into unit - Moved in 1999 to March 2000 (%) - Asian
Year householder moved into unit - Moved in 1999 to March 2000 (%) - Hispanic or Latino
Year householder moved into unit - Moved in 1999 to March 2000 (%) - American Indian and Alaska Native
Year householder moved into unit - Moved in 1999 to March 2000 (%) - Multirace
Year householder moved into unit - Moved in 1999 to March 2000 (%) - Other Race
Year householder moved into unit - Moved in 1995 to 1998 (%)
Year householder moved into unit - Moved in 1995 to 1998 (%) - White
Year householder moved into unit - Moved in 1995 to 1998 (%) - Black or African American
Year householder moved into unit - Moved in 1995 to 1998 (%) - Asian
Year householder moved into unit - Moved in 1995 to 1998 (%) - Hispanic or Latino
Year householder moved into unit - Moved in 1995 to 1998 (%) - American Indian and Alaska Native
Year householder moved into unit - Moved in 1995 to 1998 (%) - Multirace
Year householder moved into unit - Moved in 1995 to 1998 (%) - Other Race
Year householder moved into unit - Moved in 1990 to 1994 (%)
Year householder moved into unit - Moved in 1990 to 1994 (%) - White
Year householder moved into unit - Moved in 1990 to 1994 (%) - Black or African American
Year householder moved into unit - Moved in 1990 to 1994 (%) - Asian
Year householder moved into unit - Moved in 1990 to 1994 (%) - Hispanic or Latino
Year householder moved into unit - Moved in 1990 to 1994 (%) - American Indian and Alaska Native
Year householder moved into unit - Moved in 1990 to 1994 (%) - Multirace
Year householder moved into unit - Moved in 1990 to 1994 (%) - Other Race
Year householder moved into unit - Moved in 1980 to 1989 (%)
Year householder moved into unit - Moved in 1980 to 1989 (%) - White
Year householder moved into unit - Moved in 1980 to 1989 (%) - Black or African American
Year householder moved into unit - Moved in 1980 to 1989 (%) - Asian
Year householder moved into unit - Moved in 1980 to 1989 (%) - Hispanic or Latino
Year householder moved into unit - Moved in 1980 to 1989 (%) - American Indian and Alaska Native
Year householder moved into unit - Moved in 1980 to 1989 (%) - Multirace
Year householder moved into unit - Moved in 1980 to 1989 (%) - Other Race
Year householder moved into unit - Moved in 1970 to 1979 (%)
Year householder moved into unit - Moved in 1970 to 1979 (%) - White
Year householder moved into unit - Moved in 1970 to 1979 (%) - Black or African American
Year householder moved into unit - Moved in 1970 to 1979 (%) - Asian
Year householder moved into unit - Moved in 1970 to 1979 (%) - Hispanic or Latino
Year householder moved into unit - Moved in 1970 to 1979 (%) - American Indian and Alaska Native
Year householder moved into unit - Moved in 1970 to 1979 (%) - Multirace
Year householder moved into unit - Moved in 1970 to 1979 (%) - Other Race
Year householder moved into unit - Moved in 1969 or earlier (%)
Year householder moved into unit - Moved in 1969 or earlier (%) - White
Year householder moved into unit - Moved in 1969 or earlier (%) - Black or African American
Year householder moved into unit - Moved in 1969 or earlier (%) - Asian
Year householder moved into unit - Moved in 1969 or earlier (%) - Hispanic or Latino
Year householder moved into unit - Moved in 1969 or earlier (%) - American Indian and Alaska Native
Year householder moved into unit - Moved in 1969 or earlier (%) - Multirace
Year householder moved into unit - Moved in 1969 or earlier (%) - Other Race
Housing units lacking complete plumbing facilities (%)
Housing units lacking complete kitchen facilities (%)
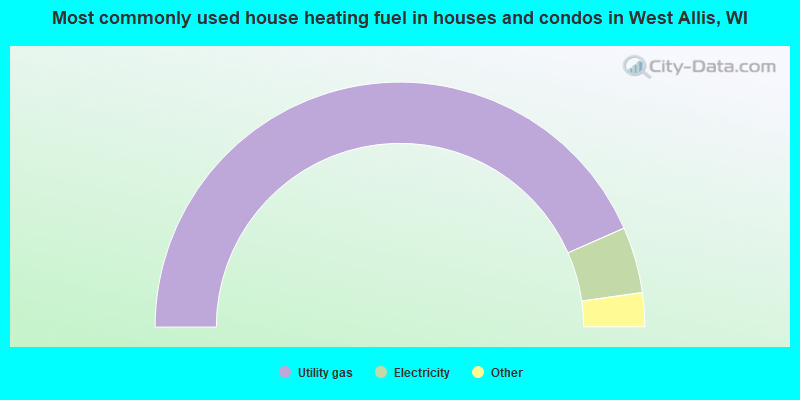
House heating fuel used in houses and condos - Utility gas (%)
House heating fuel used in houses and condos - Bottled, tank, or LP gas (%)
House heating fuel used in houses and condos - Electricity (%)
House heating fuel used in houses and condos - Fuel oil, kerosene, etc. (%)
House heating fuel used in houses and condos - Coal or coke (%)
House heating fuel used in houses and condos - Wood (%)
House heating fuel used in houses and condos - Solar energy (%)
House heating fuel used in houses and condos - Other fuel (%)
House heating fuel used in houses and condos - No fuel used (%)
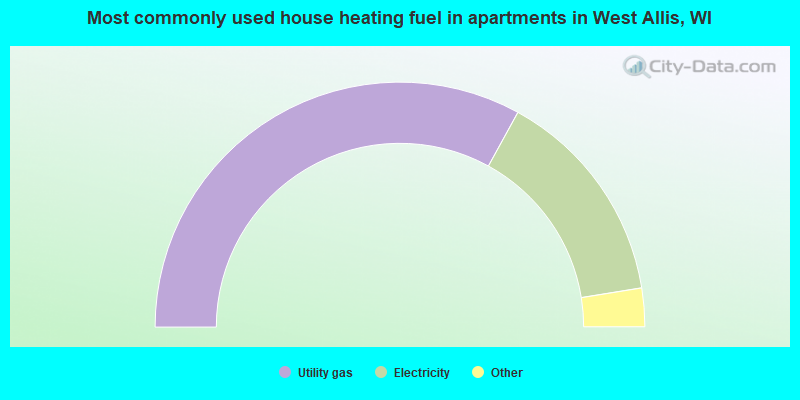
House heating fuel used in apartments - Utility gas (%)
House heating fuel used in apartments - Bottled, tank, or LP gas (%)
House heating fuel used in apartments - Electricity (%)
House heating fuel used in apartments - Fuel oil, kerosene, etc. (%)
House heating fuel used in apartments - Coal or coke (%)
House heating fuel used in apartments - Wood (%)
House heating fuel used in apartments - Solar energy (%)
House heating fuel used in apartments - Other fuel (%)
House heating fuel used in apartments - No fuel used (%)
Median year house/condo built: 1950Median year apartment built: 1963Household type by relationship:
Households: 58,982
Male householders: 12,484 (5,135 living alone ), Female householders: 14,707 (6,030 living alone )8,998 spouses (8,884 opposite-sex spouses ), 2,621 unmarried partners , (2,516 opposite-sex unmarried partners ), 14,655 children (14,008 natural , 273 adopted , 373 stepchildren ), 765 grandchildren , 742 brothers or sisters , 725 parents , 47 foster children , 472 other relatives , 1,862 non-relatives In group quarters: 898
Size of family households: 6,057 2-persons , 3,777 3-persons , 1,968 4-persons , 969 5-persons , 402 6-persons , 205 7-or-more-persons .
Size of nonfamily households: 11,581 1-person , 2,422 2-persons , 205 3-persons , 82 4-persons .
6,445 married couples with children. single-parent households (1,591 men , 2,786 women ).
87.4% of residents of West Allis speak English at home. of residents speak Spanish at home (65% speak English very well , 18% speak English well , 14% speak English not well , 3% don't speak English at all ).of residents speak other Indo-European language at home (64% speak English very well , 25% speak English well , 11% speak English not well ).of residents speak Asian or Pacific Island language at home (72% speak English very well , 12% speak English well , 10% speak English not well , 5% don't speak English at all ).of residents speak other language at home (49% speak English very well , 25% speak English well , 26% speak English not well ).
Foreign born population: 3,183 (5.4%)of them are naturalized citizens )
Median number of rooms in houses and condos:
Median number of rooms in apartments
Owner-occupied Renter-occupied
Rooms in owner-occupied houses in West Allis, Wisconsin
6 1 room 22 2 rooms 152 3 rooms 1,588 4 rooms 3,481 5 rooms 4,282 6 rooms 2,285 7 rooms 1,473 8 rooms 1,256 9+ rooms
Rooms in renter-occupied apartments in West Allis, Wisconsin
924 1 room 731 2 rooms 2,987 3 rooms 4,025 4 rooms 2,724 5 rooms 1,124 6 rooms 314 7 rooms 122 8 rooms 65 9+ rooms
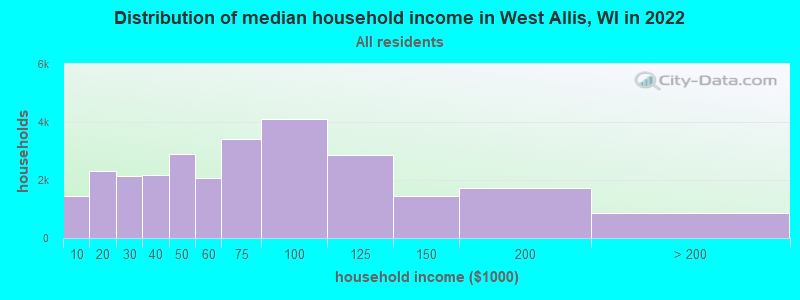
West Allis, WI household income distribution 1,434 Less than $10,0002,299 $10,000 to $19,9992,148 $20,000 to $29,9992,188 $30,000 to $39,9992,906 $40,000 to $49,9992,080 $50,000 to $59,9993,429 $60,000 to $74,9994,114 $75,000 to $99,9992,870 $100,000 to $124,9991,433 $125,000 to $149,9991,734 $150,000 to $199,999862 $200,000 or more
Home value of owner - occupied houses in 2022 in West Allis, WI 201 Less than $10,000318 $10,000 to $14,999120 $15,000 to $19,99967 $20,000 to $24,99911 $25,000 to $29,99910 $30,000 to $34,9993 $40,000 to $49,99920 $50,000 to $59,99942 $60,000 to $69,99956 $70,000 to $79,99967 $80,000 to $89,999200 $90,000 to $99,999691 $100,000 to $124,9991,458 $125,000 to $149,9993,156 $150,000 to $174,9992,627 $175,000 to $199,9993,029 $200,000 to $249,9991,169 $250,000 to $299,999572 $300,000 to $399,999182 $400,000 to $499,99956 $500,000 to $749,99927 $750,000 to $999,99915 $1,000,000 to $1,499,99913 $1,500,000 to $1,999,99916 $2,000,000 or moreRent paid by renters in 2022 in West Allis, WI 28 Less than $10022 $100 to $14981 $150 to $199378 $200 to $249131 $250 to $29959 $300 to $349170 $350 to $399261 $400 to $449397 $450 to $499449 $500 to $549509 $550 to $599744 $600 to $6491,068 $650 to $699839 $700 to $749893 $750 to $7992,003 $800 to $8991,268 $900 to $9991,644 $1,000 to $1,249827 $1,250 to $1,499893 $1,500 to $1,99972 $2,000 to $2,49917 $2,500 to $2,999250 No cash rent
Percentage of workers working in this county: 71.7%Number of people working at home: 2,898 (9.3% of all workers )
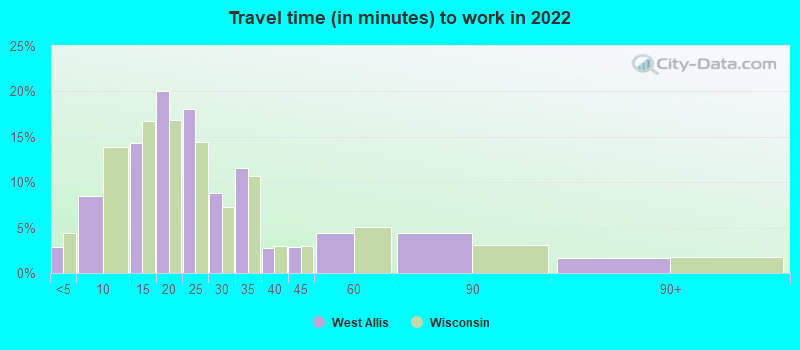
Travel time to work (commute)
Less than 5 minutes: 5475 to 9 minutes: 2,27810 to 14 minutes: 4,67515 to 19 minutes: 6,58020 to 24 minutes: 5,34625 to 29 minutes: 2,24730 to 34 minutes: 3,70035 to 39 minutes: 45140 to 44 minutes: 49245 to 59 minutes: 79460 to 89 minutes: 44790 or more minutes: 274
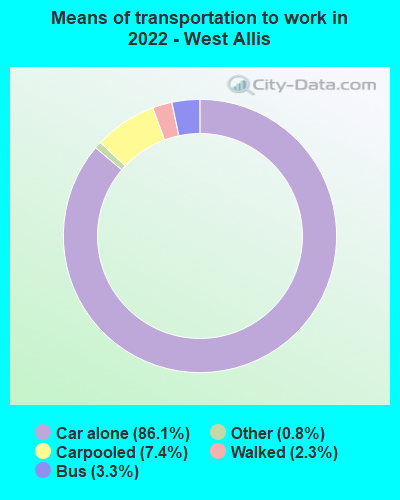
Means of transportation to work:
Drove a car alone: 21,434 (75.7%)Carpooled: 2,076 (7.3%)Bus : 679 (2.4%)Long-distance train or commuter rail : 15 (0.1%)Light rail, streetcar or trolley : 5 (0.0%)Ferryboat: 17 (0.1%)Taxi: 221 (0.8%)Bicycle: 17 (0.1%)Walked: 627 (2.2%)Worked at home: 2,898 (10.2%)
Unemployment by race in 2022
Unemployment rate for White non-Hispanic residents 3.1% Males1.7% FemalesUnemployment rate for Black residents 3.9% Males16.2% FemalesUnemployment rate for American Indian and Alaska Native residents 4.4% MalesUnemployment rate for Asian residents 1.0% FemalesUnemployment rate for other race residents 3.2% Males2.7% FemalesUnemployment rate for two or more race residents 5.9% MalesUnemployment rate for Hispanic or Latino residents 4.0% Males0.5% Females
Year of entry for the foreign-born population in West Allis, Wisconsin
826 2010 or later 978 2000 to 2009 586 1990 to 1999 312 1980 to 1989 213 1970 to 1979 892 Before 1970
First ancestries reported:
German: 6,890 (24.7%)
Polish: 2,556 (9.1%)
American: 1,399 (5.0%)
Irish: 1,323 (4.7%)
European: 838 (3.0%)
English: 638 (2.3%)
Italian: 554 (2.0%)
Norwegian: 497 (1.8%)
Greek: 145 (0.5%)
French: 116 (0.4%)
Ukrainian: 114 (0.4%)
Slavic: 96 (0.3%)
Scottish: 93 (0.3%)
Croatian: 87 (0.3%)
French Canadian: 86 (0.3%)
Swedish: 80 (0.3%)
Czech: 73 (0.3%)
Slovene: 66 (0.2%)
Slovak: 66 (0.2%)
Scandinavian: 64 (0.2%)
Dutch: 60 (0.2%)
Romanian: 58 (0.2%)
Canadian: 58 (0.2%)
Serbian: 50 (0.2%)
Finnish: 41 (0.1%)
Lithuanian: 28 (0.1%)
Danish: 28 (0.1%)
Portuguese: 26 (0.09%)
Scotch-Irish: 25 (0.09%)
Eastern European: 25 (0.09%)
Swiss: 25 (0.09%)
Yugoslavian: 25 (0.09%)
Latvian: 18 (0.06%)
Hungarian: 18 (0.06%)
British: 17 (0.06%)
Northern European: 14 (0.05%)
Russian: 14 (0.05%)
Estonian: 14 (0.05%)
Assyrian: 13 (0.05%)
African: 13 (0.05%)
Turkish: 13 (0.05%)
Iranian: 11 (0.04%)
Palestinian: 7 (0.03%)
Austrian: 6 (0.02%)
Egyptian: 4 (0.01%)
Welsh: 4 (0.01%)
Most common places of birth for foreign-born residents (%): Mexico West Allis:
36.8% (1,143)Wisconsin:
29.5% (87,182)
India West Allis:
11.3% (352)Wisconsin:
8.0% (23,594)
Philippines West Allis:
5.3% (164)Wisconsin:
3.1% (9,280)
Burma (Myanmar) West Allis:
3.6% (112)Wisconsin:
1.4% (4,016)
China, excluding Hong Kong and Taiwan West Allis:
3.4% (107)Wisconsin:
5.1% (15,165)
Poland West Allis:
3.2% (100)Wisconsin:
1.5% (4,321)
Somalia West Allis:
3.2% (98)Wisconsin:
0.5% (1,537)
Taiwan West Allis:
3.1% (97)Wisconsin:
0.7% (1,987)
Laos West Allis:
2.7% (85)Wisconsin:
4.3% (12,681)
France West Allis:
2.7% (83)Wisconsin:
0.3% (858)
Germany West Allis:
2.3% (73)Wisconsin:
3.0% (8,773)
Ukraine West Allis:
2.3% (72)Wisconsin:
0.7% (2,177)
Thailand West Allis:
2.3% (71)Wisconsin:
3.3% (9,655)
Dominican Republic West Allis:
2.2% (69)Wisconsin:
0.7% (1,948)
Romania West Allis:
2.1% (66)Wisconsin:
0.4% (1,247)
Korea West Allis:
1.6% (50)Wisconsin:
1.8% (5,320)
Vietnam West Allis:
1.5% (48)Wisconsin:
1.5% (4,400)
Ecuador West Allis:
1.5% (47)Wisconsin:
0.2% (717)
Place of birth for U.S.-born residents:
This state: 45,957Other state: 8,420Northeast: 667Midwest: 4,234South: 2,112West: 1,482 85.8% of West Allis residents lived in the same house 1 years ago.
Out of people who lived in different houses, 42.8% lived in this county.
Out of people who lived in different counties, 62.9% lived in Wisconsin.
West Allis:
85.8%State average:
87.7%
Education attainment for males 25 years and older:
No schooling: 242Nursery to 4th grade: 25th and 6th grade: 2407th and 8th grade: 589th grade: 8810th grade: 12111th grade: 36012th grade, no diploma: 524High school graduate (or equivalency): 7,537Less than 1 year of college: 1,324Some college more than 1 year, no degree: 3,428Associate degree: 2,265Bachelor's degree: 3,850Master's degree: 928Professional school degree: 117Doctorate degree: 175
Education attainment for females 25 years and older:
No schooling: 316Nursery to 4th grade: 475th and 6th grade: 1027th and 8th grade: 529th grade: 10110th grade: 35111th grade: 10612th grade, no diploma: 218High school graduate (or equivalency): 6,502Less than 1 year of college: 1,807Some college more than 1 year, no degree: 3,592Associate degree: 2,236Bachelor's degree: 4,734Master's degree: 1,673Professional school degree: 120Doctorate degree: 215
Housing units in structures:
One, detached: 14,973One, attached: 616Two: 4,5983 or 4: 1,4805 to 9: 1,50510 to 19: 1,27720 to 49: 2,23050 or more: 2,352Mobile homes: 499Median worth of mobile homes: $9,554
Housing units lacking complete plumbing facilities in 2022: 0.9%Housing units lacking complete kitchen facilities in 2022: 2.7%House/condo owner moved in on average 14 years ago
Renter moved in on average 4 years ago
Private vs. public school enrollment:
Students in private schools in grades 1 to 8 (elementary and middle school): 741 Here:
16.5%Wisconsin:
16.7%
Students in private schools in grades 9 to 12 (high school): 321 Here:
11.9%Wisconsin:
12.5%
Students in private undergraduate colleges: 368 Here:
20.3%Wisconsin:
17.5%