West Des Moines, IA (Iowa) Houses and Residents
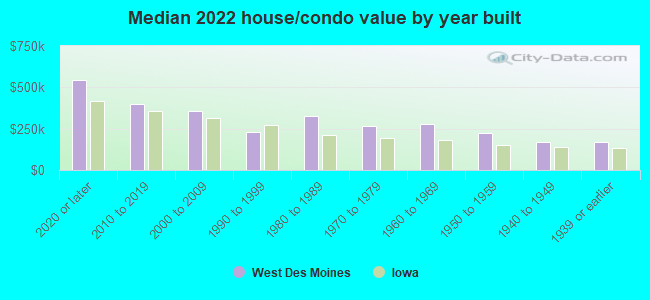
| West Des Moines: | $296,200 |
| Iowa: | $194,600 |
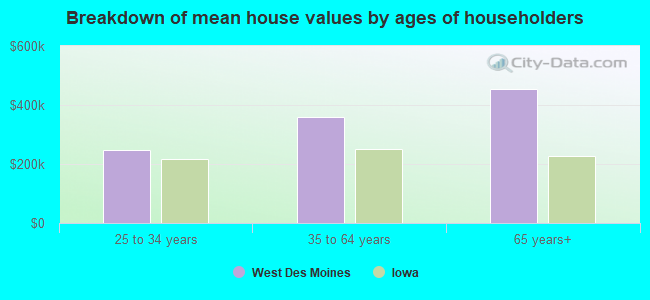
Mean price in 2022:
Detached houses: $378,602
Here: $378,602 State: $245,224 Townhouses or other attached units: $226,180
Here: $226,180 State: $238,767 In 2-unit structures: $261,943
Here: $261,943 State: $243,070 In 3-to-4-unit structures: $94,589
Here: $94,589 State: $162,139 In 5-or-more-unit structures: $162,477
Here: $162,477 State: $190,519 Mobile homes: $32,010
Here: $32,010 State: $51,271
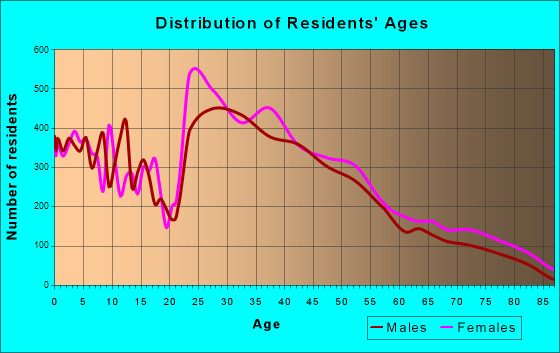
Total population: 63,325 (Urban population: 45,558, Rural population: 742 (38 farm, 704 nonfarm))
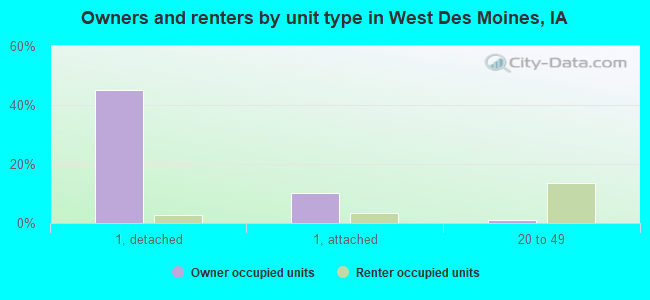
Houses: 32,943 (31,862 occupied: 18,756 owner occupied, 13,106 renter occupied)
| % of renters here: | 41% |
| State: | 28% |
Housing density: 1,230 houses/condos per square mile
Median price asked for vacant for-sale houses and condos in 2022: $411,937.
Median contract rent in 2022: $1,075 (lower quartile is $901, upper quartile is $1,362)
Median rent asked for vacant for-rent units in 2022: $865
Median gross rent in West Des Moines, IA in 2022: $1,211
Housing units in West Des Moines with a mortgage: 13,615 (1,380 second mortgage, 17 home equity loan, 1,007 both second mortgage and home equity loan)
Houses without a mortgage: 187
Median household income for houses/condos with a mortgage: $135,692
Median household income for apartments without a mortgage: $98,878
Median monthly housing costs: $1,277
Compare current foreclosures in West Des Moines, IA:
| Photo | Address | Area | Beds / Baths | Price | Details |
|---|---|---|---|---|---|

|
#1
Westown Pkwy Unit 21109
West Des Moines, IA 50266
|
1,215 sq. feet
|
2 baths 3 beds |
show details | |

|
#2
34th Pl
West Des Moines, IA 50265
|
2,102 sq. feet
|
2 baths 3 beds |
show details | |

|
#3
46th Pl
West Des Moines, IA 50265
|
2,424 sq. feet
|
2 baths 4 beds |
show details | |

|
#4
67th St Unit 110
West Des Moines, IA 50266
|
999 sq. feet
|
1 baths 2 beds |
show details | |

|
#5
Brookview Dr
West Des Moines, IA 50265
|
1,855 sq. feet
|
2 baths 4 beds |
show details | |

|
#6
6th St
West Des Moines, IA 50265
|
1,109 sq. feet
|
1 baths 3 beds |
show details | |

|
#7
Brookview Dr
West Des Moines, IA 50265
|
1,992 sq. feet
|
1 baths 3 beds |
show details | |

|
#8
67th St Unit 414
West Des Moines, IA 50266
|
999 sq. feet
|
1 baths 2 beds |
show details | |

|
#9
Woodland Ave Unit 207
West Des Moines, IA 50266
|
1,196 sq. feet
|
1 baths 2 beds |
show details | |

|
#10
Kingman Dr
West Des Moines, IA 50266
|
2,206 sq. feet
|
1 baths 3 beds |
show details |
| Photo | Address | Area | Beds / Baths | Price | Details |
|---|---|---|---|---|---|

|
#11
Stone Creek Ct
West Des Moines, IA 50266
|
1,302 sq. feet
|
1 baths 2 beds |
show details | |

|
#12
52nd St
West Des Moines, IA 50265
|
3,133 sq. feet
|
2 baths 4 beds |
show details | |

|
#13
Valley Ridge Ct
West Des Moines, IA 50265
|
4,373 sq. feet
|
3 baths 4 beds |
show details | |

|
#14
7th St
West Des Moines, IA 50265
|
1,302 sq. feet
|
1 baths 4 beds |
show details | |

|
#15
Westown Pkwy Unit 21109
West Des Moines, IA 50266
|
1,215 sq. feet
|
1 baths 3 beds |
show details | |

|
#16
Prospect Ave
West Des Moines, IA 50265
|
1,957 sq. feet
|
1 baths 3 beds |
show details | |

|
#17
Oak Creek Pl
West Des Moines, IA 50265
|
1,719 sq. feet
|
3 baths 2 beds |
show details | |

|
#18
Maple St
West Des Moines, IA 50265
|
864 sq. feet
|
1 baths 2 beds |
show details | |

|
#19
Westown Pkwy Unit 20110
West Des Moines, IA 50266
|
1,215 sq. feet
|
1 baths 3 beds |
show details | |

|
#20
3rd St
West Des Moines, IA 50265
|
1,635 sq. feet
|
1 baths 3 beds |
show details |
| Photo | Address | Area | Beds / Baths | Price | Details |
|---|---|---|---|---|---|

|
#21
Woodland Park Dr
West Des Moines, IA 50266
|
2,363 sq. feet
|
2 baths - beds |
show details | |

|
#22
Greenspire Dr Unit 110
West Des Moines, IA 50266
|
1,661 sq. feet
|
- baths 3 beds |
show details | |

|
#23
University Ave Apt 13203
West Des Moines, IA 50266
|
- sq. feet
|
- baths - beds |
show details | |

|
#24
8th St # 314
West Des Moines, IA 50265
|
- sq. feet
|
- baths - beds |
show details | |

|
#25
S Redtail Ave
West Des Moines, IA 50265
|
- sq. feet
|
- baths - beds |
show details | |

|
#26
S Redtail Ave
West Des Moines, IA 50265
|
- sq. feet
|
- baths - beds |
show details | |

|
#27
S 64th St Unit 2302
West Des Moines, IA 50266
|
- sq. feet
|
- baths - beds |
show details | |

|
#28
Prairie View Dr Apt 93207
West Des Moines, IA 50266
|
- sq. feet
|
- baths - beds |
show details | |

|
#29
Westown Pkwy Apt 506
West Des Moines, IA 50266
|
- sq. feet
|
- baths - beds |
show details | |

|
#30
S 68th St Unit 2101
West Des Moines, IA 50266
|
- sq. feet
|
- baths - beds |
show details |
| Photo | Address | Area | Beds / Baths | Price | Details |
|---|---|---|---|---|---|

|
#31
Wild Rose Ln Unit 2202
West Des Moines, IA 50266
|
- sq. feet
|
- baths - beds |
show details | |

|
#32
S 64th St Unit 11103
West Des Moines, IA 50266
|
- sq. feet
|
- baths - beds |
show details | |

|
#33
1/2 Maple St
West Des Moines, IA 50265
|
- sq. feet
|
- baths - beds |
show details | |

|
#34
Bennett Dr Apt 105
West Des Moines, IA 50265
|
- sq. feet
|
- baths - beds |
show details | |

|
#35
Copper Dr
West Des Moines, IA 50266
|
- sq. feet
|
- baths - beds |
show details | |

|
#36
Woodland Ave Apt 13
West Des Moines, IA 50266
|
- sq. feet
|
- baths - beds |
show details | |

|
#37
Office Park Rd Apt 804
West Des Moines, IA 50265
|
- sq. feet
|
- baths - beds |
show details | |

|
#38
University Ave Apt 24203
West Des Moines, IA 50266
|
- sq. feet
|
- baths - beds |
show details | |

|
#39
S 41st St Unit 7102
West Des Moines, IA 50265
|
- sq. feet
|
- baths - beds |
show details | |

|
#40
Cascade Ave, Unit 6305
West Des Moines, IA 50266
|
- sq. feet
|
- baths - beds |
show details |
| Photo | Address | Area | Beds / Baths | Price | Details |
|---|---|---|---|---|---|

|
#41
Westown Pkwy Apt 603
West Des Moines, IA 50266
|
- sq. feet
|
- baths - beds |
show details | |

|
#42
S Jordan Creek Pkwy, Apt 6104
West Des Moines, IA 50266
|
- sq. feet
|
- baths - beds |
show details | |

|
Check over 1 million property listings on Foreclosure.com!
|
browse all offers | |||


 | Moving to West Des Moines need input on apartments (1 reply) |
| Efficiency Apartments West Des Moines (1 reply) |
| Apartments in Des Moines? (6 replies) |
| Apartments in Des Moines suburbs? (2 replies) |
| Looking to Relocate to Des Moines or West Des Moines (3 replies) |
| Land purchased on cascade in west des moines by edgewater (2 replies) |
Median year apartment built: 2000
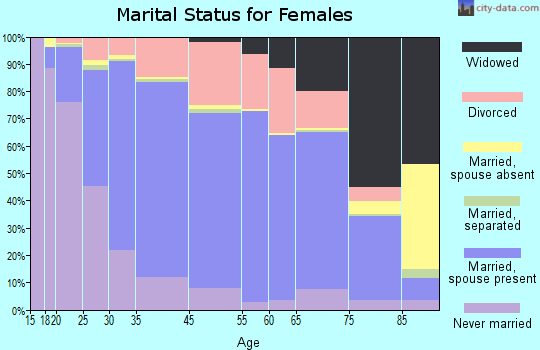
Household type by relationship:
Households: 73,965- Male householders: 16,383 (4,919 living alone), Female householders: 15,479 (5,531 living alone)
14,127 spouses (13,965 opposite-sex spouses), 2,773 unmarried partners, (2,591 opposite-sex unmarried partners), 19,798 children (18,623 natural, 358 adopted, 817 stepchildren), 531 grandchildren, 880 brothers or sisters, 611 parents, 0 foster children, 1,314 other relatives, 1,706 non-relatives
- In group quarters: 363
Size of family households: 8,094 2-persons, 3,872 3-persons, 4,019 4-persons, 968 5-persons, 769 6-persons, 419 7-or-more-persons.
Size of nonfamily households: 10,450 1-person, 2,953 2-persons, 216 3-persons, 102 4-persons.
11,413 married couples with children.
3,297 single-parent households (1,263 men, 2,034 women).
85.8% of residents of West Des Moines speak English at home.
4.2% of residents speak Spanish at home (59% speak English very well, 20% speak English well, 15% speak English not well, 6% don't speak English at all).
3.5% of residents speak other Indo-European language at home (58% speak English very well, 28% speak English well, 13% speak English not well).
3.2% of residents speak Asian or Pacific Island language at home (72% speak English very well, 17% speak English well, 7% speak English not well, 4% don't speak English at all).
2.8% of residents speak other language at home (48% speak English very well, 23% speak English well, 22% speak English not well, 6% don't speak English at all).
Foreign born population: 8,496 (11.5%)
(48.0% of them are naturalized citizens)
| Here: | 6.8 |
| State: | 6.8 |
| Here: | 3.8 |
| State: | 4.2 |
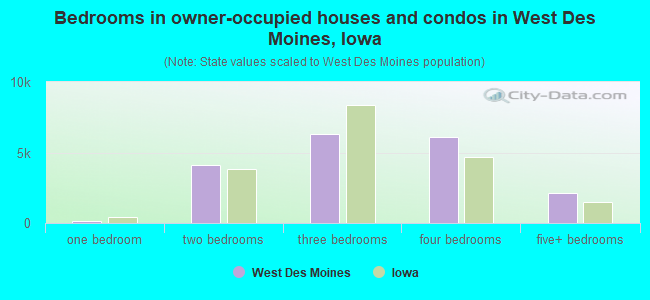
- Bedrooms in owner-occupied houses and condos in West Des Moines, Iowa
- 0no bedroom
- 1501 bedroom
- 4,1032 bedrooms
- 6,3143 bedrooms
- 6,0784 bedrooms
- 2,1115+ bedrooms
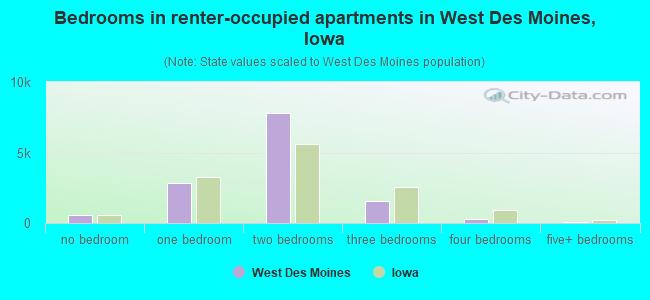
- Bedrooms in renter-occupied apartments in West Des Moines, Iowa
- 567no bedroom
- 2,8081 bedroom
- 7,7772 bedrooms
- 1,5763 bedrooms
- 2754 bedrooms
- 1035+ bedrooms
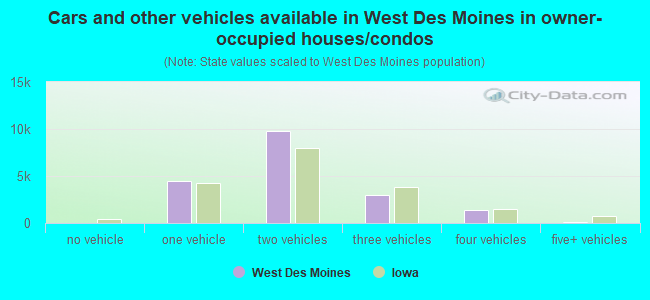
- Cars and other vehicles available in West Des Moines in owner-occupied houses/condos
- 43no vehicle
- 4,4411 vehicle
- 9,7352 vehicles
- 3,0263 vehicles
- 1,4274 vehicles
- 845+ vehicles
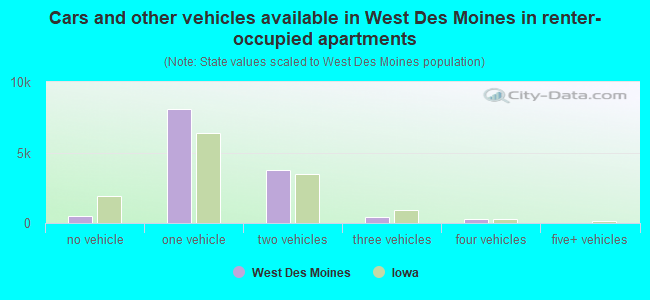
- Cars and other vehicles available in West Des Moines in renter-occupied apartments
- 513no vehicle
- 8,0781 vehicle
- 3,7902 vehicles
- 4113 vehicles
- 3144 vehicles
- 05+ vehicles
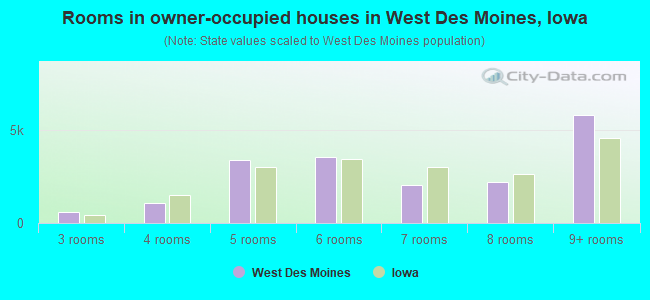
- Rooms in owner-occupied houses in West Des Moines, Iowa
- 01 room
- 302 rooms
- 5693 rooms
- 1,0994 rooms
- 3,3935 rooms
- 3,5736 rooms
- 2,0497 rooms
- 2,2168 rooms
- 5,8279+ rooms
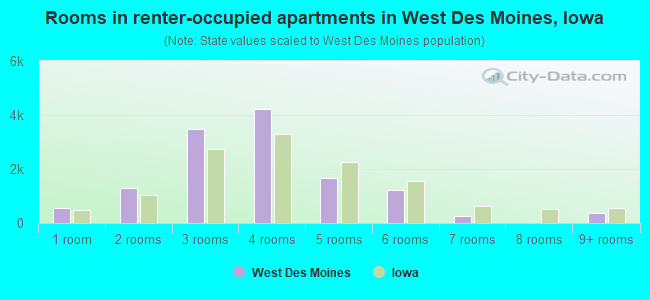
- Rooms in renter-occupied apartments in West Des Moines, Iowa
- 5671 room
- 1,2942 rooms
- 3,4783 rooms
- 4,2354 rooms
- 1,6565 rooms
- 1,2226 rooms
- 2757 rooms
- 08 rooms
- 3799+ rooms
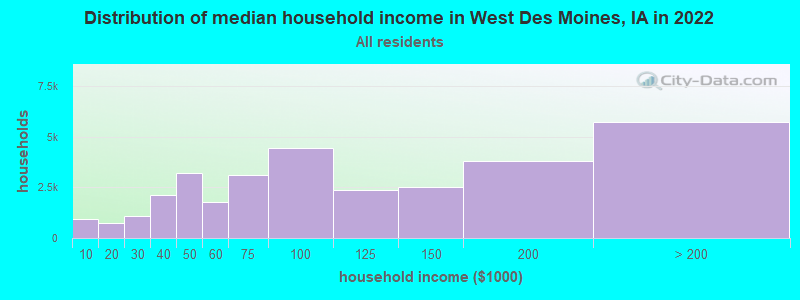
West Des Moines, IA household income distribution

- 937Less than $10,000
- 747$10,000 to $19,999
- 1,083$20,000 to $29,999
- 2,107$30,000 to $39,999
- 3,228$40,000 to $49,999
- 1,782$50,000 to $59,999
- 3,100$60,000 to $74,999
- 4,437$75,000 to $99,999
- 2,377$100,000 to $124,999
- 2,521$125,000 to $149,999
- 3,811$150,000 to $199,999
- 5,732$200,000 or more
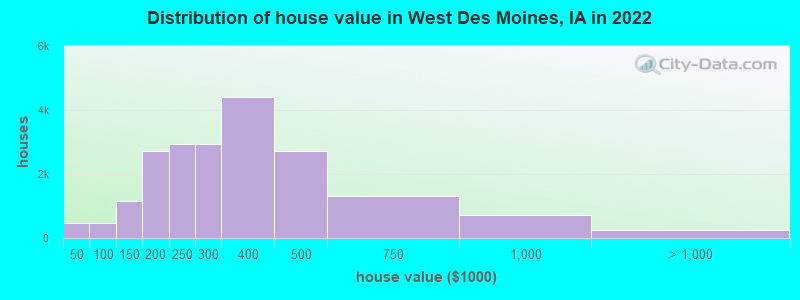
Home value of owner - occupied houses in 2022 in West Des Moines, IA
-
- 58Less than $10,000
- 20$10,000 to $14,999
- 25$15,000 to $19,999
- 219$20,000 to $24,999
- 82$25,000 to $29,999
- 16$30,000 to $34,999
- 36$40,000 to $49,999
- 108$50,000 to $59,999
- 24$60,000 to $69,999
- 29$70,000 to $79,999
- 74$80,000 to $89,999
- 191$90,000 to $99,999
- 664$100,000 to $124,999
- 483$125,000 to $149,999
- 1,506$150,000 to $174,999
- 1,211$175,000 to $199,999
- 2,928$200,000 to $249,999
- 2,946$250,000 to $299,999
- 4,392$300,000 to $399,999
- 2,719$400,000 to $499,999
- 1,318$500,000 to $749,999
- 707$750,000 to $999,999
- 139$1,000,000 to $1,499,999
- 67$1,500,000 to $1,999,999
- 55$2,000,000 or more
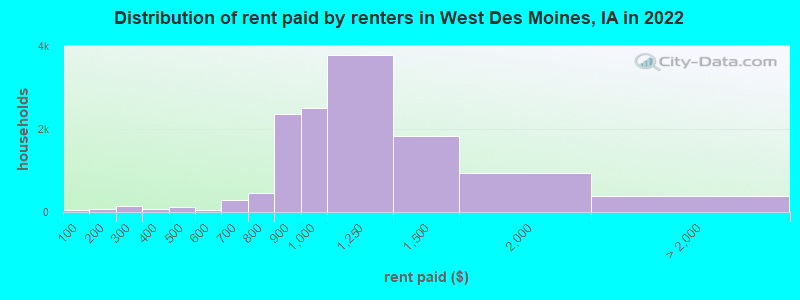
Rent paid by renters in 2022 in West Des Moines, IA
-
- 40Less than $100
- 66$150 to $199
- 99$200 to $249
- 45$250 to $299
- 11$300 to $349
- 61$350 to $399
- 75$400 to $449
- 53$450 to $499
- 52$550 to $599
- 55$600 to $649
- 241$650 to $699
- 309$700 to $749
- 153$750 to $799
- 2,369$800 to $899
- 2,515$900 to $999
- 3,793$1,000 to $1,249
- 1,824$1,250 to $1,499
- 940$1,500 to $1,999
- 36$2,000 to $2,499
- 10$2,500 to $2,999
- 94$3,000 to $3,499
- 51$3,500 or more
- 191No cash rent
Percentage of workers working in this county: 71.7%
Number of people working at home: 7,520 (18.3% of all workers)
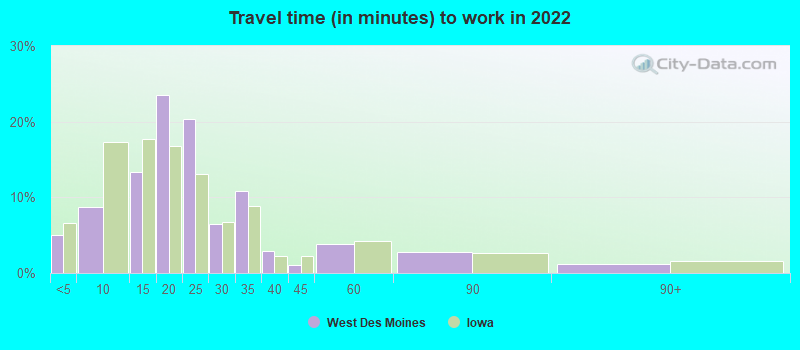
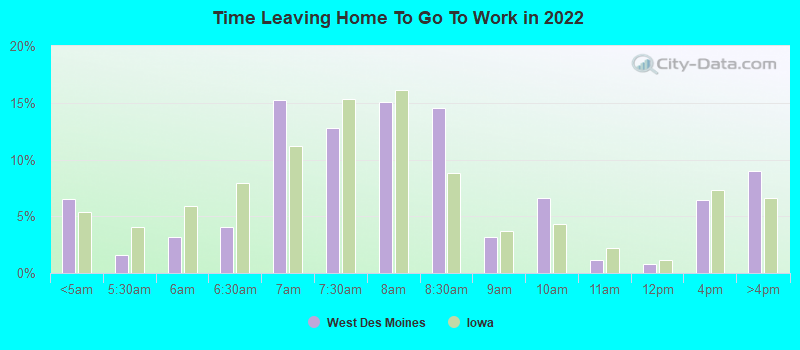
Travel time to work (commute)
- Less than 5 minutes: 2,045
- 5 to 9 minutes: 4,103
- 10 to 14 minutes: 6,306
- 15 to 19 minutes: 8,524
- 20 to 24 minutes: 7,908
- 25 to 29 minutes: 3,026
- 30 to 34 minutes: 1,360
- 35 to 39 minutes: 344
- 40 to 44 minutes: 423
- 45 to 59 minutes: 989
- 60 to 89 minutes: 174
- 90 or more minutes: 223
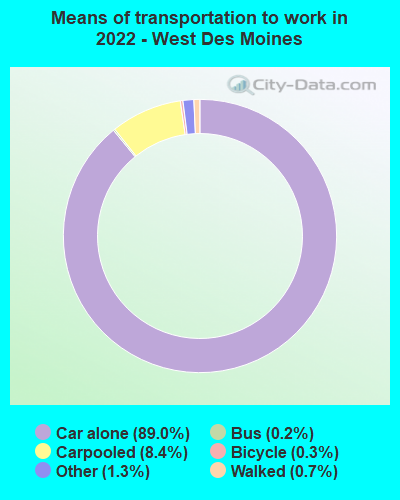
Means of transportation to work:
- Drove a car alone: 45,106 (77.6%)
- Carpooled: 4,041 (7.0%)
- Bus: 76 (0.1%)
- Light rail, streetcar or trolley: 10 (0.0%)
- Taxi: 495 (0.9%)
- Bicycle: 231 (0.4%)
- Walked: 476 (0.8%)
- Worked at home: 7,520 (12.9%)
- Unemployment by race in 2022
- Unemployment rate for White non-Hispanic residents
- 1.0%Males
- 7.0%Females
- Unemployment rate for Black residents
- 3.7%Males
- 1.3%Females
- Unemployment rate for Asian residents
- 0.2%Females
- Unemployment rate for other race residents
- 1.0%Females
- Unemployment rate for two or more race residents
- 4.5%Males
- 3.4%Females
- Unemployment rate for Hispanic or Latino residents
- 0.3%Males
- 1.2%Females
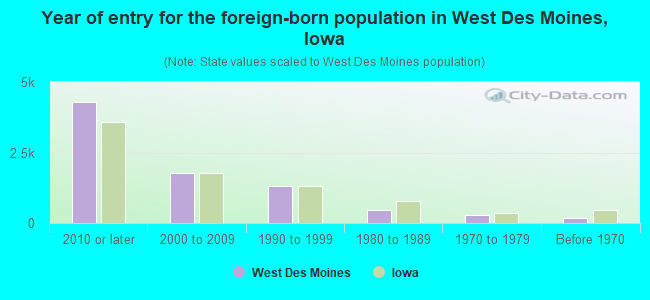
- Year of entry for the foreign-born population in West Des Moines, Iowa
- 4,3062010 or later
- 1,7672000 to 2009
- 1,3161990 to 1999
- 4501980 to 1989
- 2781970 to 1979
- 176Before 1970
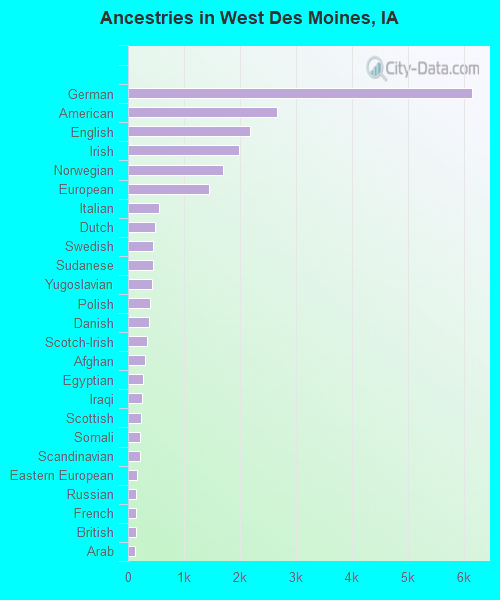
First ancestries reported:
- German: 6,146 (19.2%)
- American: 2,660 (8.3%)
- English: 2,177 (6.8%)
- Irish: 1,981 (6.2%)
- Norwegian: 1,702 (5.3%)
- European: 1,444 (4.5%)
- Italian: 552 (1.7%)
- Dutch: 486 (1.5%)
- Swedish: 445 (1.4%)
- Sudanese: 444 (1.4%)
- Yugoslavian: 427 (1.3%)
- Polish: 388 (1.2%)
- Danish: 372 (1.2%)
- Scotch-Irish: 337 (1.1%)
- Afghan: 312 (1.0%)
- Egyptian: 273 (0.9%)
- Iraqi: 243 (0.8%)
- Scottish: 234 (0.7%)
- Somali: 214 (0.7%)
- Scandinavian: 210 (0.7%)
- Eastern European: 155 (0.5%)
- Russian: 144 (0.4%)
- French: 142 (0.4%)
- British: 137 (0.4%)
- Arab: 123 (0.4%)
- Czech: 116 (0.4%)
- Moroccan: 92 (0.3%)
- African: 90 (0.3%)
- Welsh: 76 (0.2%)
- Macedonian: 73 (0.2%)
- Northern European: 73 (0.2%)
- Nigerian: 68 (0.2%)
- French Canadian: 65 (0.2%)
- Ethiopian: 63 (0.2%)
- Romanian: 61 (0.2%)
- Luxembourger: 58 (0.2%)
- Finnish: 57 (0.2%)
- Ukrainian: 54 (0.2%)
- Lebanese: 49 (0.2%)
- Czechoslovakian: 45 (0.1%)
- Armenian: 39 (0.1%)
- Liberian: 39 (0.1%)
- Canadian: 36 (0.1%)
- Slovak: 32 (0.10%)
- Sierra Leonean: 15 (0.05%)
- Australian: 14 (0.04%)
- Brazilian: 11 (0.03%)
- Hungarian: 11 (0.03%)
- Kenyan: 8 (0.02%)
- Palestinian: 7 (0.02%)
- Croatian: 7 (0.02%)
- Bulgarian: 6 (0.02%)
- Ghanaian: 5 (0.02%)
Most common places of birth for foreign-born residents (%):
| West Des Moines: | 19.9% (1,507) |
| Iowa: | 6.2% (11,148) |
| West Des Moines: | 8.8% (665) |
| Iowa: | 23.3% (41,625) |
| West Des Moines: | 6.9% (526) |
| Iowa: | 0.8% (1,510) |
| West Des Moines: | 6.4% (484) |
| Iowa: | 3.2% (5,751) |
| West Des Moines: | 5.1% (386) |
| Iowa: | 2.9% (5,155) |
| West Des Moines: | 4.6% (346) |
| Iowa: | 4.2% (7,428) |
| West Des Moines: | 3.6% (271) |
| Iowa: | 0.3% (575) |
| West Des Moines: | 3.4% (259) |
| Iowa: | 0.5% (980) |
| West Des Moines: | 3.2% (239) |
| Iowa: | 0.7% (1,326) |
| West Des Moines: | 2.9% (217) |
| Iowa: | 0.7% (1,227) |
| West Des Moines: | 2.7% (207) |
| Iowa: | 2.3% (4,084) |
| West Des Moines: | 2.0% (155) |
| Iowa: | 1.6% (2,873) |
| West Des Moines: | 2.0% (150) |
| Iowa: | 4.6% (8,194) |
| West Des Moines: | 1.9% (142) |
| Iowa: | 2.1% (3,682) |
| West Des Moines: | 1.7% (129) |
| Iowa: | 0.8% (1,425) |
| West Des Moines: | 1.6% (125) |
| Iowa: | 0.5% (862) |
Place of birth for U.S.-born residents:
- This state: 45,608
- Other state: 19,774
- Northeast: 1,477
- Midwest: 11,017
- South: 3,129
- West: 4,151
80.8% of West Des Moines residents lived in the same house 1 years ago.
Out of people who lived in different houses, 29.9% lived in this county.
Out of people who lived in different counties, 57.7% lived in Iowa.
| West Des Moines: | 80.8% |
| State average: | 87.2% |
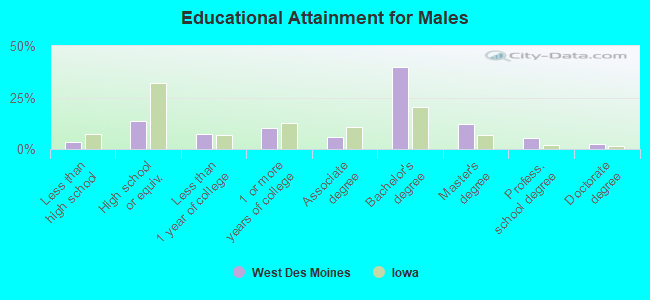
Education attainment for males 25 years and older:
- No schooling: 44
- Nursery to 4th grade: 0
- 5th and 6th grade: 65
- 7th and 8th grade: 89
- 9th grade: 38
- 10th grade: 59
- 11th grade: 62
- 12th grade, no diploma: 493
- High school graduate (or equivalency): 3,329
- Less than 1 year of college: 1,713
- Some college more than 1 year, no degree: 2,435
- Associate degree: 1,416
- Bachelor's degree: 9,702
- Master's degree: 2,960
- Professional school degree: 1,300
- Doctorate degree: 605
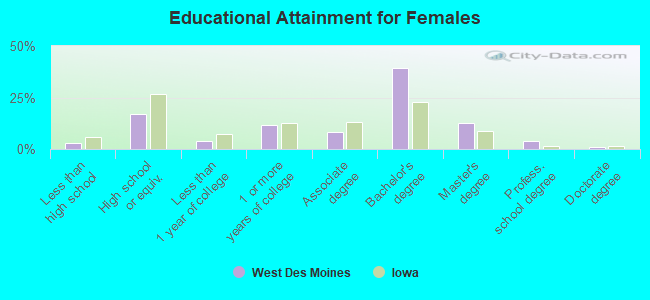
Education attainment for females 25 years and older:
- No schooling: 314
- Nursery to 4th grade: 0
- 5th and 6th grade: 236
- 7th and 8th grade: 0
- 9th grade: 0
- 10th grade: 0
- 11th grade: 0
- 12th grade, no diploma: 144
- High school graduate (or equivalency): 4,259
- Less than 1 year of college: 925
- Some college more than 1 year, no degree: 2,978
- Associate degree: 2,018
- Bachelor's degree: 9,954
- Master's degree: 3,149
- Professional school degree: 923
- Doctorate degree: 286
Housing units in structures:
- One, detached: 16,116
- One, attached: 4,129
- Two: 78
- 3 or 4: 457
- 5 to 9: 2,512
- 10 to 19: 2,402
- 20 to 49: 3,928
- 50 or more: 3,016
- Mobile homes: 305
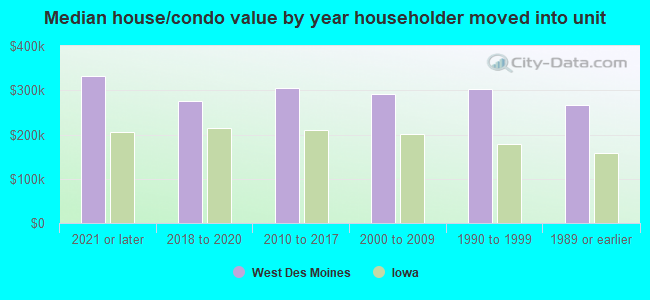
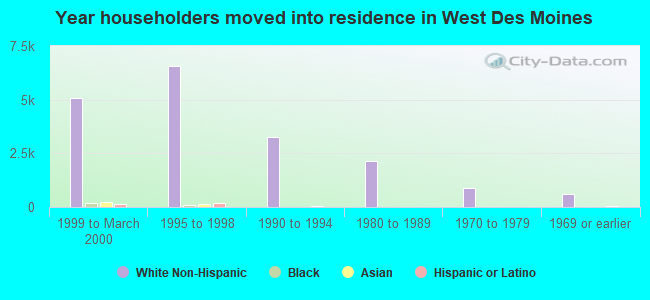
House/condo owner moved in on average 9 years ago
Renter moved in on average 0 years ago
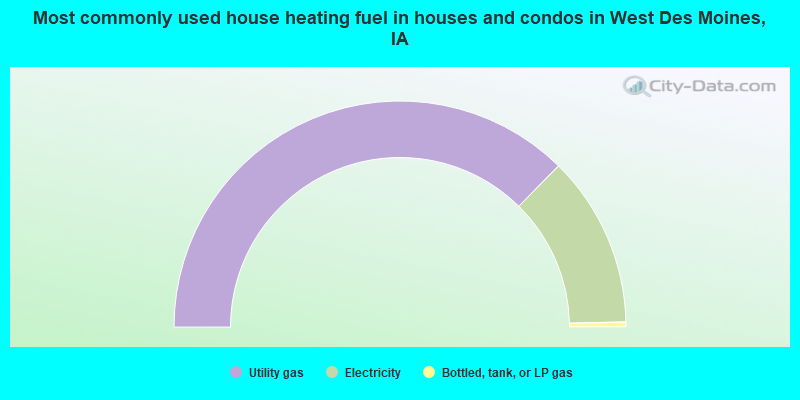
- 74.6%Utility gas
- 24.5%Electricity
- 0.7%Bottled, tank, or LP gas
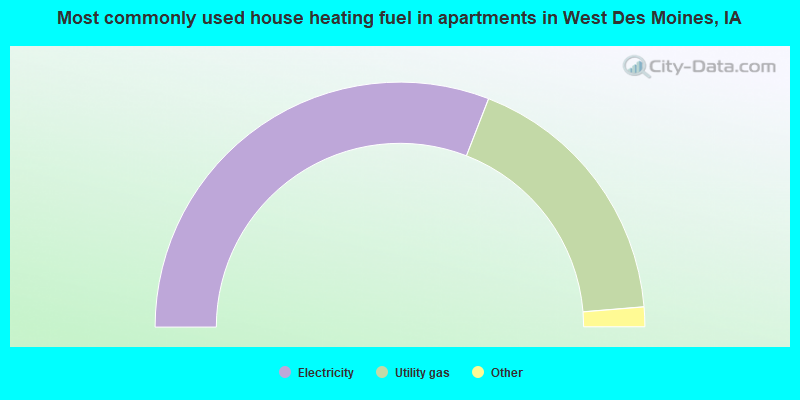
- 61.8%Electricity
- 35.6%Utility gas
- 2.0%Bottled, tank, or LP gas
- 0.3%Other fuel
- 0.2%No fuel used
- 0.1%Fuel oil, kerosene, etc.
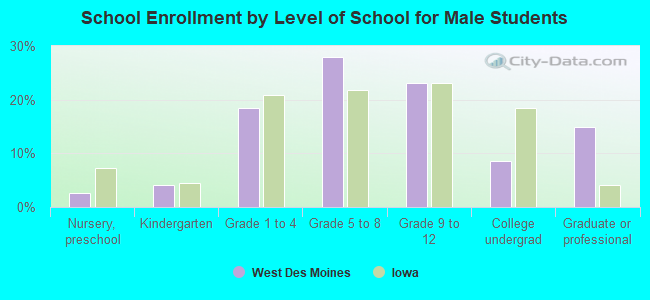
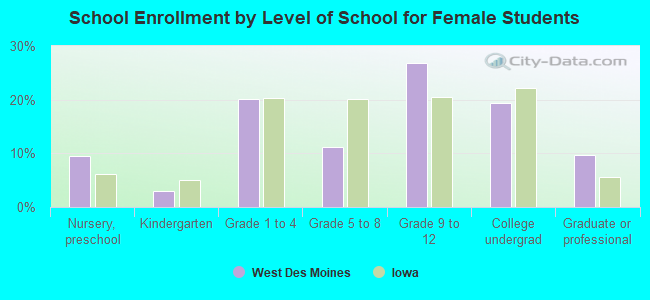
Private vs. public school enrollment:
| Here: | 5.5% |
| Iowa: | 10.6% |
| Here: | 7.3% |
| Iowa: | 7.9% |
| Here: | 14.7% |
| Iowa: | 23.9% |