West Puente Valley, CA (California) Houses and Residents
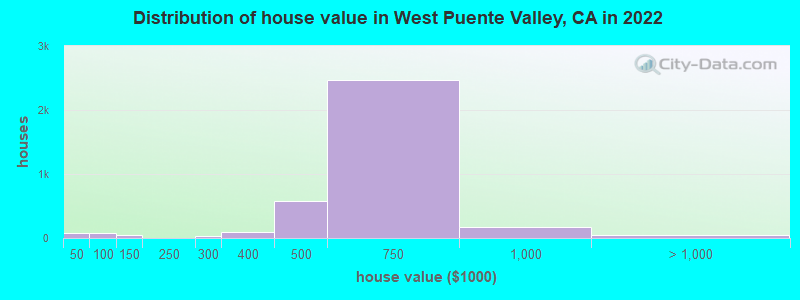
Estimated median house or condo value in 2022: $635,942 (it was $151,200 in 2000 )
West Puente Valley:
$635,942California:
$715,900
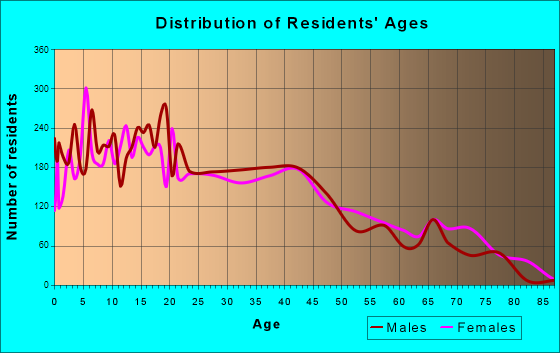
Lower value quartile - upper value quartile: $515,439 - $737,219Total population: 22,636 (All urban)
Houses: 5,320 (5,149 occupied: 4,226 owner occupied, 943 renter occupied )
% of renters here:
18%State:
44%
Housing density: 3,040 houses/condos per square mile
Median price asked for vacant for-sale houses and condos in 2022: $654,582.
Median contract rent in 2022: over $2,000 (lower quartile is $949, upper quartile is over $2,000)
Median rent asked for vacant for-rent units in 2022: $865
Median gross rent in West Puente Valley, CA in 2022: over $2,000
Housing units in West Puente Valley with a mortgage: 2,825 (143 second mortgage, 5 home equity loan, 93 both second mortgage and home equity loan )Houses without a mortgage: 142
Median household income for houses/condos with a mortgage: $107,370
Median household income for apartments without a mortgage: $73,007
Median monthly housing costs: $1,937
Data:
Median house or condo value ($)
Median house or condo value ($ change since 2000)
Median house or condo value ($) - White
Median house or condo value ($) - Black or African American
Median house or condo value ($) - Asian
Median house or condo value ($) - Hispanic or Latino
Median house or condo value ($) - American Indian and Alaska Native
Median house or condo value ($) - Multirace
Median house or condo value ($) - Other Race
Median price asked for mobile homes ($)
Household density (households per square mile)
Mean house or condo value by units in structure - 1, detached ($)
Mean house or condo value by units in structure - 1, attached ($)
Mean house or condo value by units in structure - 2 ($)
Mean house or condo value by units in structure by units in structure - 3 or 4 ($)
Mean house or condo value by units in structure - 5 or more ($)
Mean house or condo value by units in structure - Boat, RV, van, etc. ($)
Mean house or condo value by units in structure - Mobile home ($)
Median contract rent ($)
Median contract rent - Lower quartile ($)
Median contract rent - Upper quartile ($)
Median gross rent ($)
Urban houses (%)
Rural houses (%)
Houses occupied (%)
Houses occupied (% change since 2000)
Houses owner occupied (%)
Houses owner occupied (% change since 2000)
Houses renter occupied (%)
Houses renter occupied (% change since 2000)
Vacant housing units - For rent (%)
Vacant housing units - For rent (% change since 2000)
Vacant housing units - For sale only (%)
Vacant housing units - For sale only (% change since 2000)
Vacant housing units - Rented or sold, not occupied (%)
Vacant housing units - Rented or sold, not occupied (% change since 2000)
Vacant housing units - For seasonal, recreational, or occasional use (%)
Vacant housing units - For seasonal, recreational, or occasional use (% change since 2000)
Vacant housing units - For migrant workers (%)
Vacant housing units - For migrant workers (% change since 2000)
Vacant housing units - Other vacant (%)
Vacant housing units - Other vacant (% change since 2000)
Median monthly housing costs ($)
Median household income for houses/condos with a mortgage ($)
Median household income for houses/condos without a mortgage ($)
Median household income ($)
Median household income ($) - White
Median household income ($) - Black or African American
Median household income ($) - Asian
Median household income ($) - Hispanic or Latino
Median household income ($) - American Indian and Alaska Native
Median household income ($) - Multirace
Median household income ($) - Other Race
Mortgage status - with mortgage (%)
Mortgage status - with second mortgage (%)
Mortgage status - with home equity loan (%)
Mortgage status - with both second mortgage and home equity loan (%)
Mortgage status - without a mortgage (%)
Median year house/condo built
Median year apartment built
Household type by relationship - Male householder living alone (%)
Household type by relationship - Male householder not living alone (%)
Household type by relationship - Female householder living alone (%)
Household type by relationship - Female householder not living alone (%)
Household type by relationship - Opposite-Sex spouse (%)
Household type by relationship - Same-Sex spouse (%)
Household type by relationship - Opposite-Sex unmarried partner (%)
Household type by relationship - Same-Sex unmarried partner (%)
Household type by relationship - In group quarters (%)
Size of family households - 2-person household (%)
Size of family households - 3-person household (%)
Size of family households - 4-person household (%)
Size of family households - 5-person household (%)
Size of family households - 6-person household (%)
Size of family households - 7-or-more-person household (%)
Size of nonfamily households - 1-person household (%)
Size of nonfamily households - 2-person household (%)
Size of nonfamily households - 3-person household (%)
Size of nonfamily households - 4-person household (%)
Size of nonfamily households - 5-person household (%)
Size of nonfamily households - 6-person household (%)
Size of nonfamily households - 7-or-moreperson household (%)
Year house built - Built 2010 or later (%)
Year house built - Built 2000 to 2009 (%)
Year house built - Built 1990 to 1999 (%)
Year house built - Built 1980 to 1989 (%)
Year house built - Built 1970 to 1979 (%)
Year house built - Built 1960 to 1969 (%)
Year house built - Built 1950 to 1959 (%)
Year house built - Built 1940 to 1949 (%)
Year house built - Built 1939 or earlier (%)
Median number of rooms in houses and condos
Median number of rooms in apartments
Median number of bedrooms in owner occupied houses
Mean number of bedrooms in owner occupied houses
Median number of bedrooms in renter occupied houses
Mean number of bedrooms in renter occupied houses
Median number of vehichles in owner occupied houses
Mean number of vehichles in owner occupied houses
Median number of vehichles in renter occupied houses
Mean number of vehichles in renter occupied houses
Rooms in owner-occupied houses - 1 room (%)
Rooms in owner-occupied houses - 2 rooms (%)
Rooms in owner-occupied houses - 3 rooms (%)
Rooms in owner-occupied houses - 4 rooms (%)
Rooms in owner-occupied houses - 5 rooms (%)
Rooms in owner-occupied houses - 6 rooms (%)
Rooms in owner-occupied houses - 7 rooms (%)
Rooms in owner-occupied houses - 8 rooms (%)
Rooms in owner-occupied houses - 9+ rooms (%)
Rooms in renter-occupied houses - 1 room (%)
Rooms in renter-occupied houses - 2 rooms (%)
Rooms in renter-occupied houses - 3 rooms (%)
Rooms in renter-occupied houses - 4 rooms (%)
Rooms in renter-occupied houses - 5 rooms (%)
Rooms in renter-occupied houses - 6 rooms (%)
Rooms in renter-occupied houses - 7 rooms (%)
Rooms in renter-occupied houses - 8 rooms (%)
Rooms in renter-occupied houses - 9+ rooms (%)
Bedrooms in owner-occupied houses - no bedrooms (%)
Bedrooms in owner-occupied houses - 1 bedroom (%)
Bedrooms in owner-occupied houses - 2 bedrooms (%)
Bedrooms in owner-occupied houses - 3 bedrooms (%)
Bedrooms in owner-occupied houses - 4 bedrooms (%)
Bedrooms in owner-occupied houses - 5+ bedrooms (%)
Bedrooms in renter-occupied houses - no bedrooms (%)
Bedrooms in renter-occupied houses - 1 bedroom (%)
Bedrooms in renter-occupied houses - 2 bedrooms (%)
Bedrooms in renter-occupied houses - 3 bedrooms (%)
Bedrooms in renter-occupied houses - 4 bedrooms (%)
Bedrooms in renter-occupied houses - 5+ bedrooms (%)
Vehicles available in owner-occupied houses - no vehicle available (%)
Vehicles available in owner-occupied houses - 1 vehicle available(%)
Vehicles available in owner-occupied houses - 2 Vehicles available (%)
Vehicles available in owner-occupied houses - 3 Vehicles available (%)
Vehicles available in owner-occupied houses - 4 Vehicles available (%)
Vehicles available in owner-occupied houses - 5+ Vehicles available (%)
Vehicles available in renter-occupied houses - no vehicle available (%)
Vehicles available in renter-occupied houses - 1 vehicle available (%)
Vehicles available in renter-occupied houses - 2 Vehicles available (%)
Vehicles available in renter-occupied houses - 3 Vehicles available (%)
Vehicles available in renter-occupied houses - 4 Vehicles available (%)
Vehicles available in renter-occupied houses - 5+ Vehicles available (%)
Housing units in structures - 1, detached (%)
Housing units in structures - 1, attached (%)
Housing units in structures - 2 (%)
Housing units in structures - 3 or 4 (%)
Housing units in structures - 5 to 9 (%)
Housing units in structures - 10 to 19 (%)
Housing units in structures - 20 to 49 (%)
Housing units in structures - 50 or more (%)
Housing units in structures - Mobile home (%)
Housing units in structures - Boat, RV, van, etc. (%)
Housing units in structures - Owners - 1, detached (%)
Housing units in structures - Owners - 1, attached (%)
Housing units in structures - Owners - 2 (%)
Housing units in structures - Owners - 3 or 4 (%)
Housing units in structures - Owners - 5 to 9 (%)
Housing units in structures - Owners - 10 to 19 (%)
Housing units in structures - Owners - 20 to 49 (%)
Housing units in structures - Owners - 50 or more (%)
Housing units in structures - Owners - Mobile home (%)
Housing units in structures - Owners - Boat, RV, van, etc. (%)
Housing units in structures - Renters - 1, detached (%)
Housing units in structures - Renters - 1, attached (%)
Housing units in structures - Renters - 2 (%)
Housing units in structures - Renters - 3 or 4 (%)
Housing units in structures - Renters - 5 to 9 (%)
Housing units in structures - Renters - 10 to 19 (%)
Housing units in structures - Renters - 20 to 49 (%)
Housing units in structures - Renters - 50 or more (%)
Housing units in structures - Renters - Mobile home (%)
Housing units in structures - Renters - Boat, RV, van, etc. (%)
House/condo owner moved in on average (years ago)
Renter moved in on average (years ago)
Year householder moved into unit - Moved in 1999 to March 2000 (%)
Year householder moved into unit - Moved in 1999 to March 2000 (%) - White
Year householder moved into unit - Moved in 1999 to March 2000 (%) - Black or African American
Year householder moved into unit - Moved in 1999 to March 2000 (%) - Asian
Year householder moved into unit - Moved in 1999 to March 2000 (%) - Hispanic or Latino
Year householder moved into unit - Moved in 1999 to March 2000 (%) - American Indian and Alaska Native
Year householder moved into unit - Moved in 1999 to March 2000 (%) - Multirace
Year householder moved into unit - Moved in 1999 to March 2000 (%) - Other Race
Year householder moved into unit - Moved in 1995 to 1998 (%)
Year householder moved into unit - Moved in 1995 to 1998 (%) - White
Year householder moved into unit - Moved in 1995 to 1998 (%) - Black or African American
Year householder moved into unit - Moved in 1995 to 1998 (%) - Asian
Year householder moved into unit - Moved in 1995 to 1998 (%) - Hispanic or Latino
Year householder moved into unit - Moved in 1995 to 1998 (%) - American Indian and Alaska Native
Year householder moved into unit - Moved in 1995 to 1998 (%) - Multirace
Year householder moved into unit - Moved in 1995 to 1998 (%) - Other Race
Year householder moved into unit - Moved in 1990 to 1994 (%)
Year householder moved into unit - Moved in 1990 to 1994 (%) - White
Year householder moved into unit - Moved in 1990 to 1994 (%) - Black or African American
Year householder moved into unit - Moved in 1990 to 1994 (%) - Asian
Year householder moved into unit - Moved in 1990 to 1994 (%) - Hispanic or Latino
Year householder moved into unit - Moved in 1990 to 1994 (%) - American Indian and Alaska Native
Year householder moved into unit - Moved in 1990 to 1994 (%) - Multirace
Year householder moved into unit - Moved in 1990 to 1994 (%) - Other Race
Year householder moved into unit - Moved in 1980 to 1989 (%)
Year householder moved into unit - Moved in 1980 to 1989 (%) - White
Year householder moved into unit - Moved in 1980 to 1989 (%) - Black or African American
Year householder moved into unit - Moved in 1980 to 1989 (%) - Asian
Year householder moved into unit - Moved in 1980 to 1989 (%) - Hispanic or Latino
Year householder moved into unit - Moved in 1980 to 1989 (%) - American Indian and Alaska Native
Year householder moved into unit - Moved in 1980 to 1989 (%) - Multirace
Year householder moved into unit - Moved in 1980 to 1989 (%) - Other Race
Year householder moved into unit - Moved in 1970 to 1979 (%)
Year householder moved into unit - Moved in 1970 to 1979 (%) - White
Year householder moved into unit - Moved in 1970 to 1979 (%) - Black or African American
Year householder moved into unit - Moved in 1970 to 1979 (%) - Asian
Year householder moved into unit - Moved in 1970 to 1979 (%) - Hispanic or Latino
Year householder moved into unit - Moved in 1970 to 1979 (%) - American Indian and Alaska Native
Year householder moved into unit - Moved in 1970 to 1979 (%) - Multirace
Year householder moved into unit - Moved in 1970 to 1979 (%) - Other Race
Year householder moved into unit - Moved in 1969 or earlier (%)
Year householder moved into unit - Moved in 1969 or earlier (%) - White
Year householder moved into unit - Moved in 1969 or earlier (%) - Black or African American
Year householder moved into unit - Moved in 1969 or earlier (%) - Asian
Year householder moved into unit - Moved in 1969 or earlier (%) - Hispanic or Latino
Year householder moved into unit - Moved in 1969 or earlier (%) - American Indian and Alaska Native
Year householder moved into unit - Moved in 1969 or earlier (%) - Multirace
Year householder moved into unit - Moved in 1969 or earlier (%) - Other Race
Housing units lacking complete plumbing facilities (%)
Housing units lacking complete kitchen facilities (%)
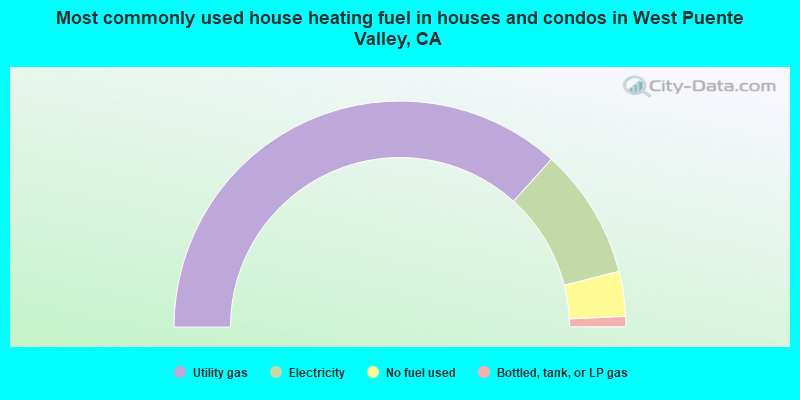
House heating fuel used in houses and condos - Utility gas (%)
House heating fuel used in houses and condos - Bottled, tank, or LP gas (%)
House heating fuel used in houses and condos - Electricity (%)
House heating fuel used in houses and condos - Fuel oil, kerosene, etc. (%)
House heating fuel used in houses and condos - Coal or coke (%)
House heating fuel used in houses and condos - Wood (%)
House heating fuel used in houses and condos - Solar energy (%)
House heating fuel used in houses and condos - Other fuel (%)
House heating fuel used in houses and condos - No fuel used (%)
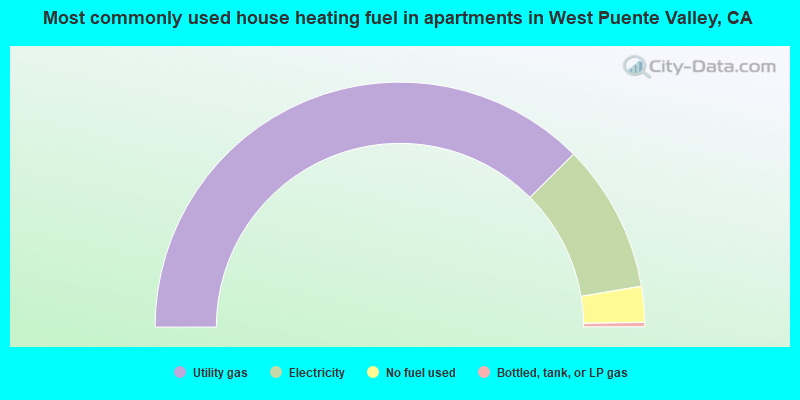
House heating fuel used in apartments - Utility gas (%)
House heating fuel used in apartments - Bottled, tank, or LP gas (%)
House heating fuel used in apartments - Electricity (%)
House heating fuel used in apartments - Fuel oil, kerosene, etc. (%)
House heating fuel used in apartments - Coal or coke (%)
House heating fuel used in apartments - Wood (%)
House heating fuel used in apartments - Solar energy (%)
House heating fuel used in apartments - Other fuel (%)
House heating fuel used in apartments - No fuel used (%)
Median year house/condo built: 1956Median year apartment built: 1959Household type by relationship:
Households: 21,595
Male householders: 2,493 (132 living alone ), Female householders: 2,485 (349 living alone )2,955 spouses (2,899 opposite-sex spouses ), 209 unmarried partners , (209 opposite-sex unmarried partners ), 7,367 children (6,764 natural , 198 adopted , 404 stepchildren ), 1,803 grandchildren , 658 brothers or sisters , 1,091 parents , 37 foster children , 1,311 other relatives , 1,116 non-relatives In group quarters: 64
Size of family households: 985 2-persons , 857 3-persons , 758 4-persons , 701 5-persons , 529 6-persons , 563 7-or-more-persons .
Size of nonfamily households: 516 1-person , 64 2-persons , 58 3-persons , 5 4-persons , 34 7-or-more-persons .
2,150 married couples with children. single-parent households (101 men , 585 women ).
30.1% of residents of West Puente Valley speak English at home. of residents speak Spanish at home (66% speak English very well , 15% speak English well , 14% speak English not well , 6% don't speak English at all ).of residents speak other Indo-European language at home (12% speak English very well , 53% speak English well , 35% speak English not well ).of residents speak Asian or Pacific Island language at home (48% speak English very well , 22% speak English well , 20% speak English not well , 10% don't speak English at all ).of residents speak other language at home (100% don't speak English at all ).
Foreign born population: 8,132 (37.7%)of them are naturalized citizens )
Median number of rooms in houses and condos:
Median number of rooms in apartments
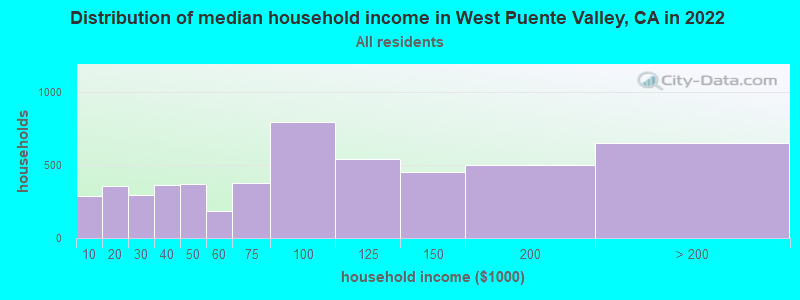
West Puente Valley, CA household income distribution 291 Less than $10,000359 $10,000 to $19,999293 $20,000 to $29,999366 $30,000 to $39,999370 $40,000 to $49,999183 $50,000 to $59,999380 $60,000 to $74,999796 $75,000 to $99,999541 $100,000 to $124,999454 $125,000 to $149,999501 $150,000 to $199,999653 $200,000 or more
Home value of owner - occupied houses in 2022 in West Puente Valley, CA 26 Less than $10,0004 $10,000 to $14,99926 $35,000 to $39,99923 $40,000 to $49,99961 $50,000 to $59,99945 $100,000 to $124,99927 $250,000 to $299,99997 $300,000 to $399,999576 $400,000 to $499,9992,464 $500,000 to $749,999178 $750,000 to $999,9993 $1,000,000 to $1,499,9995 $1,500,000 to $1,999,99943 $2,000,000 or moreRent paid by renters in 2022 in West Puente Valley, CA 16 $200 to $24943 $250 to $2994 $300 to $34912 $400 to $44919 $450 to $49913 $500 to $5499 $550 to $59913 $650 to $69927 $800 to $899103 $900 to $99941 $1,000 to $1,24917 $1,250 to $1,499106 $1,500 to $1,999368 $2,000 to $2,49922 $2,500 to $2,99943 $3,500 or more68 No cash rent
Percentage of workers working in this county: 86.5%Number of people working at home: 802 (8.3% of all workers )
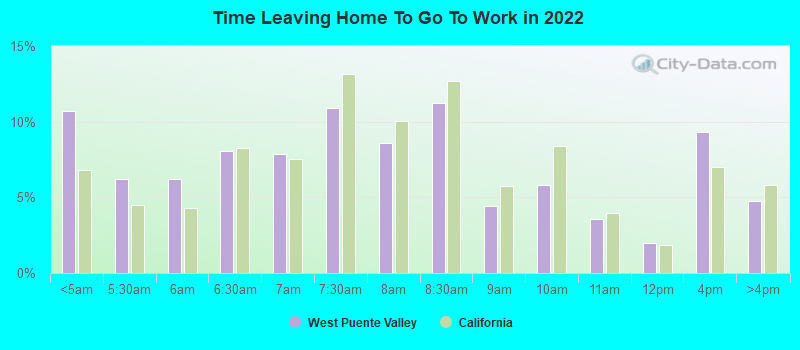
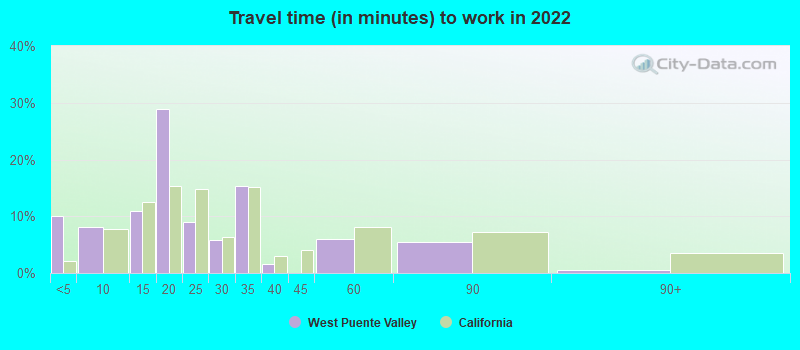
Travel time to work (commute)
Less than 5 minutes: 1105 to 9 minutes: 46310 to 14 minutes: 1,14015 to 19 minutes: 84820 to 24 minutes: 1,29725 to 29 minutes: 34430 to 34 minutes: 1,42235 to 39 minutes: 24640 to 44 minutes: 37545 to 59 minutes: 1,26460 to 89 minutes: 80890 or more minutes: 309
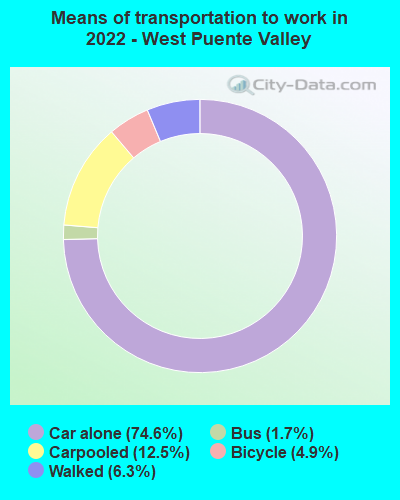
Means of transportation to work:
Drove a car alone: 573 (40.0%)Carpooled: 105 (7.3%)Bus : 12 (0.8%)Bicycle: 39 (2.7%)Walked: 52 (3.6%)Worked at home: 802 (56.0%)
Unemployment by race in 2022
Unemployment rate for White non-Hispanic residents 23.0% Males9.0% FemalesUnemployment rate for Black residents 28.7% MalesUnemployment rate for American Indian and Alaska Native residents 5.0% MalesUnemployment rate for Asian residents 5.5% Males2.9% FemalesUnemployment rate for other race residents 7.7% Males6.6% FemalesUnemployment rate for two or more race residents 3.7% Males5.1% FemalesUnemployment rate for Hispanic or Latino residents 6.2% Males5.7% Females
Year of entry for the foreign-born population in West Puente Valley, California
812 2010 or later 1,101 2000 to 2009 1,371 1990 to 1999 3,137 1980 to 1989 2,458 1970 to 1979 1,768 Before 1970
First ancestries reported:
American: 112 (0.8%)
German: 53 (0.4%)
English: 25 (0.2%)
Dutch: 19 (0.1%)
Italian: 16 (0.1%)
Scotch-Irish: 14 (0.10%)
French Canadian: 13 (0.09%)
French: 8 (0.05%)
European: 7 (0.05%)
Belizean: 7 (0.05%)
Czechoslovakian: 6 (0.04%)
Croatian: 5 (0.03%)
British: 4 (0.03%)
Greek: 1 (0.01%)
Iranian: 1 (0.01%)
African: 1 (0.01%) Most common places of birth for foreign-born residents (%): Mexico West Puente Valley:
60.2% (4,897)California:
37.2% (3,881,193)
Vietnam West Puente Valley:
8.4% (680)California:
4.9% (512,335)
Philippines West Puente Valley:
7.4% (601)California:
7.8% (818,297)
El Salvador West Puente Valley:
7.1% (578)California:
4.2% (440,287)
China, excluding Hong Kong and Taiwan West Puente Valley:
6.3% (510)California:
6.6% (684,672)
Costa Rica West Puente Valley:
2.4% (193)California:
0.1% (12,623)
Place of birth for U.S.-born residents:
This state: 12,376Other state: 705Northeast: 173Midwest: 19South: 331West: 179 96.1% of West Puente Valley residents lived in the same house 1 years ago.
Out of people who lived in different houses, 43.5% lived in this county.
Out of people who lived in different counties, 53.2% lived in California.
West Puente Valley:
96.1%State average:
88.9%
Education attainment for males 25 years and older:
No schooling: 524Nursery to 4th grade: 705th and 6th grade: 2147th and 8th grade: 2719th grade: 15610th grade: 14511th grade: 28612th grade, no diploma: 510High school graduate (or equivalency): 2,454Less than 1 year of college: 561Some college more than 1 year, no degree: 894Associate degree: 384Bachelor's degree: 877Master's degree: 162Professional school degree: 28Doctorate degree: 21
Education attainment for females 25 years and older:
No schooling: 668Nursery to 4th grade: 2045th and 6th grade: 2497th and 8th grade: 1579th grade: 18410th grade: 12611th grade: 14612th grade, no diploma: 393High school graduate (or equivalency): 2,064Less than 1 year of college: 631Some college more than 1 year, no degree: 1,002Associate degree: 368Bachelor's degree: 828Master's degree: 237Professional school degree: 29Doctorate degree: 34
Housing units in structures:
One, detached: 4,861One, attached: 2143 or 4: 910 to 19: 2220 to 49: 2450 or more: 189Housing units lacking complete plumbing facilities in 2022: 0.4%Housing units lacking complete kitchen facilities in 2022: 1.9%House/condo owner moved in on average 21 years ago
Renter moved in on average 6 years ago
Private vs. public school enrollment:
Students in private schools in grades 1 to 8 (elementary and middle school): 117 Here:
5.2%California:
10.5%
Students in private schools in grades 9 to 12 (high school): 131 Here:
12.6%California:
8.5%
Students in private undergraduate colleges: 120 Here:
9.1%California:
15.9%