Westerville, OH (Ohio) Houses and Residents
| Westerville: | $368,621 |
| Ohio: | $204,100 |
Mean price in 2022:
Detached houses: $324,417
Here: $324,417 State: $254,366 Townhouses or other attached units: $229,423
Here: $229,423 State: $225,733 In 3-to-4-unit structures: $158,918
Here: $158,918 State: $203,002 In 5-or-more-unit structures: $138,402
Here: $138,402 State: $211,593
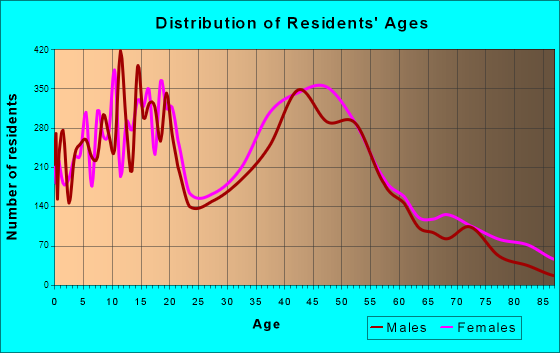
Total population: 37,667 (Urban population: 35,355, Rural population: 53 (all nonfarm))
Houses: 16,054 (15,249 occupied: 11,414 owner occupied, 3,738 renter occupied)
| % of renters here: | 25% |
| State: | 33% |
Housing density: 1,296 houses/condos per square mile
Median price asked for vacant for-sale houses and condos in 2022: $1,636,790.
Median contract rent in 2022: $1,186 (lower quartile is $821, upper quartile is $1,676)
Median rent asked for vacant for-rent units in 2022: $2,390
Median gross rent in Westerville, OH in 2022: $1,411
Housing units in Westerville with a mortgage: 7,713 (930 second mortgage, 24 home equity loan, 851 both second mortgage and home equity loan)
Houses without a mortgage: 179
Median household income for houses/condos with a mortgage: $138,341
Median household income for apartments without a mortgage: $99,943
Median monthly housing costs: $1,581
Compare current foreclosures in Westerville, OH:
| Photo | Address | Area | Beds / Baths | Price | Details |
|---|---|---|---|---|---|

|
#1
Bunch Flower Ct
Westerville, OH 43082
|
3,173 sq. feet
|
2 baths 4 beds |
show details | |

|
#2
Brookstone Dr
Westerville, OH 43082
|
1,783 sq. feet
|
3 baths 3 beds |
show details | |

|
#3
Spohn Dr
Westerville, OH 43081
|
1,040 sq. feet
|
1 baths 3 beds |
show details | |

|
#4
Highplains Ct
Westerville, OH 43081
|
1,992 sq. feet
|
2 baths 4 beds |
show details | |

|
#5
Charleston Way Dr
Westerville, OH 43081
|
1,056 sq. feet
|
2 baths 2 beds |
show details | |

|
#6
Royal County Down
Westerville, OH 43082
|
2,927 sq. feet
|
4 baths 4 beds |
show details | |

|
#7
Barcelona Ave
Westerville, OH 43081
|
2,700 sq. feet
|
2 baths 6 beds |
show details | |

|
#8
Arnett Ct
Westerville, OH 43081
|
1,476 sq. feet
|
1 baths 3 beds |
show details | |

|
#9
Ash Rock Cir
Westerville, OH 43081
|
990 sq. feet
|
2 baths 2 beds |
show details | |

|
#10
Lynette Pl N
Westerville, OH 43081
|
1,838 sq. feet
|
2 baths 4 beds |
show details |
| Photo | Address | Area | Beds / Baths | Price | Details |
|---|---|---|---|---|---|

|
#11
Chatham Ridge Rd
Westerville, OH 43081
|
2,158 sq. feet
|
2 baths 4 beds |
show details | |

|
#12
Linksview Cir
Westerville, OH 43082
|
1,996 sq. feet
|
2 baths 2 beds |
show details | |

|
#13
Madrid Dr
Westerville, OH 43081
|
1,579 sq. feet
|
2 baths 4 beds |
show details | |

|
#14
Applewood Ln
Westerville, OH 43081
|
1,120 sq. feet
|
2 baths 2 beds |
show details | |

|
#15
S Spring Rd
Westerville, OH 43081
|
2,144 sq. feet
|
2 baths 4 beds |
show details | |

|
#16
Bogota Dr
Westerville, OH 43081
|
2,052 sq. feet
|
2 baths 4 beds |
show details | |

|
#17
Linabary Ave
Westerville, OH 43081
|
1,100 sq. feet
|
1 baths 3 beds |
show details | |

|
#18
Valley Quail Blvd S
Westerville, OH 43081
|
1,756 sq. feet
|
2 baths 4 beds |
show details | |

|
#19
Rolling Ridge Way
Westerville, OH 43082
|
2,506 sq. feet
|
2 baths 4 beds |
show details | |

|
#20
Dakar Rd E
Westerville, OH 43081
|
1,155 sq. feet
|
1 baths 3 beds |
show details |
| Photo | Address | Area | Beds / Baths | Price | Details |
|---|---|---|---|---|---|

|
#21
Keene Dr
Westerville, OH 43081
|
2,612 sq. feet
|
4 baths 6 beds |
show details | |

|
#22
Sterling Ct
Westerville, OH 43082
|
2,599 sq. feet
|
2 baths 4 beds |
show details | |

|
#23
Olde Mill Dr
Westerville, OH 43082
|
2,710 sq. feet
|
2 baths 4 beds |
show details | |

|
#24
S Spring Rd
Westerville, OH 43081
|
1,681 sq. feet
|
2 baths 3 beds |
show details | |

|
#25
Moss Rd
Westerville, OH 43082
|
1,112 sq. feet
|
1 baths 2 beds |
show details | |

|
#26
Augusta Woods Ct
Westerville, OH 43082
|
2,954 sq. feet
|
3 baths 4 beds |
show details | |

|
#27
S Otterbein Ave # 1g
Westerville, OH 43081
|
1,008 sq. feet
|
1 baths 2 beds |
show details | |

|
#28
Delaware Dr
Westerville, OH 43081
|
1,770 sq. feet
|
1 baths 3 beds |
show details | |

|
#29
Illinois Ave
Westerville, OH 43081
|
1,120 sq. feet
|
1 baths 3 beds |
show details | |

|
#30
Hilmar Dr
Westerville, OH 43082
|
2,744 sq. feet
|
2 baths 4 beds |
show details |
| Photo | Address | Area | Beds / Baths | Price | Details |
|---|---|---|---|---|---|

|
#31
Africa Rd
Westerville, OH 43082
|
900 sq. feet
|
1 baths 3 beds |
show details | |

|
#32
S Spring Rd
Westerville, OH 43081
|
2,800 sq. feet
|
3 baths 6 beds |
show details | |

|
#33
Philadelphia Dr
Westerville, OH 43081
|
1,478 sq. feet
|
2 baths 3 beds |
show details | |

|
#34
County Line Rd
Westerville, OH 43081
|
1,372 sq. feet
|
1 baths 3 beds |
show details | |

|
#35
Batavia Ct
Westerville, OH 43081
|
1,433 sq. feet
|
1 baths 3 beds |
show details | |

|
#36
Highland Hills Dr
Westerville, OH 43082
|
2,682 sq. feet
|
2 baths 4 beds |
show details | |

|
#37
S Otterbein Ave
Westerville, OH 43081
|
1,608 sq. feet
|
1 baths 3 beds |
show details | |

|
#38
Albany Terrace Way
Westerville, OH 43081
|
1,901 sq. feet
|
2 baths 3 beds |
show details | |

|
#39
Mainsail Dr
Westerville, OH 43081
|
2,542 sq. feet
|
2 baths 4 beds |
show details | |

|
#40
N West St
Westerville, OH 43082
|
1,524 sq. feet
|
1 baths 2 beds |
show details |
| Photo | Address | Area | Beds / Baths | Price | Details |
|---|---|---|---|---|---|

|
#41
Winebrook Dr
Westerville, OH 43081
|
2,131 sq. feet
|
2 baths 3 beds |
show details | |

|
#42
Executive Pkwy Apt 212
Westerville, OH 43081
|
938 sq. feet
|
2 baths 2 beds |
show details | |

|
#43
Cedardale Dr
Westerville, OH 43081
|
1,510 sq. feet
|
2 baths 4 beds |
show details | |

|
#44
Saxman Pl
Westerville, OH 43081
|
- sq. feet
|
- baths - beds |
show details | |

|
#45
Calebs Creek Way
Westerville, OH 43081
|
- sq. feet
|
- baths - beds |
show details | |

|
#46
Enclave Blvd
Westerville, OH 43081
|
- sq. feet
|
- baths - beds |
show details | |

|
#47
Worthington Rd Apt 241
Westerville, OH 43082
|
- sq. feet
|
- baths - beds |
show details | |

|
#48
Bowery Xing
Westerville, OH 43081
|
- sq. feet
|
- baths - beds |
show details | |

|
#49
Harbin Ct
Westerville, OH 43081
|
- sq. feet
|
- baths - beds |
show details | |

|
Check over 1 million property listings on Foreclosure.com!
|
browse all offers | |||

Latest news about housing in Westerville, OH collected exclusively by city-data.com from local newspapers, TV, and radio stations

 | Where should I buy a house/condo around here? (84 replies) |
| Rental Homes - Westerville - Worthington (3 replies) |
| Blendon Woods condos (2 replies) |
| Blendon Woods/Gahanna/Blacklick area condos? (2 replies) |
| Condos in Columbus on N. High Street, near OSU.. why so expensive? (6 replies) |
| 22 yr old, single male; seeking apartments near Westerville (2 replies) |
Median year apartment built: 1988
Household type by relationship:
Households: 39,019- Male householders: 7,533 (1,176 living alone), Female householders: 7,446 (2,367 living alone)
9,316 spouses (9,301 opposite-sex spouses), 467 unmarried partners, (443 opposite-sex unmarried partners), 10,752 children (10,071 natural, 264 adopted, 416 stepchildren), 425 grandchildren, 210 brothers or sisters, 279 parents, 0 foster children, 175 other relatives, 633 non-relatives
- In group quarters: 1,776
Size of family households: 4,983 2-persons, 2,727 3-persons, 2,205 4-persons, 587 5-persons, 215 6-persons, 30 7-or-more-persons.
Size of nonfamily households: 3,698 1-person, 438 2-persons, 91 3-persons, 25 6-persons.
6,934 married couples with children.
1,491 single-parent households (387 men, 1,104 women).
91.6% of residents of Westerville speak English at home.
1.3% of residents speak Spanish at home (77% speak English very well, 9% speak English well, 5% speak English not well, 9% don't speak English at all).
2.6% of residents speak other Indo-European language at home (90% speak English very well, 6% speak English well, 4% speak English not well, 1% don't speak English at all).
2.1% of residents speak Asian or Pacific Island language at home (55% speak English very well, 15% speak English well, 27% speak English not well, 3% don't speak English at all).
2.4% of residents speak other language at home (96% speak English very well, 2% speak English well, 2% speak English not well).
Foreign born population: 2,632 (6.7%)
(63.6% of them are naturalized citizens)
| Here: | 7.9 |
| State: | 6.7 |
| Here: | 4.0 |
| State: | 4.4 |

- Bedrooms in owner-occupied houses and condos in Westerville, Ohio
- 29no bedroom
- 1101 bedroom
- 1,1242 bedrooms
- 3,9773 bedrooms
- 5,5194 bedrooms
- 6555+ bedrooms

- Bedrooms in renter-occupied apartments in Westerville, Ohio
- 180no bedroom
- 7891 bedroom
- 1,8742 bedrooms
- 7953 bedrooms
- 864 bedrooms
- 155+ bedrooms

- Cars and other vehicles available in Westerville in owner-occupied houses/condos
- 82no vehicle
- 2,6361 vehicle
- 6,1392 vehicles
- 1,9483 vehicles
- 3744 vehicles
- 2355+ vehicles

- Cars and other vehicles available in Westerville in renter-occupied apartments
- 667no vehicle
- 1,5651 vehicle
- 1,2912 vehicles
- 1283 vehicles
- 154 vehicles
- 725+ vehicles

- Rooms in owner-occupied houses in Westerville, Ohio
- 291 room
- 02 rooms
- 1263 rooms
- 2994 rooms
- 1,1425 rooms
- 1,0386 rooms
- 2,1687 rooms
- 2,4728 rooms
- 4,1419+ rooms

- Rooms in renter-occupied apartments in Westerville, Ohio
- 1801 room
- 2612 rooms
- 6343 rooms
- 1,2464 rooms
- 7225 rooms
- 3906 rooms
- 1527 rooms
- 598 rooms
- 969+ rooms


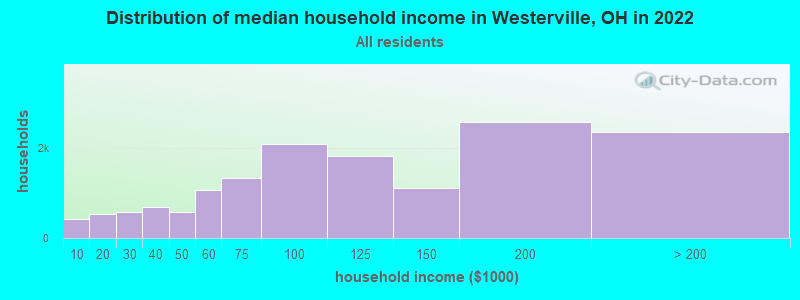
Westerville, OH household income distribution

- 421Less than $10,000
- 533$10,000 to $19,999
- 567$20,000 to $29,999
- 680$30,000 to $39,999
- 583$40,000 to $49,999
- 1,066$50,000 to $59,999
- 1,325$60,000 to $74,999
- 2,086$75,000 to $99,999
- 1,810$100,000 to $124,999
- 1,115$125,000 to $149,999
- 2,574$150,000 to $199,999
- 2,351$200,000 or more
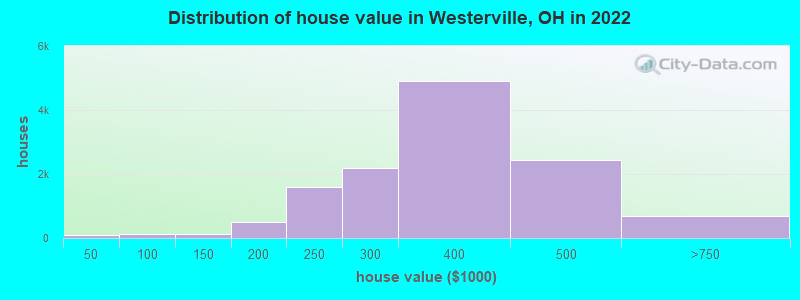
Home value of owner - occupied houses in 2022 in Westerville, OH
-
- 75Less than $10,000
- 11$30,000 to $34,999
- 7$40,000 to $49,999
- 28$50,000 to $59,999
- 20$70,000 to $79,999
- 40$80,000 to $89,999
- 23$90,000 to $99,999
- 74$100,000 to $124,999
- 58$125,000 to $149,999
- 149$150,000 to $174,999
- 364$175,000 to $199,999
- 1,583$200,000 to $249,999
- 2,187$250,000 to $299,999
- 4,914$300,000 to $399,999
- 2,434$400,000 to $499,999
- 659$500,000 to $749,999
- 13$750,000 to $999,999
- 19$1,000,000 to $1,499,999
Rent paid by renters in 2022 in Westerville, OH
-
- 20$150 to $199
- 56$250 to $299
- 38$300 to $349
- 12$350 to $399
- 36$400 to $449
- 6$450 to $499
- 6$500 to $549
- 60$550 to $599
- 71$600 to $649
- 103$650 to $699
- 114$700 to $749
- 298$750 to $799
- 173$800 to $899
- 243$900 to $999
- 761$1,000 to $1,249
- 546$1,250 to $1,499
- 688$1,500 to $1,999
- 243$2,000 to $2,499
- 9$2,500 to $2,999
- 12$3,000 to $3,499
- 158$3,500 or more
- 172No cash rent


Percentage of workers working in this county: 73.4%
Number of people working at home: 5,757 (29.4% of all workers)
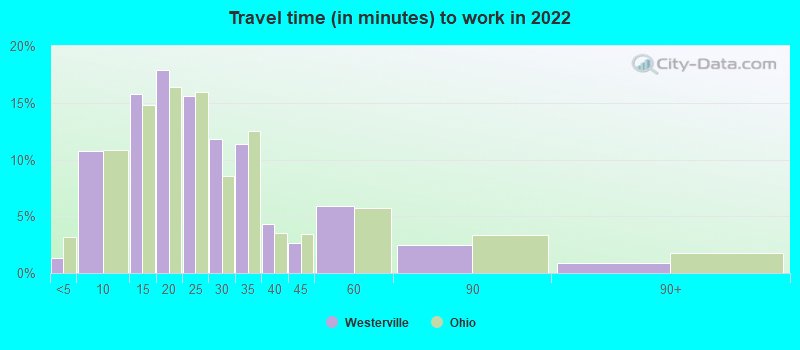
Travel time to work (commute)
- Less than 5 minutes: 363
- 5 to 9 minutes: 1,965
- 10 to 14 minutes: 2,025
- 15 to 19 minutes: 2,340
- 20 to 24 minutes: 2,935
- 25 to 29 minutes: 1,703
- 30 to 34 minutes: 1,438
- 35 to 39 minutes: 353
- 40 to 44 minutes: 338
- 45 to 59 minutes: 645
- 60 to 89 minutes: 214
- 90 or more minutes: 106
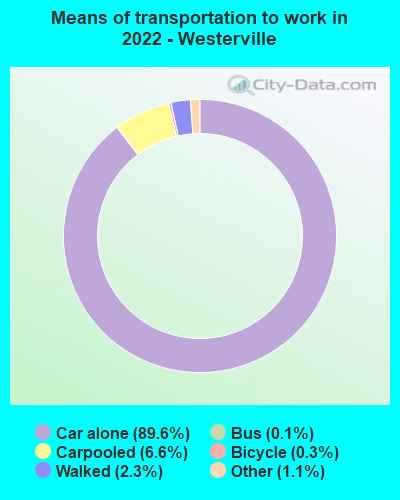
Means of transportation to work:
- Drove a car alone: 22,567 (72.2%)
- Carpooled: 1,939 (6.2%)
- Bus: 35 (0.1%)
- Taxi: 342 (1.1%)
- Bicycle: 94 (0.3%)
- Walked: 509 (1.6%)
- Worked at home: 5,757 (18.4%)

- Unemployment by race in 2022
- Unemployment rate for White non-Hispanic residents
- 2.9%Males
- 1.1%Females
- Unemployment rate for Black residents
- 2.2%Females
- Unemployment rate for two or more race residents
- 2.7%Males
- 8.2%Females
- Unemployment rate for Hispanic or Latino residents
- 1.0%Males

- Year of entry for the foreign-born population in Westerville, Ohio
- 7302010 or later
- 8072000 to 2009
- 5391990 to 1999
- 2561980 to 1989
- 1631970 to 1979
- 323Before 1970
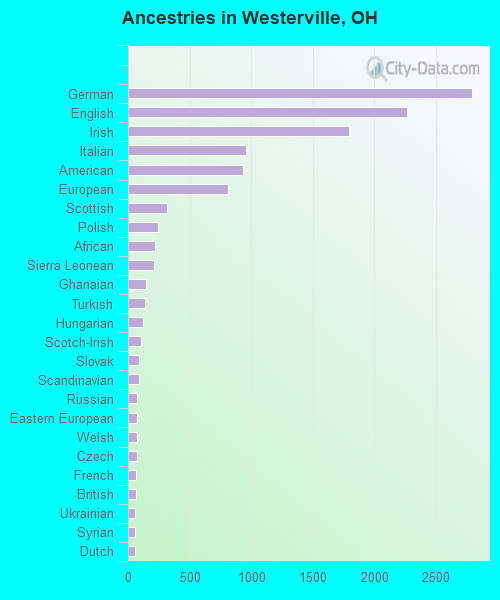
First ancestries reported:
- German: 2,794 (17.4%)
- English: 2,268 (14.1%)
- Irish: 1,795 (11.2%)
- Italian: 960 (6.0%)
- American: 936 (5.8%)
- European: 811 (5.1%)
- Scottish: 317 (2.0%)
- Polish: 242 (1.5%)
- African: 220 (1.4%)
- Sierra Leonean: 212 (1.3%)
- Ghanaian: 144 (0.9%)
- Turkish: 138 (0.9%)
- Hungarian: 124 (0.8%)
- Scotch-Irish: 109 (0.7%)
- Slovak: 90 (0.6%)
- Scandinavian: 86 (0.5%)
- Russian: 76 (0.5%)
- Eastern European: 75 (0.5%)
- Welsh: 73 (0.5%)
- Czech: 70 (0.4%)
- French: 67 (0.4%)
- British: 64 (0.4%)
- Ukrainian: 56 (0.3%)
- Syrian: 53 (0.3%)
- Dutch: 53 (0.3%)
- Romanian: 53 (0.3%)
- Egyptian: 48 (0.3%)
- Nigerian: 47 (0.3%)
- Somali: 41 (0.3%)
- Swedish: 38 (0.2%)
- Greek: 38 (0.2%)
- Czechoslovakian: 29 (0.2%)
- Zimbabwean: 22 (0.1%)
- Northern European: 22 (0.1%)
- Swiss: 19 (0.1%)
- Palestinian: 18 (0.1%)
- Danish: 17 (0.1%)
- Lebanese: 17 (0.1%)
- Cajun: 14 (0.09%)
- Iranian: 13 (0.08%)
- Lithuanian: 12 (0.07%)
- Jamaican: 12 (0.07%)
- Austrian: 10 (0.06%)
- Slovene: 10 (0.06%)
- Arab: 8 (0.05%)
- Canadian: 6 (0.04%)
- Moroccan: 4 (0.02%)
- Norwegian: 4 (0.02%)
- West Indian: 3 (0.02%)
- Finnish: 1 (0.01%)
Most common places of birth for foreign-born residents (%):
| Westerville: | 15.2% (390) |
| Ohio: | 1.8% (10,561) |
| Westerville: | 7.6% (195) |
| Ohio: | 1.2% (7,029) |
| Westerville: | 7.4% (189) |
| Ohio: | 1.9% (10,960) |
| Westerville: | 7.3% (187) |
| Ohio: | 6.2% (35,703) |
| Westerville: | 6.4% (164) |
| Ohio: | 11.6% (66,525) |
| Westerville: | 5.5% (142) |
| Ohio: | 0.3% (1,897) |
| Westerville: | 4.9% (127) |
| Ohio: | 0.5% (2,658) |
| Westerville: | 4.0% (103) |
| Ohio: | 0.1% (700) |
| Westerville: | 3.1% (79) |
| Ohio: | 2.6% (14,988) |
| Westerville: | 3.0% (78) |
| Ohio: | 1.0% (5,979) |
| Westerville: | 3.0% (78) |
| Ohio: | 0.9% (5,101) |
| Westerville: | 3.0% (78) |
| Ohio: | 7.8% (44,796) |
| Westerville: | 3.0% (77) |
| Ohio: | 2.0% (11,398) |
| Westerville: | 2.8% (73) |
| Ohio: | 2.2% (12,846) |
| Westerville: | 2.2% (56) |
| Ohio: | 1.9% (10,777) |
Place of birth for U.S.-born residents:
- This state: 26,276
- Other state: 9,733
- Northeast: 2,441
- Midwest: 3,025
- South: 3,259
- West: 1,027
88.5% of Westerville residents lived in the same house 1 years ago.
Out of people who lived in different houses, 31.4% lived in this county.
Out of people who lived in different counties, 66.8% lived in Ohio.
| Westerville: | 88.5% |
| State average: | 87.8% |
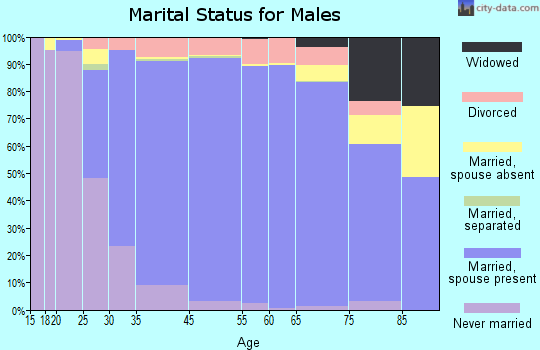
Education attainment for males 25 years and older:
- No schooling: 53
- Nursery to 4th grade: 32
- 5th and 6th grade: 20
- 7th and 8th grade: 5
- 9th grade: 27
- 10th grade: 12
- 11th grade: 24
- 12th grade, no diploma: 111
- High school graduate (or equivalency): 2,206
- Less than 1 year of college: 622
- Some college more than 1 year, no degree: 1,571
- Associate degree: 733
- Bachelor's degree: 3,959
- Master's degree: 2,312
- Professional school degree: 710
- Doctorate degree: 155

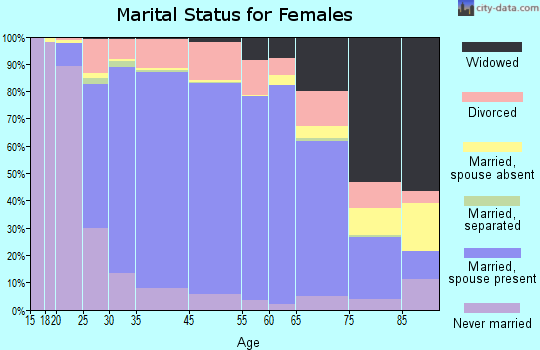
Education attainment for females 25 years and older:
- No schooling: 80
- Nursery to 4th grade: 0
- 5th and 6th grade: 0
- 7th and 8th grade: 9
- 9th grade: 36
- 10th grade: 77
- 11th grade: 75
- 12th grade, no diploma: 90
- High school graduate (or equivalency): 2,063
- Less than 1 year of college: 690
- Some college more than 1 year, no degree: 1,450
- Associate degree: 1,108
- Bachelor's degree: 4,853
- Master's degree: 3,186
- Professional school degree: 304
- Doctorate degree: 393

Housing units in structures:
- One, detached: 10,994
- One, attached: 1,574
- Two: 447
- 3 or 4: 518
- 5 to 9: 521
- 10 to 19: 627
- 20 to 49: 450
- 50 or more: 898
- Mobile homes: 22
Housing units lacking complete kitchen facilities in 2022: 2.7%
House/condo owner moved in on average 14 years ago
Renter moved in on average 4 years ago

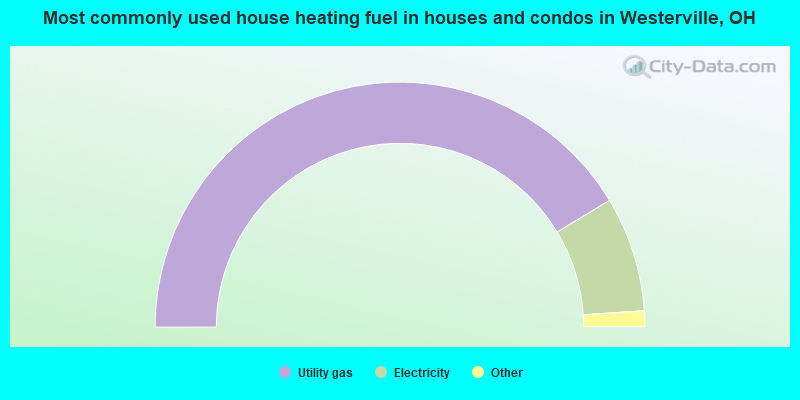
- 82.7%Utility gas
- 15.2%Electricity
- 1.3%Bottled, tank, or LP gas
- 0.7%Wood
- 0.1%Fuel oil, kerosene, etc.
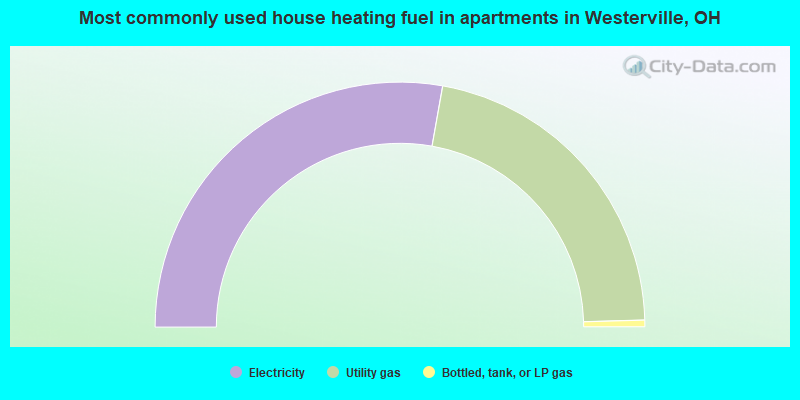
- 55.6%Electricity
- 43.5%Utility gas
- 0.9%Bottled, tank, or LP gas
Private vs. public school enrollment:
| Here: | 17.3% |
| Ohio: | 16.0% |
| Here: | 11.8% |
| Ohio: | 13.1% |
| Here: | 38.5% |
| Ohio: | 22.3% |


