Westland, MI (Michigan) Houses and Residents
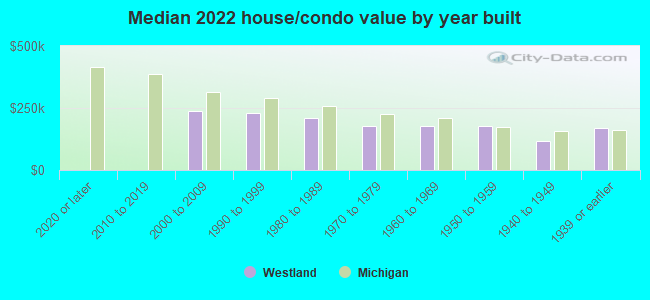
| Westland: | $178,400 |
| Michigan: | $224,400 |
Mean price in 2022:
Detached houses: $196,336
Here: $196,336 State: $280,038 Townhouses or other attached units: $141,148
Here: $141,148 State: $239,520 In 2-unit structures: $148,599
Here: $148,599 State: $219,481 In 3-to-4-unit structures: $174,912
Here: $174,912 State: $207,067 In 5-or-more-unit structures: $166,076
Here: $166,076 State: $192,733 Mobile homes: $63,680
Here: $63,680 State: $72,868
Total population: 82,314 (All urban)
Houses: 39,924 (36,981 occupied: 21,768 owner occupied, 15,213 renter occupied)
| % of renters here: | 41% |
| State: | 27% |
Housing density: 1,952 houses/condos per square mile
Median price asked for vacant for-sale houses and condos in 2022: $99,774.
Median contract rent in 2022: $927 (lower quartile is $776, upper quartile is $1,131)
Median rent asked for vacant for-rent units in 2022: $2,033
Median gross rent in Westland, MI in 2022: $1,081
Housing units in Westland with a mortgage: 14,392 (1,108 second mortgage, 0 home equity loan, 1,108 both second mortgage and home equity loan)
Houses without a mortgage: 601
Median household income for houses/condos with a mortgage: $83,586
Median household income for apartments without a mortgage: $57,068
Median monthly housing costs: $1,054
Compare current foreclosures in Westland, MI:
| Photo | Address | Area | Beds / Baths | Price | Details |
|---|---|---|---|---|---|

|
#1
S Hawthorne St
Westland, MI 48186
|
943 sq. feet
|
1 baths 3 beds |
show details | |

|
#2
Martin St
Westland, MI 48186
|
1,144 sq. feet
|
1 baths 3 beds |
show details | |

|
#3
Parkwood St
Westland, MI 48186
|
882 sq. feet
|
1 baths 3 beds |
show details | |

|
#4
Shacket St
Westland, MI 48185
|
1,039 sq. feet
|
2 baths 3 beds |
show details | |

|
#5
Somerset St
Westland, MI 48186
|
981 sq. feet
|
2 baths 3 beds |
show details | |

|
#6
Ann Arbor Trl
Westland, MI 48185
|
1,583 sq. feet
|
1 baths 3 beds |
show details | |

|
#7
Windham St
Westland, MI 48186
|
907 sq. feet
|
2 baths 2 beds |
show details | |

|
#8
Glen St
Westland, MI 48186
|
1,374 sq. feet
|
2 baths 2 beds |
show details | |

|
#9
Cherrywood Dr
Westland, MI 48185
|
2,082 sq. feet
|
2 baths 3 beds |
show details | |

|
#10
Palmer Rd
Westland, MI 48186
|
1,316 sq. feet
|
1 baths 3 beds |
show details |
| Photo | Address | Area | Beds / Baths | Price | Details |
|---|---|---|---|---|---|

|
#11
Golfview Ln
Westland, MI 48186
|
2,003 sq. feet
|
2 baths 3 beds |
show details | |

|
#12
Chirrewa St
Westland, MI 48185
|
1,026 sq. feet
|
1 baths 3 beds |
show details | |

|
#13
Culpepper Ct # 12
Westland, MI 48185
|
1,724 sq. feet
|
1 baths 2 beds |
show details | |

|
#14
Avondale St
Westland, MI 48186
|
1,020 sq. feet
|
1 baths 3 beds |
show details | |

|
#15
Donnelly St
Westland, MI 48185
|
936 sq. feet
|
1 baths 3 beds |
show details | |

|
#16
Webster St
Westland, MI 48185
|
1,221 sq. feet
|
2 baths 3 beds |
show details | |

|
#17
Alper St
Westland, MI 48185
|
984 sq. feet
|
1 baths 3 beds |
show details | |

|
#18
Daniel Ave # 19
Westland, MI 48186
|
1,238 sq. feet
|
2 baths 2 beds |
show details | |

|
#19
Thames St
Westland, MI 48186
|
1,376 sq. feet
|
1 baths - beds |
show details | |

|
#20
Van Sull St
Westland, MI 48185
|
1,020 sq. feet
|
1 baths - beds |
show details |
| Photo | Address | Area | Beds / Baths | Price | Details |
|---|---|---|---|---|---|

|
#21
Hanover Blvd
Westland, MI 48186
|
987 sq. feet
|
1 baths - beds |
show details | |

|
#22
Lonnie Dr
Westland, MI 48185
|
1,095 sq. feet
|
1 baths - beds |
show details | |

|
#23
N Karle St
Westland, MI 48185
|
1,010 sq. feet
|
1 baths - beds |
show details | |

|
#24
Marshall Dr
Westland, MI 48186
|
1,649 sq. feet
|
2 baths - beds |
show details | |

|
#25
Mackenzie Dr
Westland, MI 48185
|
1,921 sq. feet
|
1 baths - beds |
show details | |

|
#26
Gray St
Westland, MI 48185
|
1,612 sq. feet
|
1 baths - beds |
show details | |

|
#27
Barrington St
Westland, MI 48186
|
1,330 sq. feet
|
1 baths - beds |
show details | |

|
#28
S Henry Ruff Rd
Westland, MI 48186
|
955 sq. feet
|
1 baths - beds |
show details | |

|
#29
N Walton St
Westland, MI 48185
|
1,374 sq. feet
|
1 baths - beds |
show details | |

|
#30
Herbert St
Westland, MI 48185
|
884 sq. feet
|
1 baths - beds |
show details |
| Photo | Address | Area | Beds / Baths | Price | Details |
|---|---|---|---|---|---|

|
#31
Michael Dr
Westland, MI 48186
|
2,103 sq. feet
|
2 baths - beds |
show details | |

|
#32
Stieber St
Westland, MI 48186
|
648 sq. feet
|
1 baths - beds |
show details | |

|
#33
Van Sull St
Westland, MI 48185
|
1,216 sq. feet
|
1 baths - beds |
show details | |

|
#34
Ferraina Dr
Westland, MI 48185
|
1,603 sq. feet
|
3 baths - beds |
show details | |

|
#35
Avondale St
Westland, MI 48186
|
1,312 sq. feet
|
1 baths - beds |
show details | |

|
#36
Milburn St
Westland, MI 48185
|
1,140 sq. feet
|
1 baths - beds |
show details | |

|
#37
Stockmeyer Blvd
Westland, MI 48186
|
1,319 sq. feet
|
2 baths - beds |
show details | |

|
#38
N Wildwood St
Westland, MI 48185
|
2,432 sq. feet
|
1 baths - beds |
show details | |

|
#39
Birchwood St
Westland, MI 48186
|
963 sq. feet
|
1 baths - beds |
show details | |

|
#40
Parkwood St
Westland, MI 48186
|
1,105 sq. feet
|
1 baths - beds |
show details |
| Photo | Address | Area | Beds / Baths | Price | Details |
|---|---|---|---|---|---|

|
#41
Haller St
Westland, MI 48185
|
965 sq. feet
|
1 baths - beds |
show details | |

|
#42
Herbert St
Westland, MI 48185
|
840 sq. feet
|
1 baths - beds |
show details | |

|
#43
Donna St
Westland, MI 48185
|
1,341 sq. feet
|
1 baths - beds |
show details | |

|
#44
Fairchild St
Westland, MI 48186
|
1,277 sq. feet
|
1 baths - beds |
show details | |

|
#45
Van Sull St
Westland, MI 48185
|
1,200 sq. feet
|
1 baths - beds |
show details | |

|
#46
Stockmeyer Blvd
Westland, MI 48186
|
1,476 sq. feet
|
2 baths - beds |
show details | |

|
#47
Easley Dr
Westland, MI 48186
|
1,007 sq. feet
|
1 baths - beds |
show details | |

|
#48
Union Ct
Westland, MI 48186
|
1,098 sq. feet
|
1 baths - beds |
show details | |

|
#49
Cherry Hill Rd
Westland, MI 48186
|
1,222 sq. feet
|
1 baths - beds |
show details | |

|
Check over 1 million property listings on Foreclosure.com!
|
browse all offers | |||

Latest news about housing in Westland, MI collected exclusively by city-data.com from local newspapers, TV, and radio stations

 | Apartments near UofM (14 replies) |
| Apartments close to Novi (10 replies) |
| Apartments in Dearborn, Livonia and Canton (3 replies) |
| Husband got a job in ford dearborn. Looking for apartments where most indians live. (33 replies) |
| Apt rentals: Novi vs West Bloomfield? (24 replies) |
| Please recommend a Detroit area to a mid 30s native couple who have been spoiled by the west coast! (35 replies) |
Median year apartment built: 1974
Household type by relationship:
Households: 84,023- Male householders: 18,596 (7,650 living alone), Female householders: 18,385 (6,943 living alone)
12,224 spouses (11,873 opposite-sex spouses), 3,517 unmarried partners, (3,212 opposite-sex unmarried partners), 23,219 children (21,727 natural, 245 adopted, 1,247 stepchildren), 1,710 grandchildren, 489 brothers or sisters, 573 parents, 0 foster children, 916 other relatives, 3,565 non-relatives
- In group quarters: 829
Size of family households: 9,453 2-persons, 4,050 3-persons, 2,758 4-persons, 1,330 5-persons, 468 6-persons, 682 7-or-more-persons.
Size of nonfamily households: 14,593 1-person, 3,256 2-persons, 391 3-persons.
8,643 married couples with children.
4,975 single-parent households (1,388 men, 3,587 women).
86.9% of residents of Westland speak English at home.
2.9% of residents speak Spanish at home (66% speak English very well, 20% speak English well, 11% speak English not well, 3% don't speak English at all).
4.0% of residents speak other Indo-European language at home (54% speak English very well, 29% speak English well, 12% speak English not well, 4% don't speak English at all).
2.1% of residents speak Asian or Pacific Island language at home (67% speak English very well, 27% speak English well, 5% speak English not well, 1% don't speak English at all).
3.4% of residents speak other language at home (56% speak English very well, 33% speak English well, 11% speak English not well).
Foreign born population: 5,584 (6.6%)
(70.3% of them are naturalized citizens)
| Here: | 5.9 |
| State: | 6.5 |
| Here: | 4.0 |
| State: | 4.3 |
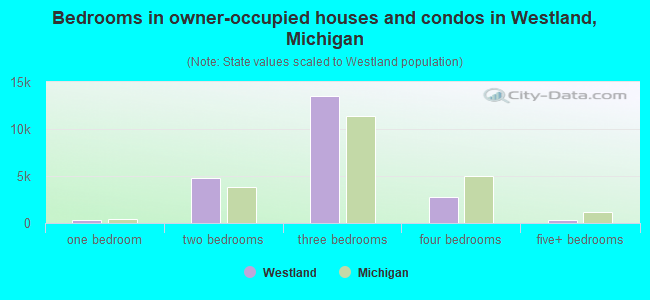
- Bedrooms in owner-occupied houses and condos in Westland, Michigan
- 0no bedroom
- 3281 bedroom
- 4,7822 bedrooms
- 13,4863 bedrooms
- 2,8104 bedrooms
- 3625+ bedrooms
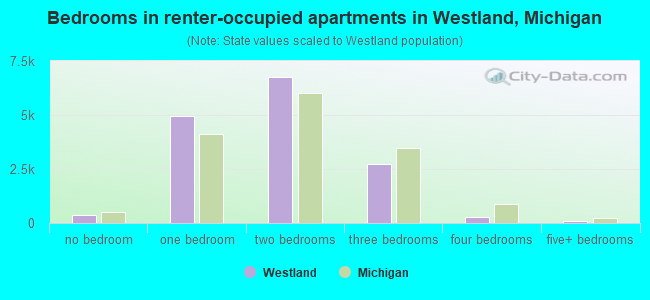
- Bedrooms in renter-occupied apartments in Westland, Michigan
- 383no bedroom
- 4,9591 bedroom
- 6,7802 bedrooms
- 2,7473 bedrooms
- 2734 bedrooms
- 715+ bedrooms
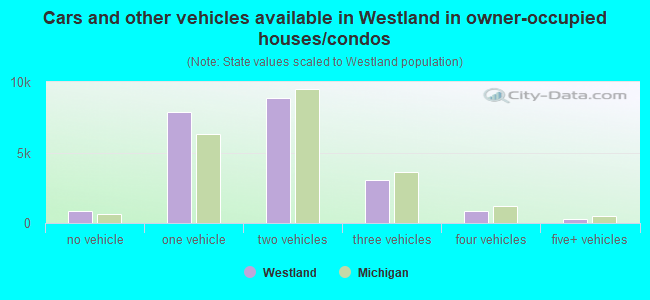
- Cars and other vehicles available in Westland in owner-occupied houses/condos
- 834no vehicle
- 7,8641 vehicle
- 8,8652 vehicles
- 3,0643 vehicles
- 8834 vehicles
- 2585+ vehicles
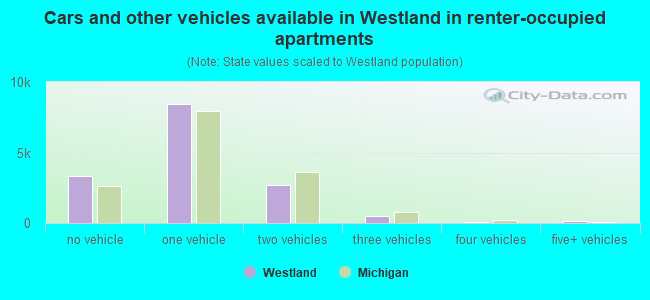
- Cars and other vehicles available in Westland in renter-occupied apartments
- 3,345no vehicle
- 8,4271 vehicle
- 2,6802 vehicles
- 5273 vehicles
- 904 vehicles
- 1445+ vehicles
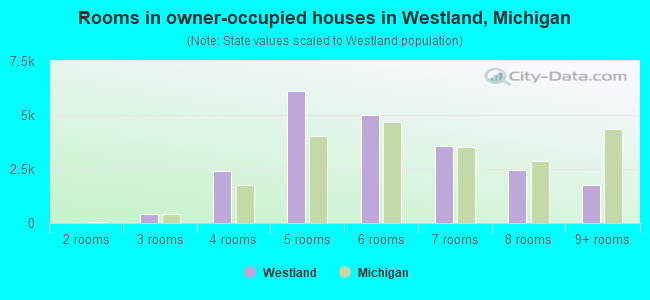
- Rooms in owner-occupied houses in Westland, Michigan
- 01 room
- 02 rooms
- 4343 rooms
- 2,4064 rooms
- 6,1035 rooms
- 5,0176 rooms
- 3,5737 rooms
- 2,4598 rooms
- 1,7769+ rooms
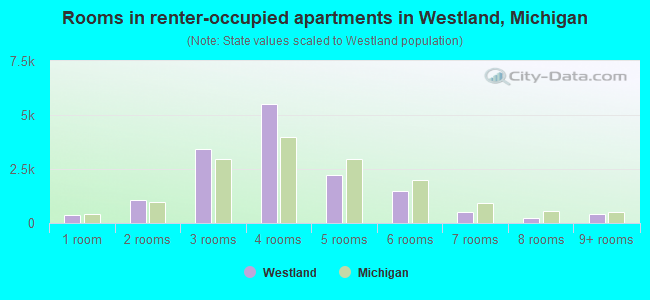
- Rooms in renter-occupied apartments in Westland, Michigan
- 3831 room
- 1,0482 rooms
- 3,4033 rooms
- 5,5324 rooms
- 2,2085 rooms
- 1,4786 rooms
- 4907 rooms
- 2448 rooms
- 4279+ rooms
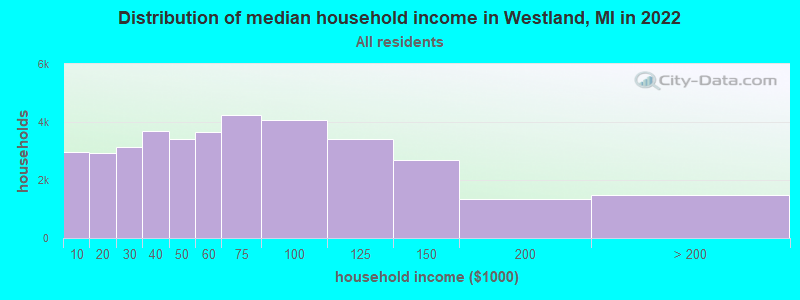
Westland, MI household income distribution

- 2,975Less than $10,000
- 2,920$10,000 to $19,999
- 3,128$20,000 to $29,999
- 3,677$30,000 to $39,999
- 3,415$40,000 to $49,999
- 3,650$50,000 to $59,999
- 4,255$60,000 to $74,999
- 4,057$75,000 to $99,999
- 3,430$100,000 to $124,999
- 2,677$125,000 to $149,999
- 1,329$150,000 to $199,999
- 1,468$200,000 or more
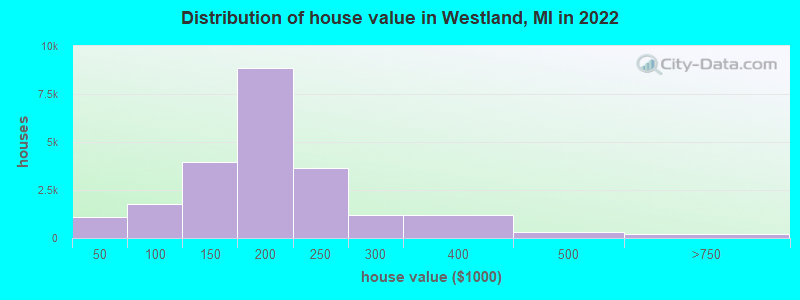
Home value of owner - occupied houses in 2022 in Westland, MI
-
- 233Less than $10,000
- 54$10,000 to $14,999
- 51$15,000 to $19,999
- 83$20,000 to $24,999
- 41$30,000 to $34,999
- 192$35,000 to $39,999
- 417$40,000 to $49,999
- 120$50,000 to $59,999
- 417$60,000 to $69,999
- 207$70,000 to $79,999
- 232$80,000 to $89,999
- 377$90,000 to $99,999
- 2,729$100,000 to $124,999
- 1,207$125,000 to $149,999
- 3,849$150,000 to $174,999
- 5,015$175,000 to $199,999
- 3,641$200,000 to $249,999
- 1,173$250,000 to $299,999
- 1,191$300,000 to $399,999
- 328$400,000 to $499,999
- 131$500,000 to $749,999
- 28$1,000,000 to $1,499,999
- 52$2,000,000 or more
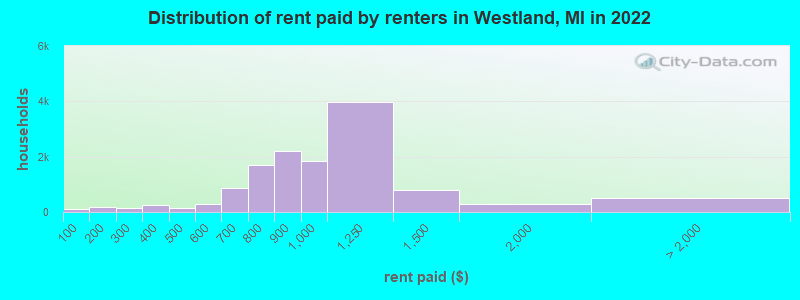
Rent paid by renters in 2022 in Westland, MI
-
- 95Less than $100
- 174$150 to $199
- 87$200 to $249
- 68$250 to $299
- 143$300 to $349
- 115$350 to $399
- 100$400 to $449
- 59$450 to $499
- 172$500 to $549
- 124$550 to $599
- 387$600 to $649
- 478$650 to $699
- 654$700 to $749
- 1,059$750 to $799
- 2,202$800 to $899
- 1,830$900 to $999
- 3,966$1,000 to $1,249
- 783$1,250 to $1,499
- 304$1,500 to $1,999
- 66$2,000 to $2,499
- 8$2,500 to $2,999
- 20$3,000 to $3,499
- 402No cash rent
Percentage of workers working in this county: 82.3%
Number of people working at home: 3,961 (10.0% of all workers)
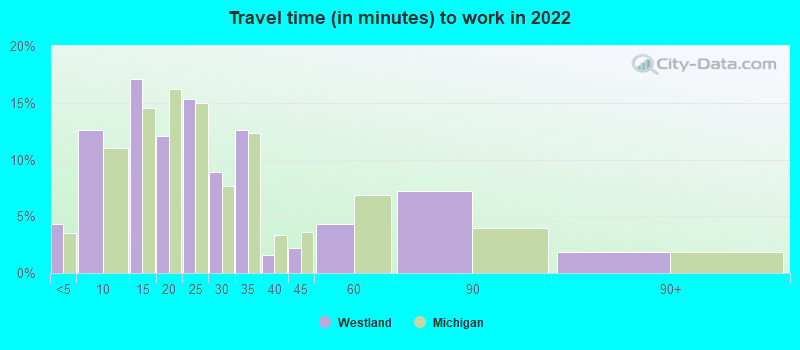
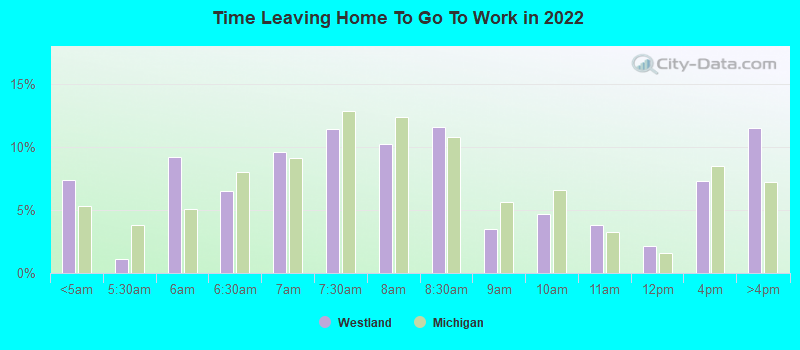
Travel time to work (commute)
- Less than 5 minutes: 164
- 5 to 9 minutes: 3,333
- 10 to 14 minutes: 4,223
- 15 to 19 minutes: 5,452
- 20 to 24 minutes: 6,316
- 25 to 29 minutes: 2,435
- 30 to 34 minutes: 5,578
- 35 to 39 minutes: 1,684
- 40 to 44 minutes: 1,651
- 45 to 59 minutes: 3,036
- 60 to 89 minutes: 1,261
- 90 or more minutes: 171
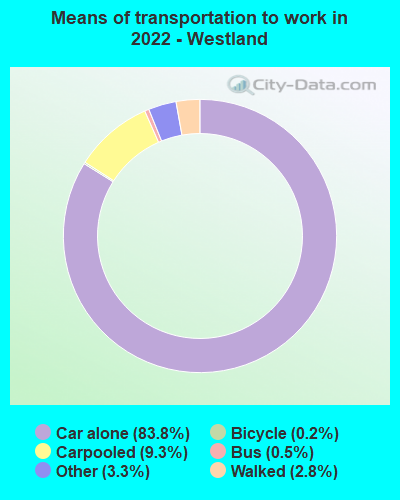
Means of transportation to work:
- Drove a car alone: 14,681 (69.5%)
- Carpooled: 1,616 (7.7%)
- Bus: 78 (0.4%)
- Ferryboat: 9 (0.0%)
- Taxi: 616 (2.9%)
- Bicycle: 42 (0.2%)
- Walked: 530 (2.5%)
- Worked at home: 3,961 (18.8%)
- Unemployment by race in 2022
- Unemployment rate for White non-Hispanic residents
- 3.6%Males
- 4.3%Females
- Unemployment rate for Black residents
- 11.1%Males
- 26.9%Females
- Unemployment rate for American Indian and Alaska Native residents
- 2.9%Males
- 18.7%Females
- Unemployment rate for Asian residents
- 7.9%Males
- 3.1%Females
- Unemployment rate for other race residents
- 6.7%Males
- 11.4%Females
- Unemployment rate for two or more race residents
- 9.0%Males
- 2.6%Females
- Unemployment rate for Hispanic or Latino residents
- 0.9%Males
- 3.3%Females
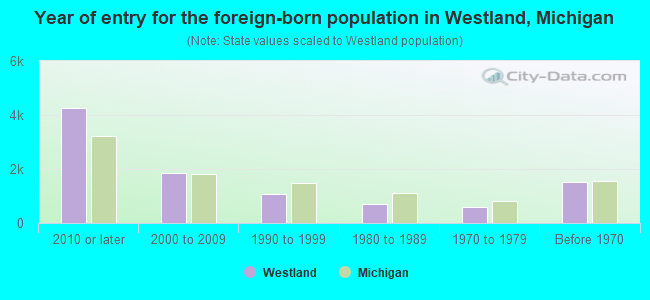
- Year of entry for the foreign-born population in Westland, Michigan
- 4,2432010 or later
- 1,8532000 to 2009
- 1,0831990 to 1999
- 6881980 to 1989
- 5901970 to 1979
- 1,530Before 1970
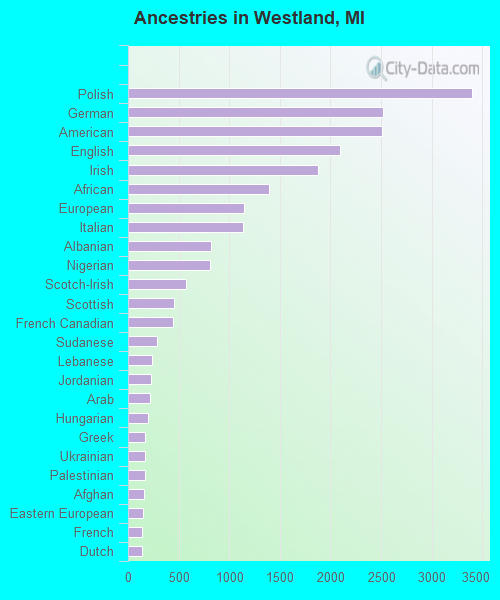
First ancestries reported:
- Polish: 3,397 (8.2%)
- German: 2,517 (6.1%)
- American: 2,507 (6.1%)
- English: 2,097 (5.1%)
- Irish: 1,881 (4.6%)
- African: 1,392 (3.4%)
- European: 1,148 (2.8%)
- Italian: 1,139 (2.8%)
- Albanian: 816 (2.0%)
- Nigerian: 809 (2.0%)
- Scotch-Irish: 576 (1.4%)
- Scottish: 459 (1.1%)
- French Canadian: 441 (1.1%)
- Sudanese: 289 (0.7%)
- Lebanese: 234 (0.6%)
- Jordanian: 229 (0.6%)
- Arab: 214 (0.5%)
- Hungarian: 196 (0.5%)
- Greek: 172 (0.4%)
- Ukrainian: 170 (0.4%)
- Palestinian: 165 (0.4%)
- Afghan: 154 (0.4%)
- Eastern European: 149 (0.4%)
- French: 138 (0.3%)
- Dutch: 134 (0.3%)
- Swedish: 133 (0.3%)
- Iraqi: 118 (0.3%)
- Norwegian: 112 (0.3%)
- Finnish: 112 (0.3%)
- Iranian: 110 (0.3%)
- Macedonian: 104 (0.3%)
- Canadian: 98 (0.2%)
- Romanian: 92 (0.2%)
- Ghanaian: 87 (0.2%)
- Slovak: 73 (0.2%)
- Jamaican: 72 (0.2%)
- Czech: 68 (0.2%)
- Moroccan: 54 (0.1%)
- Welsh: 50 (0.1%)
- Russian: 46 (0.1%)
- Maltese: 45 (0.1%)
- British: 41 (0.10%)
- Serbian: 41 (0.10%)
- Lithuanian: 36 (0.09%)
- British West Indian: 36 (0.09%)
- Danish: 34 (0.08%)
- Croatian: 33 (0.08%)
- Slovene: 22 (0.05%)
- Syrian: 22 (0.05%)
- Belgian: 17 (0.04%)
- Czechoslovakian: 16 (0.04%)
- Slavic: 16 (0.04%)
- Egyptian: 15 (0.04%)
- Latvian: 14 (0.03%)
- Assyrian: 12 (0.03%)
- Scandinavian: 9 (0.02%)
- Turkish: 9 (0.02%)
- Northern European: 8 (0.02%)
Most common places of birth for foreign-born residents (%):
| Westland: | 11.7% (923) |
| Michigan: | 11.1% (77,240) |
| Westland: | 10.4% (822) |
| Michigan: | 2.8% (19,112) |
| Westland: | 7.8% (618) |
| Michigan: | 10.9% (75,965) |
| Westland: | 7.6% (597) |
| Michigan: | 1.9% (12,910) |
| Westland: | 7.2% (566) |
| Michigan: | 0.2% (1,499) |
| Westland: | 6.8% (533) |
| Michigan: | 0.9% (5,964) |
| Westland: | 3.7% (295) |
| Michigan: | 0.3% (1,860) |
| Westland: | 3.3% (261) |
| Michigan: | 0.2% (1,173) |
| Westland: | 3.1% (242) |
| Michigan: | 0.7% (4,939) |
| Westland: | 3.0% (238) |
| Michigan: | 3.7% (25,634) |
| Westland: | 2.6% (203) |
| Michigan: | 4.9% (34,295) |
| Westland: | 2.6% (202) |
| Michigan: | 8.1% (55,954) |
| Westland: | 2.5% (196) |
| Michigan: | 1.5% (10,596) |
| Westland: | 2.3% (178) |
| Michigan: | 0.6% (4,450) |
| Westland: | 2.0% (154) |
| Michigan: | 5.0% (35,052) |
| Westland: | 1.7% (135) |
| Michigan: | 1.2% (8,563) |
| Westland: | 1.6% (125) |
| Michigan: | 1.6% (10,857) |
| Westland: | 1.5% (121) |
| Michigan: | 1.0% (6,829) |
Place of birth for U.S.-born residents:
- This state: 65,982
- Other state: 11,100
- Northeast: 2,074
- Midwest: 3,446
- South: 4,344
- West: 1,236
89.6% of Westland residents lived in the same house 1 years ago.
Out of people who lived in different houses, 40.0% lived in this county.
Out of people who lived in different counties, 72.3% lived in Michigan.
| Westland: | 89.6% |
| State average: | 88.4% |
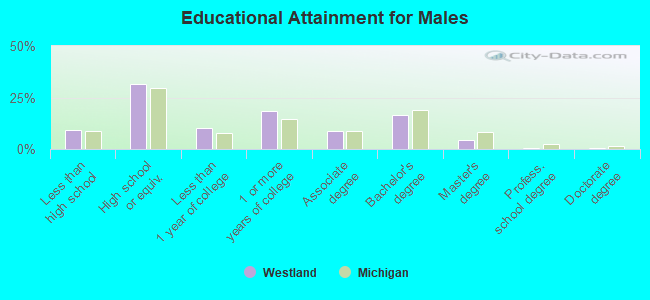
Education attainment for males 25 years and older:
- No schooling: 465
- Nursery to 4th grade: 41
- 5th and 6th grade: 114
- 7th and 8th grade: 120
- 9th grade: 125
- 10th grade: 432
- 11th grade: 629
- 12th grade, no diploma: 870
- High school graduate (or equivalency): 9,666
- Less than 1 year of college: 3,175
- Some college more than 1 year, no degree: 5,585
- Associate degree: 2,608
- Bachelor's degree: 5,040
- Master's degree: 1,376
- Professional school degree: 168
- Doctorate degree: 106
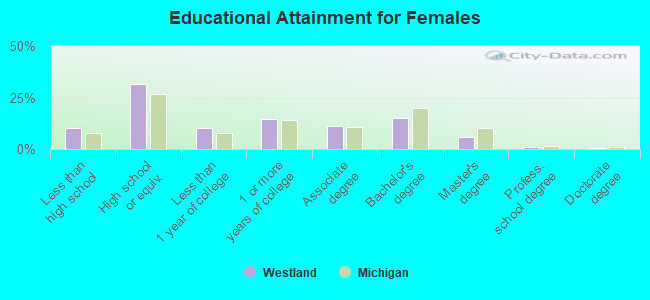
Education attainment for females 25 years and older:
- No schooling: 237
- Nursery to 4th grade: 0
- 5th and 6th grade: 114
- 7th and 8th grade: 228
- 9th grade: 437
- 10th grade: 703
- 11th grade: 582
- 12th grade, no diploma: 853
- High school graduate (or equivalency): 9,560
- Less than 1 year of college: 3,175
- Some college more than 1 year, no degree: 4,481
- Associate degree: 3,343
- Bachelor's degree: 4,627
- Master's degree: 1,780
- Professional school degree: 237
- Doctorate degree: 86
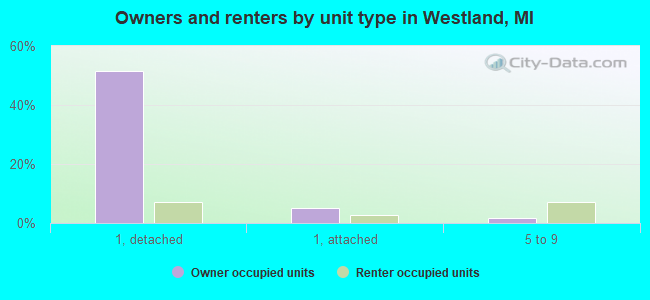
Housing units in structures:
- One, detached: 22,169
- One, attached: 3,257
- Two: 692
- 3 or 4: 1,269
- 5 to 9: 4,641
- 10 to 19: 2,285
- 20 to 49: 1,382
- 50 or more: 3,546
- Mobile homes: 683
Median worth of mobile homes: $9,999
Housing units lacking complete kitchen facilities in 2022: 0.8%
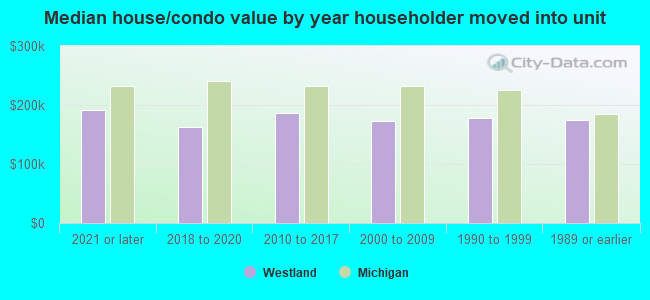
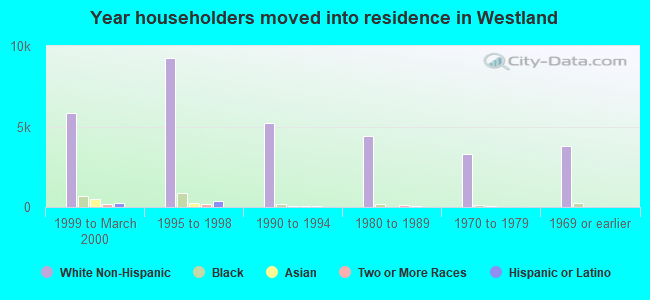
House/condo owner moved in on average 12 years ago
Renter moved in on average 3 years ago
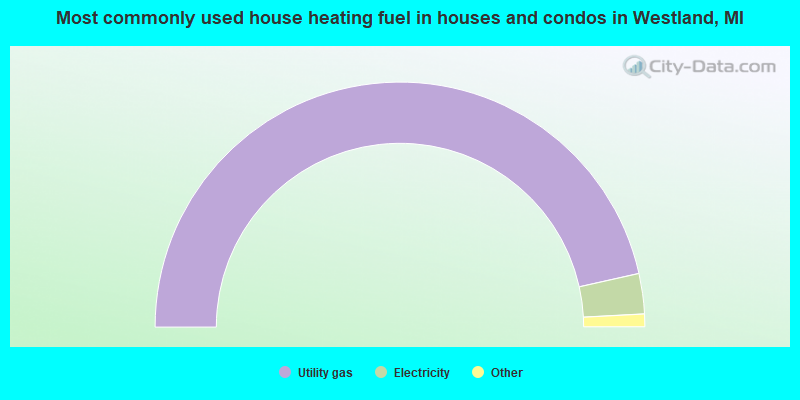
- 93.0%Utility gas
- 5.3%Electricity
- 1.2%Bottled, tank, or LP gas
- 0.2%No fuel used
- 0.2%Wood
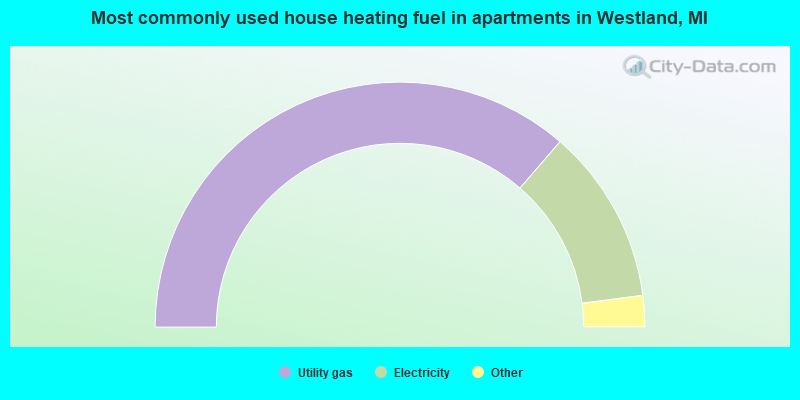
- 72.7%Utility gas
- 23.2%Electricity
- 1.4%Other fuel
- 1.3%Bottled, tank, or LP gas
- 1.3%No fuel used
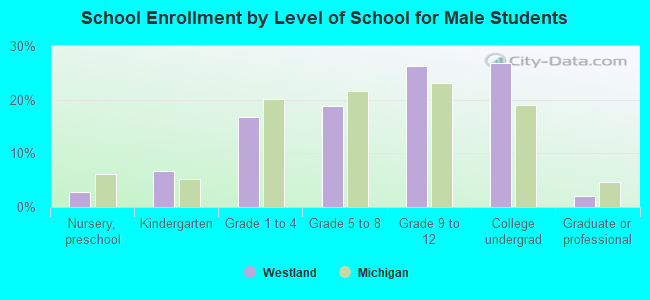
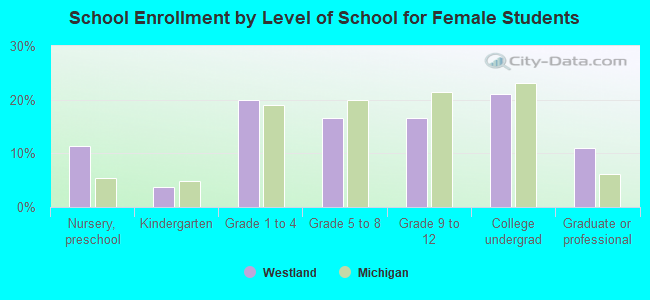
Private vs. public school enrollment:
| Here: | 10.1% |
| Michigan: | 12.4% |
| Here: | 10.2% |
| Michigan: | 9.8% |
| Here: | 16.2% |
| Michigan: | 14.9% |