Housing density: 1,327 houses/condos per square mile
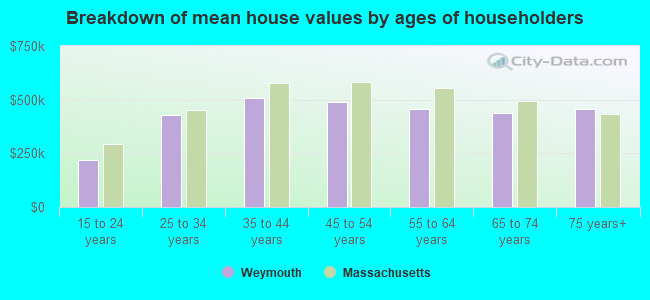
Median price asked for vacant for-sale houses and condos in 2022 in this county: $751,928.
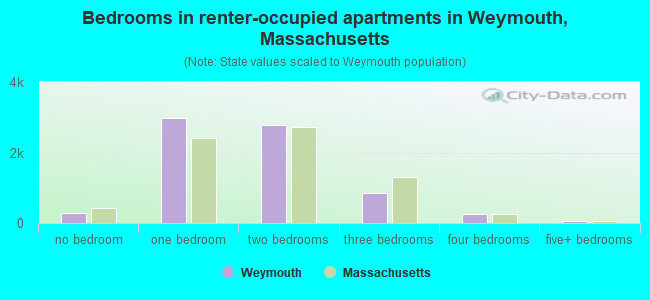
Median contract rent in 2022: $1,815 (lower quartile is $1,329, upper quartile is over $2,000)
Median rent asked for vacant for-rent units in 2022: $1,789
Median gross rent in Weymouth, MA in 2022: $1,867
Housing units in Weymouth with a mortgage: 8,734 (740 second mortgage, 1,129 home equity loan, 6 both second mortgage and home equity loan) Houses without a mortgage: 3,854
In family households: 540,608 (116,996 male householders, 51,907 female householders)
134,066 spouses, 197,825 children (189,784 natural, 4,588 adopted, 3,453 stepchildren), 7,406 grandchildren, 6,062 brothers or sisters, 7,064 parents, foster children, 5,893 other relatives, 9,006 non-relatives
In nonfamily households: 112,631 (36,559 male householders (27,334 living alone)), 52,452 female householders (43,798 living alone)), 23,620 nonrelatives
In group quarters: 17,611 (8,991 institutionalized population)
123,500 married couples with children.
20,654 single-parent households (3,498 men, 17,156 women).
93.6% of residents of Weymouth speak English at home.
1.6% of residents speak Spanish at home (75% speak English very well, 14% speak English well, 9% speak English not well, 2% don't speak English at all).
3.4% of residents speak other Indo-European language at home (67% speak English very well, 18% speak English well, 14% speak English not well, 1% don't speak English at all).
0.7% of residents speak Asian or Pacific Island language at home (66% speak English very well, 20% speak English well, 10% speak English not well, 3% don't speak English at all).
0.7% of residents speak other language at home (68% speak English very well, 19% speak English well, 12% speak English not well).
Foreign born population: 5,451 (9.1%)
(62.3% of them are naturalized citizens)
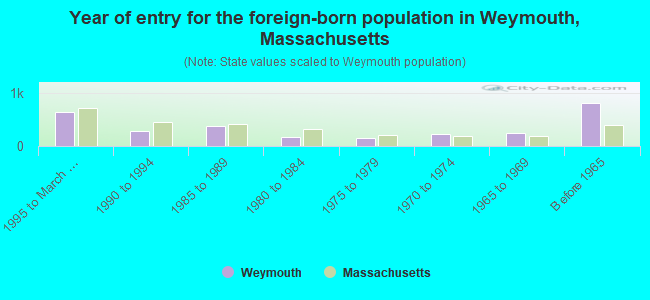
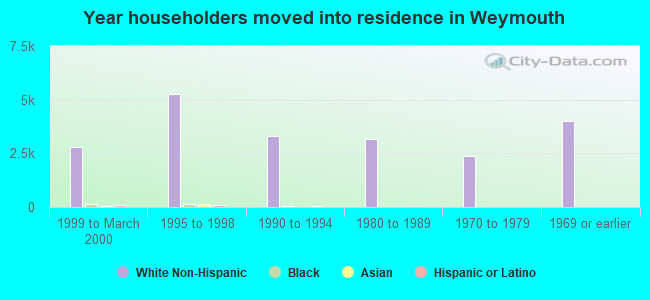
Year of entry for the foreign-born population in Weymouth, Massachusetts
6491995 to March 2000
2811990 to 1994
3711985 to 1989
1751980 to 1984
1501975 to 1979
2271970 to 1974
2501965 to 1969
810Before 1965
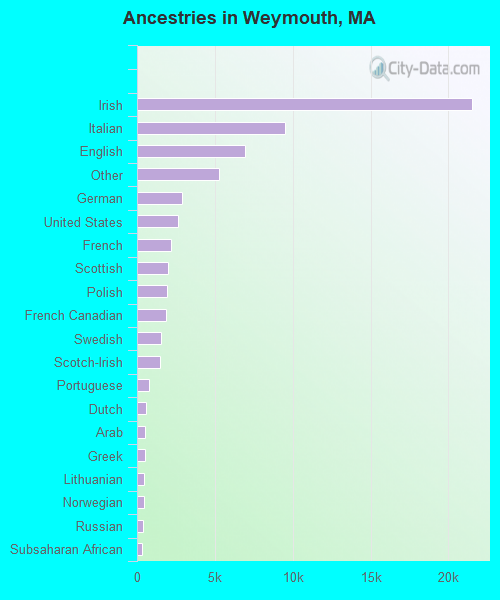
First ancestries reported:
Irish: 21,531 (33.3%)
Italian: 9,537 (14.7%)
English: 6,957 (10.8%)
Other: 5,235 (8.1%)
German: 2,867 (4.4%)
United States: 2,636 (4.1%)
French: 2,203 (3.4%)
Scottish: 2,014 (3.1%)
Polish: 1,919 (3.0%)
French Canadian: 1,866 (2.9%)
Swedish: 1,572 (2.4%)
Scotch-Irish: 1,486 (2.3%)
Portuguese: 767 (1.2%)
Dutch: 556 (0.9%)
Arab: 543 (0.8%)
Greek: 532 (0.8%)
Lithuanian: 465 (0.7%)
Norwegian: 460 (0.7%)
Russian: 372 (0.6%)
Subsaharan African: 310 (0.5%)
Welsh: 180 (0.3%)
West Indian: 180 (0.3%)
Danish: 144 (0.2%)
Czech: 132 (0.2%)
Hungarian: 77 (0.1%)
Swiss: 66 (0.1%)
Ukrainian: 53 (0.08%)
Slovak: 23 (0.04%)
Most common places of birth for foreign-born residents (%):
Canada
Weymouth:
10.9% (318)
Massachusetts:
5.2% (40,247)
Ireland
Weymouth:
9.3% (270)
Massachusetts:
2.3% (17,987)
Brazil
Weymouth:
9.0% (263)
Massachusetts:
4.7% (36,669)
United Kingdom
Weymouth:
8.9% (260)
Massachusetts:
3.3% (25,403)
Other Western Africa
Weymouth:
4.1% (118)
Massachusetts:
2.6% (20,299)
Greece
Weymouth:
3.7% (107)
Massachusetts:
1.7% (12,975)
India
Weymouth:
3.4% (100)
Massachusetts:
3.6% (28,086)
Poland
Weymouth:
3.1% (89)
Massachusetts:
1.8% (13,543)
Italy
Weymouth:
2.9% (85)
Massachusetts:
3.7% (28,319)
Germany
Weymouth:
2.1% (62)
Massachusetts:
1.9% (14,883)
Other Northern Africa
Weymouth:
2.0% (57)
Massachusetts:
0.5% (3,810)
Netherlands
Weymouth:
1.9% (55)
Massachusetts:
0.3% (2,470)
Other Eastern Europe
Weymouth:
1.9% (54)
Massachusetts:
1.6% (12,350)
Cuba
Weymouth:
1.9% (54)
Massachusetts:
0.5% (3,868)
Other Northern Europe
Weymouth:
1.8% (51)
Massachusetts:
0.4% (3,051)
Haiti
Weymouth:
1.6% (48)
Massachusetts:
4.4% (33,862)
Dominican Republic
Weymouth:
1.6% (47)
Massachusetts:
6.0% (46,744)
Hong Kong
Weymouth:
1.6% (47)
Massachusetts:
1.0% (7,937)
China, excluding Hong Kong and Taiwan
Weymouth:
1.5% (44)
Massachusetts:
5.1% (39,255)
Place of birth for U.S.-born residents:
This state: 44,856
Other state: 5,784
Northeast: 3,313
Midwest: 875
South: 1,008
West: 588
64% of Weymouth residents lived in the same house 5 years ago. Out of people who lived in different houses, 57% lived in this county. Out of people who lived in different counties, 70% lived in Massachusetts.
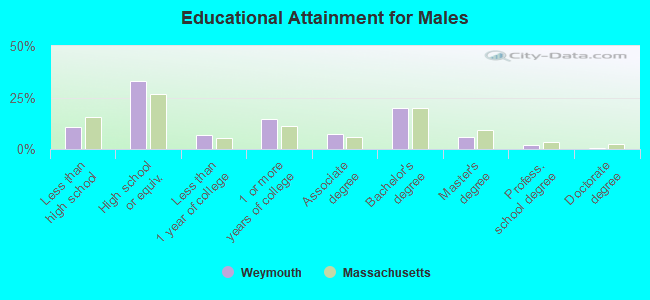
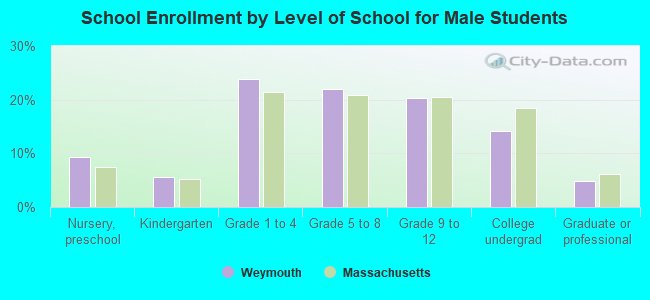
Education attainment for males 25 years and older:
No schooling: 55
Nursery to 4th grade: 0
5th and 6th grade: 57
7th and 8th grade: 318
9th grade: 191
10th grade: 394
11th grade: 162
12th grade, no diploma: 682
High school graduate (or equivalency): 5,820
Less than 1 year of college: 1,182
Some college more than 1 year, no degree: 2,539
Associate degree: 1,248
Bachelor's degree: 3,486
Master's degree: 1,054
Professional school degree: 321
Doctorate degree: 89
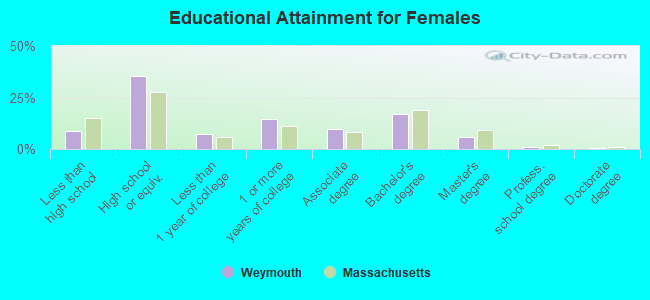
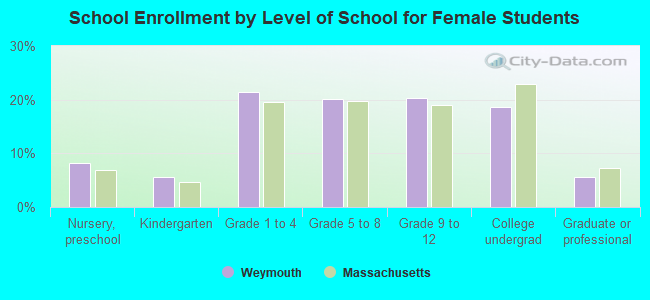
Education attainment for females 25 years and older:
No schooling: 119
Nursery to 4th grade: 9
5th and 6th grade: 77
7th and 8th grade: 201
9th grade: 208
10th grade: 215
11th grade: 367
12th grade, no diploma: 615
High school graduate (or equivalency): 7,433
Less than 1 year of college: 1,485
Some college more than 1 year, no degree: 3,018
Associate degree: 2,033
Bachelor's degree: 3,567
Master's degree: 1,212
Professional school degree: 226
Doctorate degree: 59
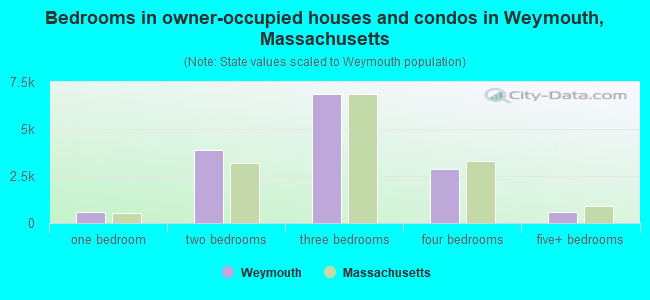
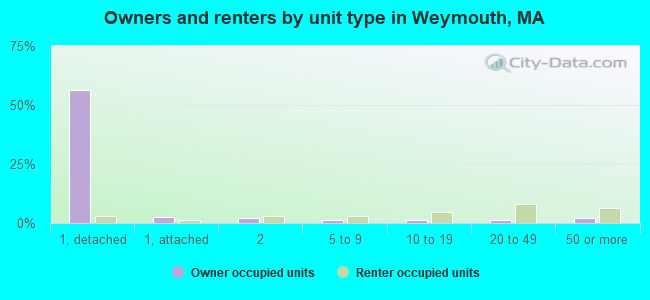
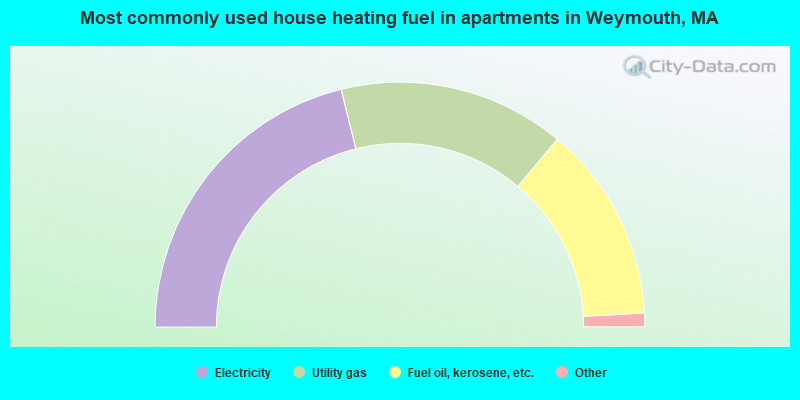
Housing units in structures:
One, detached: 13,254
One, attached: 855
Two: 1,063
3 or 4: 903
5 to 9: 974
10 to 19: 1,295
20 to 49: 2,106
50 or more: 1,971
Mobile homes: 152
Median worth of mobile homes: $109,103
Housing units lacking complete plumbing facilities: 0.2%
Housing units lacking complete kitchen facilities: 0.2%