Williamstown, MA (Massachusetts) Houses and Residents
| Williamstown: | $529,753 |
| Massachusetts: | $534,700 |
Mean price in 2022:
Detached houses: $649,491
Here: $649,491 State: $651,570 Townhouses or other attached units: $292,966
Here: $292,966 State: $617,749 In 2-unit structures: $489,260
Here: $489,260 State: $594,808 In 3-to-4-unit structures: $136,206
Here: $136,206 State: $601,912 In 5-or-more-unit structures: $415,410
Here: $415,410 State: $555,768 Mobile homes: $17,821
Here: $17,821 State: $170,209
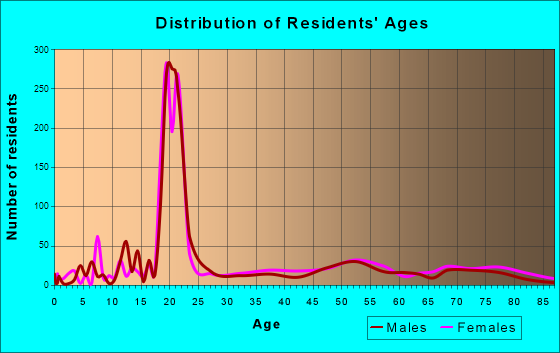
Total population: 4,325 (All urban)
Houses: 1,573 (1,195 occupied: 775 owner occupied, 462 renter occupied)
| % of renters here: | 37% |
| State: | 38% |
Housing density: 460 houses/condos per square mile
Median price asked for vacant for-sale houses and condos in 2022: $3,057,210.
Median contract rent in 2022: $1,043
Median rent asked for vacant for-rent units in 2022: $8,367
Median gross rent in Williamstown, MA in 2022: $1,200
Housing units in Williamstown with a mortgage: 417 (117 second mortgage, 0 home equity loan, 41 both second mortgage and home equity loan)
Houses without a mortgage: 29
Median household income for houses/condos with a mortgage: $227,723
Median household income for apartments without a mortgage: $74,413
Median monthly housing costs: $1,484
Compare current foreclosures near Williamstown, MA:
| Photo | Address | Area | Beds / Baths | Price | Details |
|---|---|---|---|---|---|

|
#1
North St
Williamstown, MA 01267
|
1,552 sq. feet
|
2 baths 3 beds |
show details | |

|
#2
Linden St
Williamstown, MA 01267
|
2,298 sq. feet
|
3 baths 4 beds |
show details | |

|
#3
Woodlawn Dr
Williamstown, MA 01267
|
1,806 sq. feet
|
2 baths 4 beds |
show details | |

|
#4
Linden St
Williamstown, MA 01267
|
2,298 sq. feet
|
3 baths 4 beds |
show details | |

|
#5
Elmwood Ave
North Adams, MA 01247
|
2,777 sq. feet
|
3 baths 5 beds |
$215,000
|
show details |

|
#6
Chapel Rd
Bennington, VT 05201
|
1,000 sq. feet
|
1 baths 2 beds |
$273,000
|
show details |

|
#7
Wilshire Dr
Cheshire, MA 01225
|
4,302 sq. feet
|
2 baths 3 beds |
show details | |

|
#8
Friend St
Adams, MA 01220
|
1,820 sq. feet
|
2 baths 6 beds |
show details | |

|
#9
Arnold Ct
Cheshire, MA 01225
|
1,600 sq. feet
|
2 baths 2 beds |
show details | |

|
#10
Franklin St
North Adams, MA 01247
|
1,386 sq. feet
|
1 baths 3 beds |
show details |
| Photo | Address | Area | Beds / Baths | Price | Details |
|---|---|---|---|---|---|

|
#11
Grove St
Adams, MA 01220
|
2,644 sq. feet
|
2 baths 7 beds |
show details | |

|
#12
North St
North Adams, MA 01247
|
1,164 sq. feet
|
1 baths 3 beds |
show details | |

|
#13
Blue Factory Rd
Averill Park, NY 12018
|
1,344 sq. feet
|
2 baths 3 beds |
show details | |

|
#14
Crane Ave
Pittsfield, MA 01201
|
981 sq. feet
|
1 baths 2 beds |
show details | |

|
#15
Grange Hall Rd
Stephentown, NY 12168
|
1,670 sq. feet
|
1 baths 2 beds |
show details | |

|
#16
Stewart White Rd
Cheshire, MA 01225
|
924 sq. feet
|
1 baths 2 beds |
show details | |

|
#17
Church Rd
Drury, MA 01343
|
2,560 sq. feet
|
2 baths 4 beds |
show details | |

|
#18
E Shore Dr
Petersburg, NY 12138
|
1,000 sq. feet
|
1 baths 6 beds |
show details | |

|
#19
Notch Rd
Cheshire, MA 01225
|
1,607 sq. feet
|
1 baths 3 beds |
show details | |

|
#20
North St # 9
Dalton, MA 01226
|
1,150 sq. feet
|
2 baths 2 beds |
show details |
| Photo | Address | Area | Beds / Baths | Price | Details |
|---|---|---|---|---|---|

|
#21
Cranberry Pond Rd
Cropseyville, NY 12052
|
1,152 sq. feet
|
1 baths 2 beds |
show details | |

|
#22
Pine Valley Rd
Hoosick Falls, NY 12090
|
1,447 sq. feet
|
1 baths 2 beds |
show details | |

|
#23
North St
Dalton, MA 01226
|
1,852 sq. feet
|
2 baths 4 beds |
show details | |

|
#24
Loop Rd
Savoy, MA 01256
|
1,040 sq. feet
|
1 baths 3 beds |
show details | |

|
#25
W Hawley Rd
Charlemont, MA 01339
|
1,440 sq. feet
|
1 baths 2 beds |
show details | |

|
#26
Wilder Ave
Hoosick Falls, NY 12090
|
3,206 sq. feet
|
1 baths 4 beds |
show details | |

|
#27
High St
Hoosick Falls, NY 12090
|
2,410 sq. feet
|
1 baths 6 beds |
show details | |

|
#28
Tea St
Charlemont, MA 01339
|
2,829 sq. feet
|
2 baths 6 beds |
show details | |

|
#29
Legate Hill Rd
Charlemont, MA 01339
|
2,016 sq. feet
|
2 baths 3 beds |
show details | |

|
#30
Ashuelot St
Dalton, MA 01226
|
1,792 sq. feet
|
2 baths 3 beds |
show details |
| Photo | Address | Area | Beds / Baths | Price | Details |
|---|---|---|---|---|---|

|
#31
Scott St
Hoosick Falls, NY 12090
|
984 sq. feet
|
1 baths 2 beds |
show details | |

|
#32
Hancock Rd
Pittsfield, MA 01201
|
1,344 sq. feet
|
2 baths 3 beds |
show details | |

|
#33
North St
Dalton, MA 01226
|
1,852 sq. feet
|
2 baths 4 beds |
show details | |

|
#34
Legate Hill Rd
Charlemont, MA 01339
|
2,016 sq. feet
|
2 baths 3 beds |
show details | |

|
#35
Varville Rd
Petersburg, NY 12138
|
1,232 sq. feet
|
1 baths 3 beds |
show details | |

|
#36
W Mountain Rd
Adams, MA 01220
|
1,173 sq. feet
|
1 baths 3 beds |
show details | |

|
#37
Fox Way
Petersburg, NY 12138
|
1,734 sq. feet
|
1 baths 1 beds |
show details | |

|
#38
Weber St # 12
Adams, MA 01220
|
1,728 sq. feet
|
2 baths 4 beds |
show details | |

|
#39
E Hoosac St
Adams, MA 01220
|
594 sq. feet
|
1 baths 2 beds |
show details | |

|
#40
Mohawk Trl
North Adams, MA 01247
|
1,210 sq. feet
|
1 baths 3 beds |
show details |
| Photo | Address | Area | Beds / Baths | Price | Details |
|---|---|---|---|---|---|

|
#41
W Shaft Rd
North Adams, MA 01247
|
1,144 sq. feet
|
1 baths 3 beds |
show details | |

|
#42
Richmond St
Adams, MA 01220
|
1,920 sq. feet
|
2 baths 4 beds |
show details | |

|
#43
Hill Hollow Rd
Petersburg, NY 12138
|
980 sq. feet
|
1 baths 1 beds |
show details | |

|
#44
Phelps Rd
North Adams, MA 01247
|
1,286 sq. feet
|
1 baths 4 beds |
show details | |

|
#45
Anthony St # B
Adams, MA 01220
|
1,622 sq. feet
|
2 baths 3 beds |
show details | |

|
#46
North St
North Adams, MA 01247
|
1,164 sq. feet
|
1 baths 3 beds |
show details | |

|
#47
Daniels Ct
Adams, MA 01220
|
1,400 sq. feet
|
1 baths 3 beds |
show details | |

|
#48
Phelps Ave
North Adams, MA 01247
|
1,064 sq. feet
|
1 baths 1 beds |
show details | |

|
#49
Phelps Ave
North Adams, MA 01247
|
1,064 sq. feet
|
1 baths 1 beds |
show details | |

|
Check over 1 million property listings on Foreclosure.com!
|
browse all offers | |||

Latest news about housing in Williamstown, MA collected exclusively by city-data.com from local newspapers, TV, and radio stations


Median year apartment built: 1967
Household type by relationship:
Households: 4,466- Male householders: 542 (155 living alone), Female householders: 638 (316 living alone)
430 spouses (430 opposite-sex spouses), 49 unmarried partners, (35 opposite-sex unmarried partners), 654 children (637 natural, 6 adopted, 9 stepchildren), 0 grandchildren, 0 brothers or sisters, 0 parents, 0 foster children, 25 other relatives, 166 non-relatives
- In group quarters: 1,958
Size of family households: 355 2-persons, 100 3-persons, 94 4-persons, 79 5-persons.
Size of nonfamily households: 463 1-person, 114 2-persons, 11 3-persons, 31 7-or-more-persons.
425 married couples with children.
72 single-parent households (39 men, 33 women).
84.0% of residents of Williamstown speak English at home.
1.4% of residents speak Spanish at home (100% speak English very well).
7.0% of residents speak other Indo-European language at home (92% speak English very well, 8% speak English well).
3.9% of residents speak Asian or Pacific Island language at home (95% speak English very well, 5% speak English well).
3.3% of residents speak other language at home (100% speak English very well).
Foreign born population: 553 (12.4%)
(36.7% of them are naturalized citizens)
| Here: | 8.2 |
| State: | 6.5 |
| Here: | 4.1 |
| State: | 4.0 |

- Bedrooms in owner-occupied houses and condos in Williamstown, Massachusetts
- 0no bedroom
- 181 bedroom
- 932 bedrooms
- 2813 bedrooms
- 1884 bedrooms
- 1965+ bedrooms

- Bedrooms in renter-occupied apartments in Williamstown, Massachusetts
- 0no bedroom
- 1491 bedroom
- 2362 bedrooms
- 493 bedrooms
- 114 bedrooms
- 175+ bedrooms

- Cars and other vehicles available in Williamstown in owner-occupied houses/condos
- 39no vehicle
- 2951 vehicle
- 3832 vehicles
- 453 vehicles
- 154 vehicles
- 05+ vehicles

- Cars and other vehicles available in Williamstown in renter-occupied apartments
- 125no vehicle
- 2211 vehicle
- 882 vehicles
- 113 vehicles
- 04 vehicles
- 175+ vehicles

- Rooms in owner-occupied houses in Williamstown, Massachusetts
- 01 room
- 02 rooms
- 233 rooms
- 324 rooms
- 705 rooms
- 1486 rooms
- 737 rooms
- 958 rooms
- 3359+ rooms

- Rooms in renter-occupied apartments in Williamstown, Massachusetts
- 01 room
- 02 rooms
- 1063 rooms
- 2274 rooms
- 445 rooms
- 496 rooms
- 07 rooms
- 178 rooms
- 209+ rooms


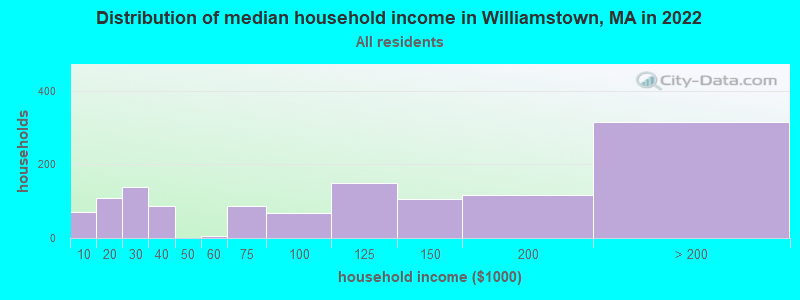
Williamstown, MA household income distribution

- 70Less than $10,000
- 109$10,000 to $19,999
- 139$20,000 to $29,999
- 88$30,000 to $39,999
- 6$50,000 to $59,999
- 86$60,000 to $74,999
- 68$75,000 to $99,999
- 150$100,000 to $124,999
- 106$125,000 to $149,999
- 116$150,000 to $199,999
- 315$200,000 or more
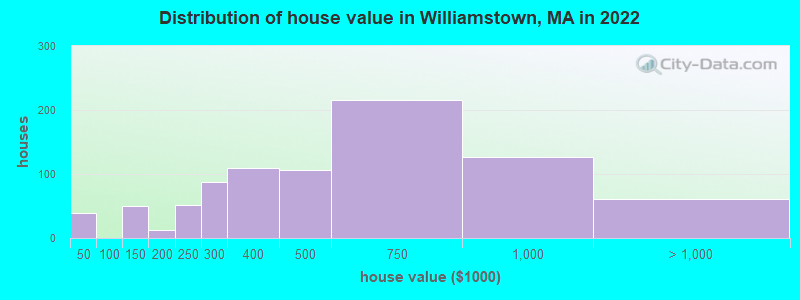
Home value of owner - occupied houses in 2022 in Williamstown, MA
-
- 39Less than $10,000
- 32$100,000 to $124,999
- 17$125,000 to $149,999
- 6$150,000 to $174,999
- 6$175,000 to $199,999
- 50$200,000 to $249,999
- 86$250,000 to $299,999
- 109$300,000 to $399,999
- 107$400,000 to $499,999
- 214$500,000 to $749,999
- 125$750,000 to $999,999
- 23$1,000,000 to $1,499,999
- 16$1,500,000 to $1,999,999
- 20$2,000,000 or more
Rent paid by renters in 2022 in Williamstown, MA
-
- 19$150 to $199
- 13$200 to $249
- 24$300 to $349
- 23$400 to $449
- 12$600 to $649
- 26$650 to $699
- 16$800 to $899
- 30$900 to $999
- 84$1,000 to $1,249
- 13$1,250 to $1,499
- 45$1,500 to $1,999
- 10$2,000 to $2,499
- 39$3,000 to $3,499
- 32$3,500 or more
- 34No cash rent


Percentage of workers working in this county: 92.6%
Number of people working at home: 420 (18.8% of all workers)

Travel time to work (commute)
- Less than 5 minutes: 360
- 5 to 9 minutes: 671
- 10 to 14 minutes: 523
- 15 to 19 minutes: 145
- 20 to 24 minutes: 111
- 25 to 29 minutes: 24
- 30 to 34 minutes: 6
- 35 to 39 minutes: 37
- 40 to 44 minutes: 4
- 45 to 59 minutes: 82
- 60 to 89 minutes: 32
- 90 or more minutes: 36
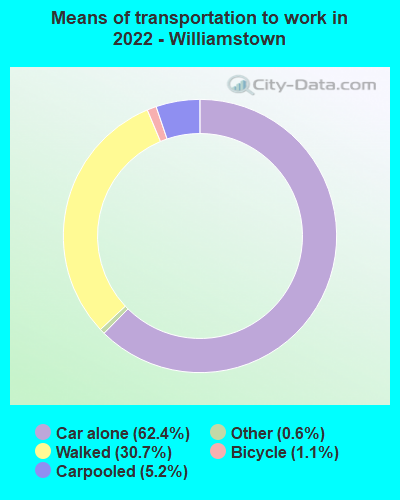
Means of transportation to work:
- Drove a car alone: 2,345 (55.2%)
- Carpooled: 205 (4.8%)
- Taxi: 29 (0.7%)
- Bicycle: 46 (1.1%)
- Walked: 1,119 (26.3%)
- Worked at home: 420 (9.9%)

- Unemployment by race in 2022
- Unemployment rate for White non-Hispanic residents
- 2.0%Males
- Unemployment rate for two or more race residents
- 2.3%Males

- Year of entry for the foreign-born population in Williamstown, Massachusetts
- 2982010 or later
- 1302000 to 2009
- 131990 to 1999
- 1051980 to 1989
- 241970 to 1979
- 16Before 1970
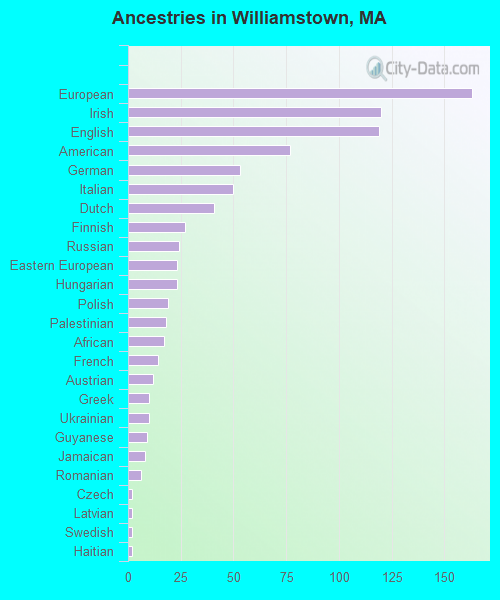
First ancestries reported:
- European: 163 (12.0%)
- Irish: 120 (8.9%)
- English: 119 (8.8%)
- American: 77 (5.7%)
- German: 53 (3.9%)
- Italian: 50 (3.7%)
- Dutch: 41 (3.0%)
- Finnish: 27 (2.0%)
- Russian: 24 (1.8%)
- Eastern European: 23 (1.7%)
- Hungarian: 23 (1.7%)
- Polish: 19 (1.4%)
- Palestinian: 18 (1.3%)
- African: 17 (1.3%)
- French: 14 (1.0%)
- Austrian: 12 (0.9%)
- Greek: 10 (0.7%)
- Ukrainian: 10 (0.7%)
- Guyanese: 9 (0.7%)
- Jamaican: 8 (0.6%)
- Romanian: 6 (0.4%)
- Czech: 2 (0.1%)
- Latvian: 2 (0.1%)
- Swedish: 2 (0.1%)
- Haitian: 2 (0.1%)
- Sierra Leonean: 1 (0.07%)
Most common places of birth for foreign-born residents (%):
| Williamstown: | 11.6% (60) |
| Massachusetts: | 0.6% (6,789) |
| Williamstown: | 10.3% (53) |
| Massachusetts: | 8.4% (103,233) |
| Williamstown: | 4.6% (24) |
| Massachusetts: | 0.6% (7,349) |
| Williamstown: | 4.4% (23) |
| Massachusetts: | 0.1% (1,519) |
| Williamstown: | 4.4% (23) |
| Massachusetts: | 6.8% (82,934) |
| Williamstown: | 4.4% (23) |
| Massachusetts: | 0.1% (900) |
| Williamstown: | 4.1% (21) |
| Massachusetts: | 1.4% (17,613) |
| Williamstown: | 3.7% (19) |
| Massachusetts: | 0.9% (10,698) |
| Williamstown: | 3.7% (19) |
| Massachusetts: | 0.1% (748) |
| Williamstown: | 3.7% (19) |
| Massachusetts: | 0.1% (738) |
| Williamstown: | 3.5% (18) |
| Massachusetts: | 0.1% (779) |
| Williamstown: | 3.5% (18) |
| Massachusetts: | 8.3% (101,767) |
| Williamstown: | 3.1% (16) |
| Massachusetts: | 0.1% (1,006) |
| Williamstown: | 2.7% (14) |
| Massachusetts: | 3.0% (37,197) |
| Williamstown: | 2.5% (13) |
| Massachusetts: | 0.2% (1,916) |
| Williamstown: | 2.3% (12) |
| Massachusetts: | 0.1% (1,245) |
| Williamstown: | 2.3% (12) |
| Massachusetts: | 0.2% (2,231) |
| Williamstown: | 2.1% (11) |
| Massachusetts: | 0.9% (10,808) |
| Williamstown: | 2.1% (11) |
| Massachusetts: | 0.4% (4,660) |
| Williamstown: | 1.9% (10) |
| Massachusetts: | 0.3% (4,128) |
| Williamstown: | 1.7% (9) |
| Massachusetts: | 2.3% (27,810) |
| Williamstown: | 1.5% (8) |
| Massachusetts: | 0.6% (7,364) |
| Williamstown: | 1.5% (8) |
| Massachusetts: | 0.1% (1,538) |
Place of birth for U.S.-born residents:
- This state: 1,070
- Other state: 3,119
- Northeast: 1,623
- Midwest: 406
- South: 559
- West: 528
58.1% of Williamstown residents lived in the same house 1 years ago.
Out of people who lived in different houses, 36.0% lived in this county.
Out of people who lived in different counties, 23.9% lived in Massachusetts.
| Williamstown: | 58.1% |
| State average: | 87.7% |
Education attainment for males 25 years and older:
- No schooling: 0
- Nursery to 4th grade: 0
- 5th and 6th grade: 0
- 7th and 8th grade: 0
- 9th grade: 0
- 10th grade: 0
- 11th grade: 10
- 12th grade, no diploma: 0
- High school graduate (or equivalency): 45
- Less than 1 year of college: 0
- Some college more than 1 year, no degree: 50
- Associate degree: 4
- Bachelor's degree: 143
- Master's degree: 191
- Professional school degree: 30
- Doctorate degree: 355

Education attainment for females 25 years and older:
- No schooling: 0
- Nursery to 4th grade: 0
- 5th and 6th grade: 0
- 7th and 8th grade: 0
- 9th grade: 0
- 10th grade: 7
- 11th grade: 0
- 12th grade, no diploma: 0
- High school graduate (or equivalency): 147
- Less than 1 year of college: 6
- Some college more than 1 year, no degree: 53
- Associate degree: 10
- Bachelor's degree: 302
- Master's degree: 394
- Professional school degree: 56
- Doctorate degree: 54

Housing units in structures:
- One, detached: 860
- One, attached: 71
- Two: 112
- 3 or 4: 213
- 5 to 9: 180
- 10 to 19: 89
- 20 to 49: 24
- 50 or more: 21
Housing units lacking complete kitchen facilities in 2022: 1.9%
House/condo owner moved in on average 14 years ago
Renter moved in on average 1 years ago

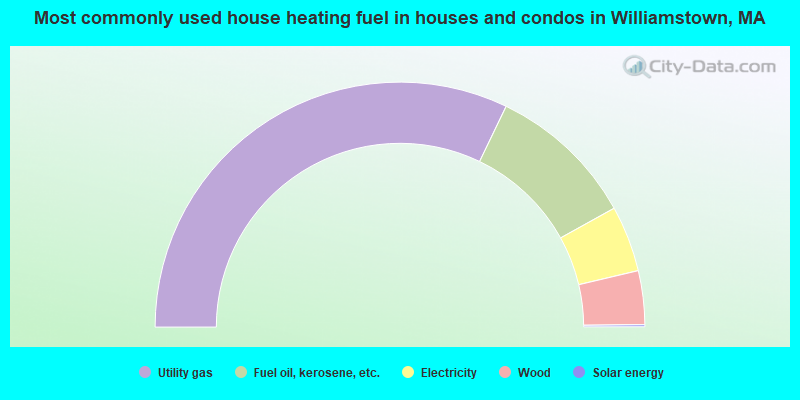
- 64.3%Utility gas
- 19.6%Fuel oil, kerosene, etc.
- 8.7%Electricity
- 7.1%Wood
- 0.3%Solar energy
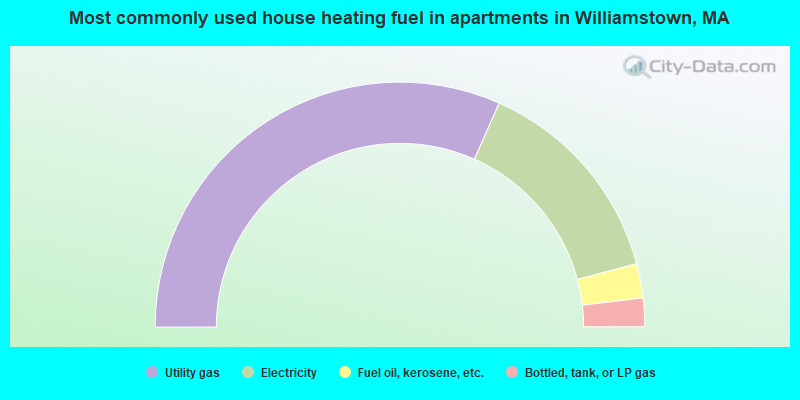
- 63.3%Utility gas
- 28.4%Electricity
- 4.5%Fuel oil, kerosene, etc.
- 3.8%Bottled, tank, or LP gas
Private vs. public school enrollment:
| Here: | 0.6% |
| Massachusetts: | 10.3% |
| Here: | 10.8% |
| Massachusetts: | 12.3% |
| Here: | 67.2% |
| Massachusetts: | 51.2% |


