Housing density: 977 houses/condos per square mile
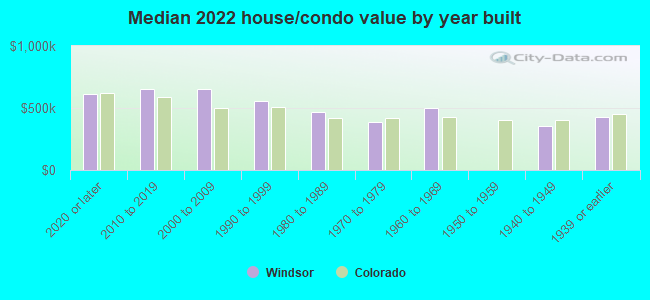
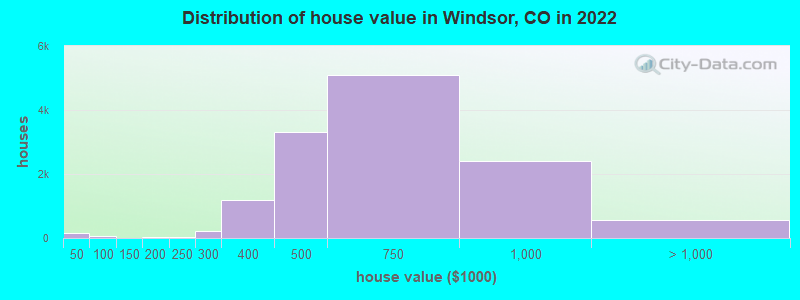
Median price asked for vacant for-sale houses and condos in 2022: $364,758.
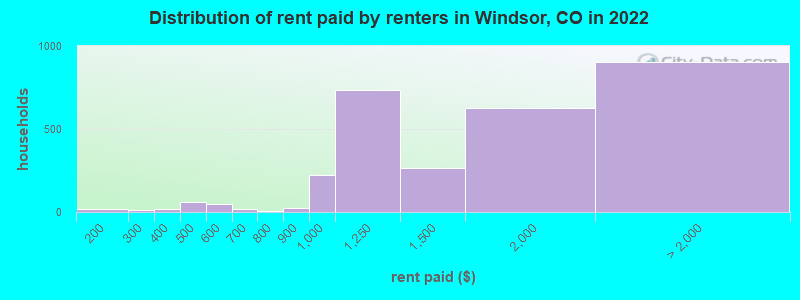
Median contract rent in 2022: $1,464 (lower quartile is $1,117, upper quartile is over $2,000)
Median rent asked for vacant for-rent units in 2022: $2,723
Median gross rent in Windsor, CO in 2022: $1,738
Housing units in Windsor with a mortgage: 8,605 (1,182 second mortgage, 11 home equity loan, 827 both second mortgage and home equity loan) Houses without a mortgage: 44
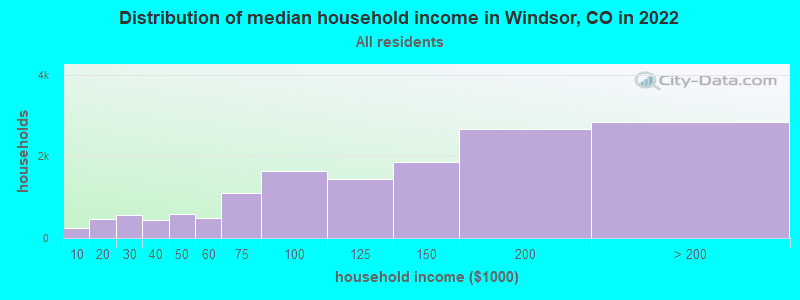
Median household income for houses/condos with a mortgage: $139,326
Median household income for apartments without a mortgage: $143,763
6,720 married couples with children.
1,441 single-parent households (599 men, 842 women).
95.1% of residents of Windsor speak English at home.
3.0% of residents speak Spanish at home (79% speak English very well, 16% speak English well, 1% speak English not well, 4% don't speak English at all).
1.5% of residents speak other Indo-European language at home (95% speak English very well, 5% speak English well).
0.4% of residents speak Asian or Pacific Island language at home (57% speak English very well, 17% speak English well, 26% speak English not well).
0.2% of residents speak other language at home (100% speak English very well).
Foreign born population: 884 (2.5%)
(70.5% of them are naturalized citizens)
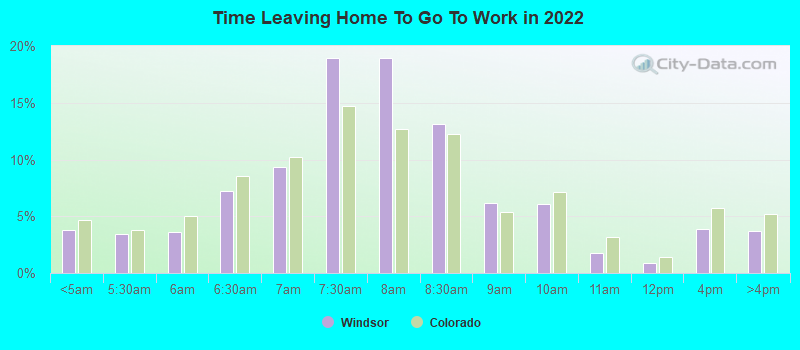
Percentage of workers working in this county: 59.1% Number of people working at home: 4,270 (23.1% of all workers)
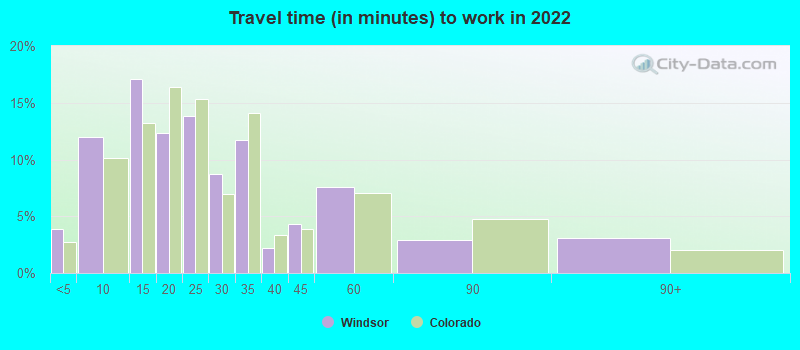
Travel time to work (commute)
Less than 5 minutes: 388
5 to 9 minutes: 1,355
10 to 14 minutes: 1,974
15 to 19 minutes: 2,155
20 to 24 minutes: 2,187
25 to 29 minutes: 1,838
30 to 34 minutes: 1,821
35 to 39 minutes: 379
40 to 44 minutes: 481
45 to 59 minutes: 518
60 to 89 minutes: 1,096
90 or more minutes: 338
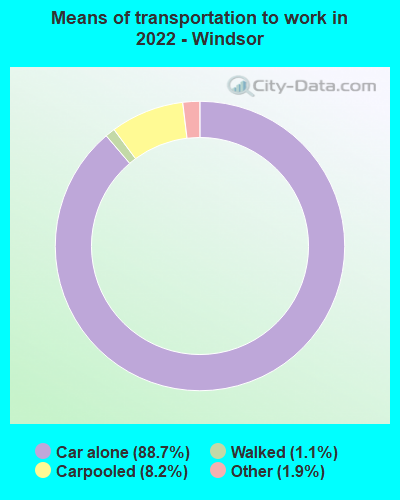
Means of transportation to work:
Drove a car alone: 9,756 (65.7%)
Carpooled: 938 (6.3%)
Taxi: 265 (1.8%)
Bicycle: 4 (0.0%)
Walked: 89 (0.6%)
Worked at home: 4,270 (28.8%)
Unemployment by race in 2022
Unemployment rate for White non-Hispanic residents
3.2%Males
6.0%Females
Unemployment rate for American Indian and Alaska Native residents
7.9%Males
Unemployment rate for Asian residents
7.2%Males
26.3%Females
Unemployment rate for other race residents
19.1%Females
Unemployment rate for two or more race residents
3.4%Males
3.2%Females
Unemployment rate for Hispanic or Latino residents
8.1%Males
5.3%Females
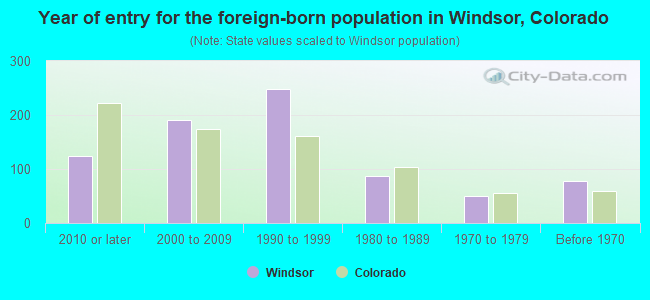
Year of entry for the foreign-born population in Windsor, Colorado
1252010 or later
1912000 to 2009
2491990 to 1999
871980 to 1989
501970 to 1979
77Before 1970
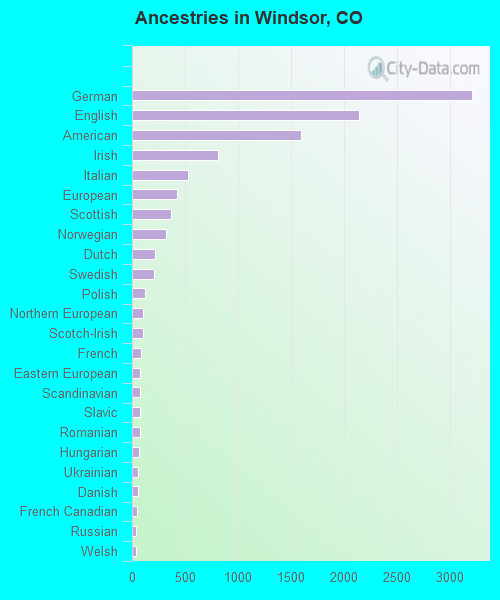
First ancestries reported:
German: 3,208 (22.9%)
English: 2,143 (15.3%)
American: 1,598 (11.4%)
Irish: 807 (5.8%)
Italian: 528 (3.8%)
European: 423 (3.0%)
Scottish: 365 (2.6%)
Norwegian: 322 (2.3%)
Dutch: 221 (1.6%)
Swedish: 212 (1.5%)
Polish: 119 (0.9%)
Northern European: 104 (0.7%)
Scotch-Irish: 101 (0.7%)
French: 87 (0.6%)
Eastern European: 80 (0.6%)
Scandinavian: 78 (0.6%)
Slavic: 74 (0.5%)
Romanian: 71 (0.5%)
Hungarian: 62 (0.4%)
Ukrainian: 56 (0.4%)
Danish: 54 (0.4%)
French Canadian: 48 (0.3%)
Russian: 38 (0.3%)
Welsh: 34 (0.2%)
British: 27 (0.2%)
Greek: 26 (0.2%)
Croatian: 24 (0.2%)
Czech: 24 (0.2%)
Swiss: 24 (0.2%)
Canadian: 23 (0.2%)
Lithuanian: 17 (0.1%)
Iranian: 16 (0.1%)
Lebanese: 15 (0.1%)
German Russian: 9 (0.06%)
Portuguese: 9 (0.06%)
Jamaican: 8 (0.06%)
Slovak: 6 (0.04%)
Finnish: 5 (0.04%)
Austrian: 4 (0.03%)
Most common places of birth for foreign-born residents (%):
India
Windsor:
18.6% (151)
Colorado:
4.0% (21,689)
Mexico
Windsor:
14.8% (120)
Colorado:
38.3% (209,491)
Philippines
Windsor:
8.2% (67)
Colorado:
2.3% (12,342)
Romania
Windsor:
7.9% (64)
Colorado:
0.3% (1,615)
Canada
Windsor:
7.6% (62)
Colorado:
2.7% (15,026)
Taiwan
Windsor:
5.9% (48)
Colorado:
0.5% (2,651)
Ukraine
Windsor:
4.6% (37)
Colorado:
0.8% (4,267)
Iran
Windsor:
3.8% (31)
Colorado:
0.7% (3,568)
England
Windsor:
3.7% (30)
Colorado:
1.2% (6,672)
Hungary
Windsor:
3.6% (29)
Colorado:
0.2% (1,186)
United Kingdom, excluding England and Scotland
Windsor:
3.0% (24)
Colorado:
1.1% (5,799)
Netherlands
Windsor:
3.0% (24)
Colorado:
0.3% (1,640)
China, excluding Hong Kong and Taiwan
Windsor:
2.7% (22)
Colorado:
3.3% (17,998)
Egypt
Windsor:
2.3% (19)
Colorado:
0.2% (1,089)
Laos
Windsor:
2.2% (18)
Colorado:
0.4% (2,063)
Germany
Windsor:
2.2% (18)
Colorado:
2.5% (13,706)
Place of birth for U.S.-born residents:
This state: 17,294
Other state: 16,645
Northeast: 1,870
Midwest: 6,902
South: 3,120
West: 4,684
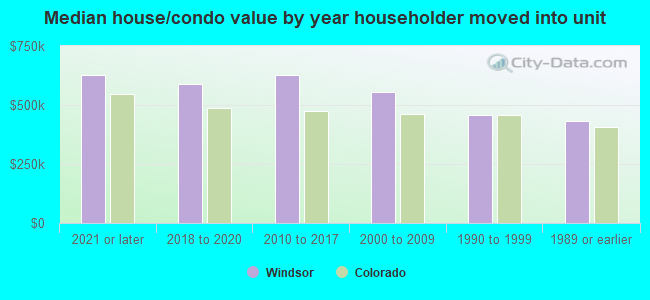
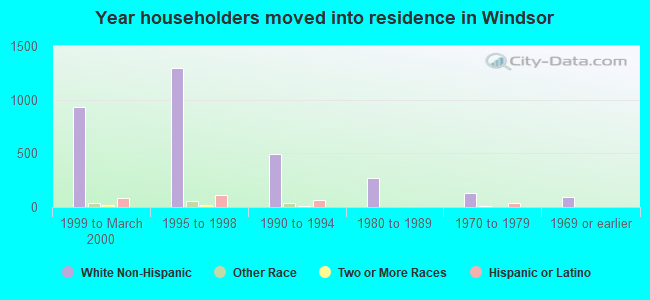
83.5% of Windsor residents lived in the same house 1 years ago. Out of people who lived in different houses, 22.9% lived in this county. Out of people who lived in different counties, 61.6% lived in Colorado.
Windsor:
83.5%
State average:
83.6%
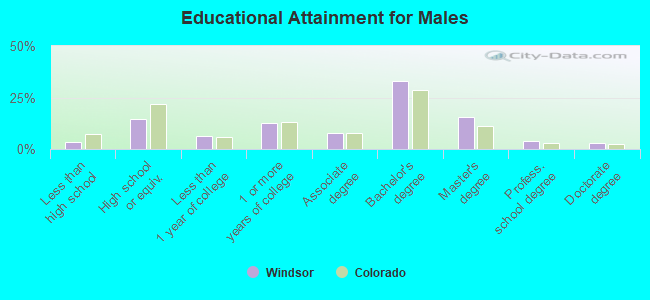
Education attainment for males 25 years and older:
No schooling: 8
Nursery to 4th grade: 36
5th and 6th grade: 34
7th and 8th grade: 26
9th grade: 66
10th grade: 95
11th grade: 47
12th grade, no diploma: 110
High school graduate (or equivalency): 1,941
Less than 1 year of college: 859
Some college more than 1 year, no degree: 1,647
Associate degree: 1,045
Bachelor's degree: 4,373
Master's degree: 2,025
Professional school degree: 539
Doctorate degree: 388
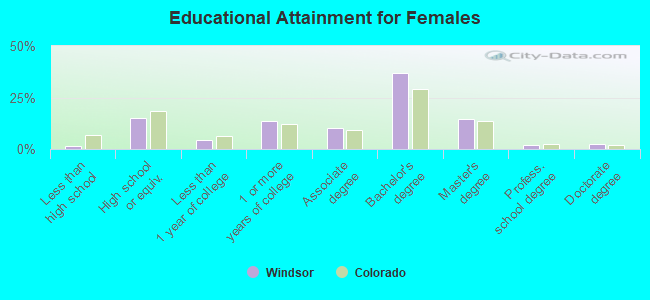
Education attainment for females 25 years and older:
No schooling: 0
Nursery to 4th grade: 0
5th and 6th grade: 13
7th and 8th grade: 7
9th grade: 0
10th grade: 14
11th grade: 72
12th grade, no diploma: 101
High school graduate (or equivalency): 1,950
Less than 1 year of college: 569
Some college more than 1 year, no degree: 1,787
Associate degree: 1,325
Bachelor's degree: 4,822
Master's degree: 1,911
Professional school degree: 261
Doctorate degree: 311
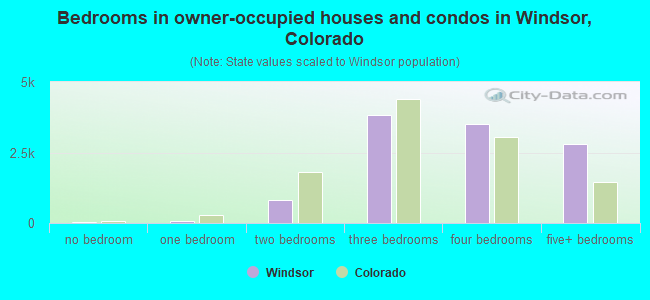
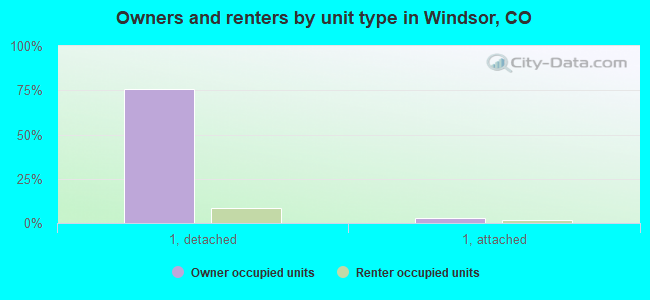
Housing units in structures:
One, detached: 11,912
One, attached: 655
Two: 23
3 or 4: 292
5 to 9: 705
10 to 19: 197
20 to 49: 100
50 or more: 427
Housing units lacking complete plumbing facilities in 2022: 0.2%
Housing units lacking complete kitchen facilities in 2022: 0.6%