Woodstock, IL (Illinois) Houses and Residents
| Woodstock: | $232,969 |
| Illinois: | $251,600 |
Mean price in 2022:
Detached houses: $267,562
Here: $267,562 State: $310,164 Townhouses or other attached units: $192,449
Here: $192,449 State: $286,230 In 2-unit structures: $155,106
Here: $155,106 State: $299,638 In 3-to-4-unit structures: $1,922,251
Here: $1,922,251 State: $330,907 In 5-or-more-unit structures: $134,708
Here: $134,708 State: $318,887
Total population: 25,178 (Urban population: 19,946 (all inside urban clusters), Rural population: 422 (all nonfarm))
Houses: 10,633 (10,364 occupied: 7,052 owner occupied, 3,436 renter occupied)
| % of renters here: | 33% |
| State: | 33% |
Housing density: 998 houses/condos per square mile
Median price asked for vacant for-sale houses and condos in 2022: $192,452.
Median contract rent in 2022: $865 (lower quartile is $749, upper quartile is $1,077)
Median rent asked for vacant for-rent units in 2022: $1,021
Median gross rent in Woodstock, IL in 2022: $1,054
Housing units in Woodstock with a mortgage: 4,741 (295 second mortgage, 0 home equity loan, 294 both second mortgage and home equity loan)
Houses without a mortgage: 86
Median household income for houses/condos with a mortgage: $101,168
Median household income for apartments without a mortgage: $96,568
Median monthly housing costs: $1,240
Compare current foreclosures in Woodstock, IL:
| Photo | Address | Area | Beds / Baths | Price | Details |
|---|---|---|---|---|---|

|
#1
Tappan St
Woodstock, IL 60098
|
925 sq. feet
|
1 baths 3 beds |
show details | |

|
#2
Lucas Rd
Woodstock, IL 60098
|
1,480 sq. feet
|
2 baths 3 beds |
show details | |

|
#3
Brown St
Woodstock, IL 60098
|
812 sq. feet
|
1 baths 3 beds |
show details | |

|
#4
Leah Ln Apt 2a
Woodstock, IL 60098
|
801 sq. feet
|
1 baths 2 beds |
show details | |

|
#5
Sudburg Ct
Woodstock, IL 60098
|
3,000 sq. feet
|
2 baths 4 beds |
show details | |

|
#6
Clover Chase Cir
Woodstock, IL 60098
|
1,917 sq. feet
|
2 baths 3 beds |
show details | |

|
#7
S Valley Hill Rd
Woodstock, IL 60098
|
2,540 sq. feet
|
3 baths 4 beds |
show details | |

|
#8
Quail Ct
Woodstock, IL 60098
|
- sq. feet
|
2 baths 4 beds |
show details | |

|
#9
Olive St
Woodstock, IL 60098
|
1,152 sq. feet
|
- baths 2 beds |
show details | |

|
#10
Chopin Ln
Woodstock, IL 60098
|
- sq. feet
|
2 baths 4 beds |
show details |
| Photo | Address | Area | Beds / Baths | Price | Details |
|---|---|---|---|---|---|

|
#11
Fieldstone Dr
Woodstock, IL 60098
|
2,336 sq. feet
|
- baths - beds |
show details | |

|
#12
Irving Ave
Woodstock, IL 60098
|
2,800 sq. feet
|
- baths - beds |
show details | |

|
#13
Tryon St
Woodstock, IL 60098
|
3,510 sq. feet
|
- baths - beds |
show details | |

|
#14
Leah Ln # 1
Woodstock, IL 60098
|
- sq. feet
|
- baths - beds |
show details | |

|
#15
Aspen Dr
Woodstock, IL 60098
|
1,000 sq. feet
|
- baths - beds |
show details | |

|
#16
W Jackson St Apt 1
Woodstock, IL 60098
|
- sq. feet
|
- baths - beds |
show details | |

|
#17
Eastwood Dr
Woodstock, IL 60098
|
- sq. feet
|
- baths - beds |
show details | |

|
#18
Washington St
Woodstock, IL 60098
|
- sq. feet
|
- baths - beds |
show details | |

|
#19
Oakleaf Ln
Woodstock, IL 60098
|
- sq. feet
|
- baths - beds |
show details | |

|
#20
N Seminary Ave
Woodstock, IL 60098
|
- sq. feet
|
- baths - beds |
show details |
| Photo | Address | Area | Beds / Baths | Price | Details |
|---|---|---|---|---|---|

|
#21
S Madison St
Woodstock, IL 60098
|
2,144 sq. feet
|
- baths - beds |
show details | |

|
#22
S Fleming Rd
Woodstock, IL 60098
|
- sq. feet
|
- baths - beds |
show details | |

|
#23
Northampton St
Woodstock, IL 60098
|
- sq. feet
|
- baths - beds |
show details | |

|
#24
Christian Way
Woodstock, IL 60098
|
- sq. feet
|
- baths - beds |
show details | |

|
#25
Northampton St
Woodstock, IL 60098
|
1,152 sq. feet
|
- baths - beds |
show details | |

|
#26
Irving Ave
Woodstock, IL 60098
|
- sq. feet
|
- baths - beds |
show details | |

|
#27
Willow Brooke Dr Apt 1a
Woodstock, IL 60098
|
- sq. feet
|
- baths - beds |
show details | |

|
#28
Leah Ln Apt 2c
Woodstock, IL 60098
|
- sq. feet
|
- baths - beds |
show details | |

|
#29
N Seminary Ave
Woodstock, IL 60098
|
- sq. feet
|
- baths - beds |
show details | |

|
#30
Braeburn Way
Woodstock, IL 60098
|
- sq. feet
|
- baths - beds |
show details |
| Photo | Address | Area | Beds / Baths | Price | Details |
|---|---|---|---|---|---|

|
#31
Elm Ln
Woodstock, IL 60098
|
794 sq. feet
|
- baths - beds |
show details | |

|
#32
Butterfield Rd
Woodstock, IL 60098
|
- sq. feet
|
- baths - beds |
show details | |

|
#33
Mcconnell Rd
Woodstock, IL 60098
|
- sq. feet
|
- baths - beds |
show details | |

|
#34
Lee Ann Ln
Woodstock, IL 60098
|
- sq. feet
|
- baths - beds |
show details | |

|
#35
Commons Dr, Apt 1
Woodstock, IL 60098
|
- sq. feet
|
- baths - beds |
show details | |

|
#36
Sunset Ridge Rd
Woodstock, IL 60098
|
1,355 sq. feet
|
- baths - beds |
show details | |

|
#37
Us Highway 14
Woodstock, IL 60098
|
- sq. feet
|
- baths - beds |
show details | |

|
#38
Jonathon Ln
Woodstock, IL 60098
|
2,990 sq. feet
|
- baths - beds |
show details | |

|
#39
Commons Dr, Unit 2g
Woodstock, IL 60098
|
- sq. feet
|
- baths - beds |
show details | |

|
#40
S Eastwood Dr
Woodstock, IL 60098
|
- sq. feet
|
- baths - beds |
show details |
| Photo | Address | Area | Beds / Baths | Price | Details |
|---|---|---|---|---|---|

|
#41
S Il Route 47
Woodstock, IL 60098
|
1,790 sq. feet
|
- baths - beds |
show details | |

|
#42
S Il Route 47
Woodstock, IL 60098
|
- sq. feet
|
- baths - beds |
show details | |

|
#43
Jewett St
Woodstock, IL 60098
|
- sq. feet
|
- baths 3 beds |
show details | |

|
#44
Eastwood Dr
Woodstock, IL 60098
|
- sq. feet
|
- baths - beds |
show details | |

|
#45
Eastwood Dr
Woodstock, IL 60098
|
6,263 sq. feet
|
- baths - beds |
show details | |

|
#46
Eastwood Dr
Woodstock, IL 60098
|
- sq. feet
|
- baths - beds |
show details | |

|
#47
Wild Meadow Ln
Woodstock, IL 60098
|
- sq. feet
|
- baths - beds |
show details | |

|
#48
Eastwood Dr
Woodstock, IL 60098
|
- sq. feet
|
- baths - beds |
show details | |

|
#49
Barbary Ln
Woodstock, IL 60098
|
2,032 sq. feet
|
- baths - beds |
show details | |

|
Check over 1 million property listings on Foreclosure.com!
|
browse all offers | |||

Latest news about housing in Woodstock, IL collected exclusively by city-data.com from local newspapers, TV, and radio stations

 | Apartments in Crystal Lake and Woodstock (2 replies) |
| Rentals in Woodstock (0 replies) |
| Opinion on Algonquin/Carpentersville homes off Randall Rd (21 replies) |
| New job, new home/Woodstock (7 replies) |
| Live in Chicagoland, Work in Rockford (26 replies) |
| top 3 areas to avoid in nw suburbs (84 replies) |
Median year apartment built: 1977
Household type by relationship:
Households: 26,135- Male householders: 4,603 (1,111 living alone), Female householders: 5,656 (1,661 living alone)
4,554 spouses (4,545 opposite-sex spouses), 601 unmarried partners, (592 opposite-sex unmarried partners), 7,835 children (7,581 natural, 56 adopted, 197 stepchildren), 277 grandchildren, 403 brothers or sisters, 604 parents, 0 foster children, 304 other relatives, 469 non-relatives
- In group quarters: 824
Size of family households: 2,872 2-persons, 1,476 3-persons, 1,560 4-persons, 681 5-persons, 160 6-persons, 111 7-or-more-persons.
Size of nonfamily households: 3,189 1-person, 410 2-persons, 54 3-persons, 13 4-persons.
3,402 married couples with children.
1,788 single-parent households (224 men, 1,564 women).
78.4% of residents of Woodstock speak English at home.
17.5% of residents speak Spanish at home (66% speak English very well, 20% speak English well, 10% speak English not well, 3% don't speak English at all).
2.2% of residents speak other Indo-European language at home (81% speak English very well, 7% speak English well, 7% speak English not well, 5% don't speak English at all).
1.7% of residents speak Asian or Pacific Island language at home (79% speak English very well, 3% speak English well, 18% speak English not well).
Foreign born population: 3,186 (12.2%)
(47.5% of them are naturalized citizens)
| Here: | 6.7 |
| State: | 6.4 |
| Here: | 3.8 |
| State: | 4.1 |

- Bedrooms in owner-occupied houses and condos in Woodstock, Illinois
- 36no bedroom
- 1481 bedroom
- 1,2472 bedrooms
- 3,8573 bedrooms
- 1,5504 bedrooms
- 2155+ bedrooms

- Bedrooms in renter-occupied apartments in Woodstock, Illinois
- 242no bedroom
- 9661 bedroom
- 1,6522 bedrooms
- 5153 bedrooms
- 374 bedrooms
- 255+ bedrooms

- Cars and other vehicles available in Woodstock in owner-occupied houses/condos
- 167no vehicle
- 1,9841 vehicle
- 2,9852 vehicles
- 1,0613 vehicles
- 7534 vehicles
- 1015+ vehicles

- Cars and other vehicles available in Woodstock in renter-occupied apartments
- 560no vehicle
- 1,8481 vehicle
- 8052 vehicles
- 2233 vehicles
- 04 vehicles
- 05+ vehicles

- Rooms in owner-occupied houses in Woodstock, Illinois
- 361 room
- 52 rooms
- 423 rooms
- 7354 rooms
- 1,3975 rooms
- 1,1836 rooms
- 1,1387 rooms
- 1,3028 rooms
- 1,2149+ rooms

- Rooms in renter-occupied apartments in Woodstock, Illinois
- 2321 room
- 1102 rooms
- 6053 rooms
- 1,2354 rooms
- 6895 rooms
- 3066 rooms
- 1457 rooms
- 618 rooms
- 529+ rooms


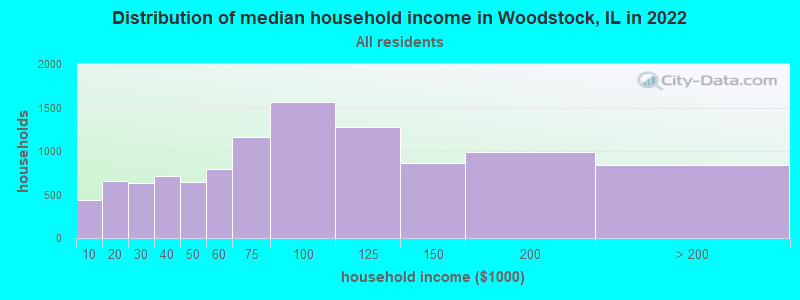
Woodstock, IL household income distribution

- 439Less than $10,000
- 656$10,000 to $19,999
- 628$20,000 to $29,999
- 711$30,000 to $39,999
- 641$40,000 to $49,999
- 793$50,000 to $59,999
- 1,166$60,000 to $74,999
- 1,559$75,000 to $99,999
- 1,277$100,000 to $124,999
- 862$125,000 to $149,999
- 992$150,000 to $199,999
- 840$200,000 or more
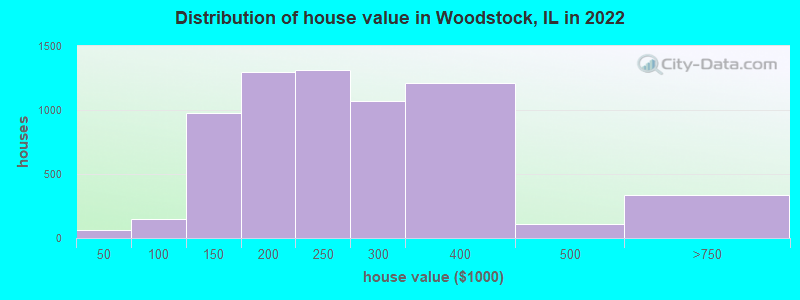
Home value of owner - occupied houses in 2022 in Woodstock, IL
-
- 13$15,000 to $19,999
- 21$20,000 to $24,999
- 24$25,000 to $29,999
- 8$60,000 to $69,999
- 87$70,000 to $79,999
- 21$80,000 to $89,999
- 32$90,000 to $99,999
- 220$100,000 to $124,999
- 753$125,000 to $149,999
- 562$150,000 to $174,999
- 731$175,000 to $199,999
- 1,309$200,000 to $249,999
- 1,072$250,000 to $299,999
- 1,208$300,000 to $399,999
- 112$400,000 to $499,999
- 336$500,000 to $749,999
Rent paid by renters in 2022 in Woodstock, IL
-
- 9Less than $100
- 46$150 to $199
- 139$200 to $249
- 66$250 to $299
- 7$300 to $349
- 19$350 to $399
- 48$400 to $449
- 35$450 to $499
- 61$500 to $549
- 14$550 to $599
- 81$600 to $649
- 100$650 to $699
- 12$700 to $749
- 146$750 to $799
- 383$800 to $899
- 503$900 to $999
- 915$1,000 to $1,249
- 354$1,250 to $1,499
- 260$1,500 to $1,999
- 25$2,000 to $2,499
- 10$2,500 to $2,999
- 8$3,500 or more
- 137No cash rent


Percentage of workers working in this county: 77.2%
Number of people working at home: 1,471 (10.7% of all workers)
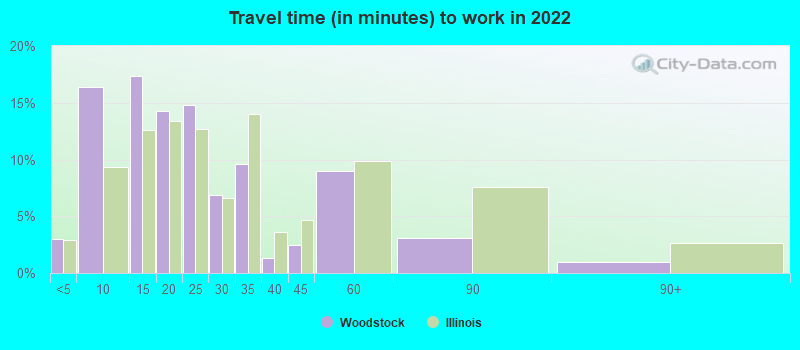
Travel time to work (commute)
- Less than 5 minutes: 249
- 5 to 9 minutes: 1,665
- 10 to 14 minutes: 1,719
- 15 to 19 minutes: 1,363
- 20 to 24 minutes: 1,655
- 25 to 29 minutes: 939
- 30 to 34 minutes: 1,364
- 35 to 39 minutes: 290
- 40 to 44 minutes: 586
- 45 to 59 minutes: 955
- 60 to 89 minutes: 878
- 90 or more minutes: 291
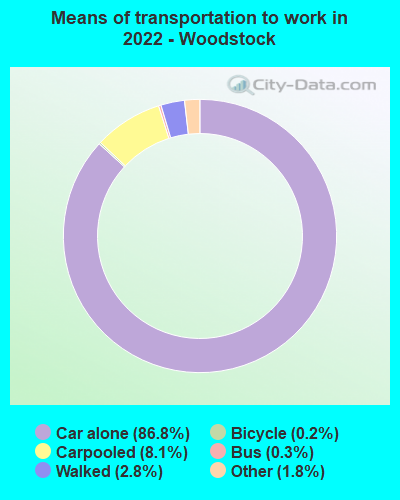
Means of transportation to work:
- Drove a car alone: 8,852 (73.1%)
- Carpooled: 933 (7.7%)
- Bus: 28 (0.2%)
- Taxi: 268 (2.2%)
- Bicycle: 23 (0.2%)
- Walked: 297 (2.5%)
- Worked at home: 1,471 (12.1%)

- Unemployment by race in 2022
- Unemployment rate for White non-Hispanic residents
- 5.3%Males
- 3.4%Females
- Unemployment rate for Black residents
- 14.4%Males
- 2.1%Females
- Unemployment rate for two or more race residents
- 4.2%Males
- 0.8%Females
- Unemployment rate for Hispanic or Latino residents
- 7.1%Males
- 0.3%Females

- Year of entry for the foreign-born population in Woodstock, Illinois
- 2892010 or later
- 1,0492000 to 2009
- 6221990 to 1999
- 8101980 to 1989
- 2511970 to 1979
- 342Before 1970

First ancestries reported:
- German: 1,511 (13.8%)
- Irish: 1,046 (9.5%)
- Polish: 631 (5.7%)
- Swedish: 509 (4.6%)
- Italian: 429 (3.9%)
- English: 375 (3.4%)
- American: 288 (2.6%)
- European: 181 (1.6%)
- French: 136 (1.2%)
- Czech: 79 (0.7%)
- Danish: 77 (0.7%)
- Dutch: 55 (0.5%)
- Norwegian: 54 (0.5%)
- African: 54 (0.5%)
- Northern European: 43 (0.4%)
- Hungarian: 43 (0.4%)
- Croatian: 39 (0.4%)
- Scottish: 38 (0.3%)
- Scotch-Irish: 37 (0.3%)
- Finnish: 33 (0.3%)
- Ukrainian: 33 (0.3%)
- Lithuanian: 28 (0.3%)
- Russian: 26 (0.2%)
- Belizean: 17 (0.2%)
- Scandinavian: 15 (0.1%)
- Albanian: 13 (0.1%)
- Romanian: 12 (0.1%)
- Welsh: 10 (0.09%)
- Yugoslavian: 9 (0.08%)
- Armenian: 8 (0.07%)
- Eastern European: 8 (0.07%)
- French Canadian: 6 (0.05%)
- Slovene: 5 (0.05%)
- British: 4 (0.04%)
- Jamaican: 4 (0.04%)
Most common places of birth for foreign-born residents (%):
| Woodstock: | 66.2% (1,960) |
| Illinois: | 34.7% (626,958) |
| Woodstock: | 6.9% (204) |
| Illinois: | 5.2% (93,003) |
| Woodstock: | 4.1% (122) |
| Illinois: | 6.9% (124,474) |
| Woodstock: | 4.0% (118) |
| Illinois: | 0.2% (3,867) |
| Woodstock: | 2.6% (77) |
| Illinois: | 9.2% (166,409) |
| Woodstock: | 2.5% (74) |
| Illinois: | 0.2% (2,861) |
| Woodstock: | 2.2% (65) |
| Illinois: | 0.6% (10,762) |
| Woodstock: | 1.8% (53) |
| Illinois: | 1.0% (18,753) |
Place of birth for U.S.-born residents:
- This state: 18,662
- Other state: 4,102
- Northeast: 713
- Midwest: 1,695
- South: 658
- West: 1,019
85.2% of Woodstock residents lived in the same house 1 years ago.
Out of people who lived in different houses, 33.7% lived in this county.
Out of people who lived in different counties, 69.5% lived in Illinois.
| Woodstock: | 85.2% |
| State average: | 88.3% |
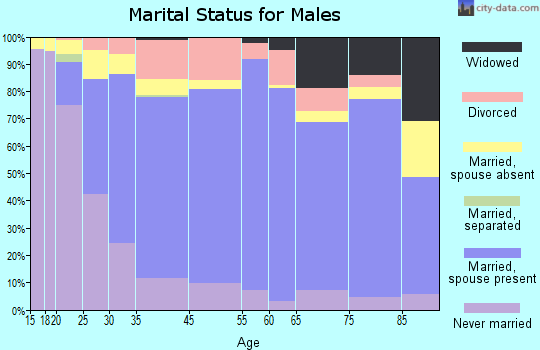
Education attainment for males 25 years and older:
- No schooling: 79
- Nursery to 4th grade: 0
- 5th and 6th grade: 209
- 7th and 8th grade: 55
- 9th grade: 99
- 10th grade: 126
- 11th grade: 174
- 12th grade, no diploma: 181
- High school graduate (or equivalency): 2,452
- Less than 1 year of college: 526
- Some college more than 1 year, no degree: 1,189
- Associate degree: 464
- Bachelor's degree: 1,543
- Master's degree: 911
- Professional school degree: 128
- Doctorate degree: 63

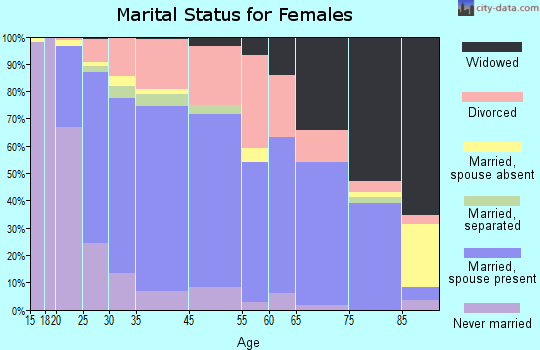
Education attainment for females 25 years and older:
- No schooling: 176
- Nursery to 4th grade: 18
- 5th and 6th grade: 107
- 7th and 8th grade: 109
- 9th grade: 43
- 10th grade: 53
- 11th grade: 36
- 12th grade, no diploma: 120
- High school graduate (or equivalency): 2,359
- Less than 1 year of college: 893
- Some college more than 1 year, no degree: 1,351
- Associate degree: 949
- Bachelor's degree: 1,510
- Master's degree: 1,255
- Professional school degree: 129
- Doctorate degree: 34

Housing units in structures:
- One, detached: 6,125
- One, attached: 1,390
- Two: 417
- 3 or 4: 653
- 5 to 9: 864
- 10 to 19: 614
- 20 to 49: 224
- 50 or more: 342
House/condo owner moved in on average 8 years ago
Renter moved in on average 2 years ago

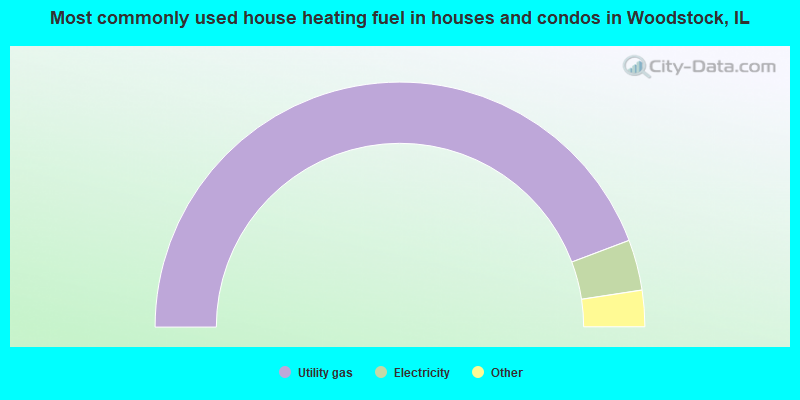
- 88.5%Utility gas
- 6.7%Electricity
- 3.4%Bottled, tank, or LP gas
- 0.8%Solar energy
- 0.4%No fuel used
- 0.2%Wood
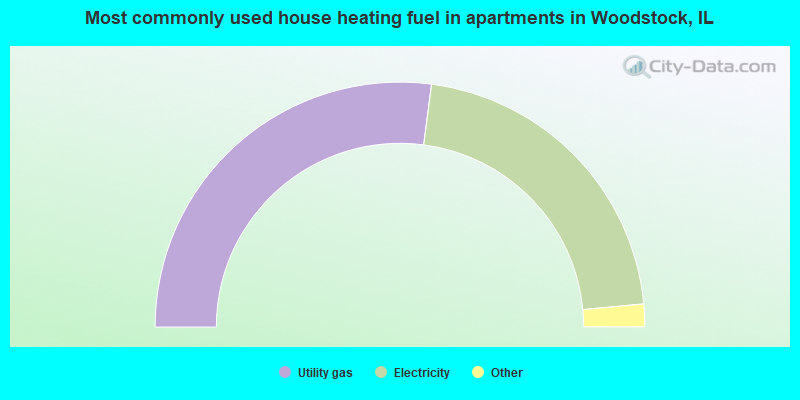
- 54.2%Utility gas
- 42.9%Electricity
- 1.3%No fuel used
- 1.1%Bottled, tank, or LP gas
- 0.6%Other fuel
Private vs. public school enrollment:
| Here: | 5.7% |
| Illinois: | 13.3% |
| Here: | 12.2% |
| Illinois: | 9.9% |
| Here: | 13.7% |
| Illinois: | 27.4% |


