Worcester, MA (Massachusetts) Houses and Residents
Estimated median house or condo value in 2022: $363,600 (it was $118,400 in 2000 )
Worcester:
$363,600Massachusetts:
$534,700
Lower value quartile - upper value quartile: $280,900 - $461,400Mean price in 2022: Detached houses: $383,463 Here:
$383,463State:
$651,570
Townhouses or other attached units: $305,009 Here:
$305,009State:
$617,749
In 2-unit structures: $306,989 Here:
$306,989State:
$594,808
In 3-to-4-unit structures: $353,918 Here:
$353,918State:
$601,912
In 5-or-more-unit structures: $237,685 Here:
$237,685State:
$555,768
Mobile homes: $228,248 Here:
$228,248State:
$170,209
Total population: 183,016 (Urban population: 172,648, Rural population: 0)
Houses: 85,298 (80,177 occupied: 30,754 owner occupied, 49,423 renter occupied )
% of renters here:
62%State:
38%
Housing density: 2,271 houses/condos per square mile
Median price asked for vacant for-sale houses and condos in 2022: $152,416.
Median contract rent in 2022: $1,146 (lower quartile is $849, upper quartile is $1,484)
Median rent asked for vacant for-rent units in 2022: $1,408
Median gross rent in Worcester, MA in 2022: $1,375
Housing units in Worcester with a mortgage: 19,750 (2,676 second mortgage, 82 home equity loan, 1,926 both second mortgage and home equity loan )Houses without a mortgage: 807
Median household income for houses/condos with a mortgage: $120,695
Median household income for apartments without a mortgage: $77,042
Median monthly housing costs: $1,451
Data:
Median house or condo value ($)
Median house or condo value ($ change since 2000)
Median house or condo value ($) - White
Median house or condo value ($) - Black or African American
Median house or condo value ($) - Asian
Median house or condo value ($) - Hispanic or Latino
Median house or condo value ($) - American Indian and Alaska Native
Median house or condo value ($) - Multirace
Median house or condo value ($) - Other Race
Median price asked for mobile homes ($)
Household density (households per square mile)
Mean house or condo value by units in structure - 1, detached ($)
Mean house or condo value by units in structure - 1, attached ($)
Mean house or condo value by units in structure - 2 ($)
Mean house or condo value by units in structure by units in structure - 3 or 4 ($)
Mean house or condo value by units in structure - 5 or more ($)
Mean house or condo value by units in structure - Boat, RV, van, etc. ($)
Mean house or condo value by units in structure - Mobile home ($)
Median contract rent ($)
Median contract rent - Lower quartile ($)
Median contract rent - Upper quartile ($)
Median gross rent ($)
Urban houses (%)
Rural houses (%)
Houses occupied (%)
Houses occupied (% change since 2000)
Houses owner occupied (%)
Houses owner occupied (% change since 2000)
Houses renter occupied (%)
Houses renter occupied (% change since 2000)
Vacant housing units - For rent (%)
Vacant housing units - For rent (% change since 2000)
Vacant housing units - For sale only (%)
Vacant housing units - For sale only (% change since 2000)
Vacant housing units - Rented or sold, not occupied (%)
Vacant housing units - Rented or sold, not occupied (% change since 2000)
Vacant housing units - For seasonal, recreational, or occasional use (%)
Vacant housing units - For seasonal, recreational, or occasional use (% change since 2000)
Vacant housing units - For migrant workers (%)
Vacant housing units - For migrant workers (% change since 2000)
Vacant housing units - Other vacant (%)
Vacant housing units - Other vacant (% change since 2000)
Median monthly housing costs ($)
Median household income for houses/condos with a mortgage ($)
Median household income for houses/condos without a mortgage ($)
Median household income ($)
Median household income ($) - White
Median household income ($) - Black or African American
Median household income ($) - Asian
Median household income ($) - Hispanic or Latino
Median household income ($) - American Indian and Alaska Native
Median household income ($) - Multirace
Median household income ($) - Other Race
Mortgage status - with mortgage (%)
Mortgage status - with second mortgage (%)
Mortgage status - with home equity loan (%)
Mortgage status - with both second mortgage and home equity loan (%)
Mortgage status - without a mortgage (%)
Median year house/condo built
Median year apartment built
Household type by relationship - Male householder living alone (%)
Household type by relationship - Male householder not living alone (%)
Household type by relationship - Female householder living alone (%)
Household type by relationship - Female householder not living alone (%)
Household type by relationship - Opposite-Sex spouse (%)
Household type by relationship - Same-Sex spouse (%)
Household type by relationship - Opposite-Sex unmarried partner (%)
Household type by relationship - Same-Sex unmarried partner (%)
Household type by relationship - In group quarters (%)
Size of family households - 2-person household (%)
Size of family households - 3-person household (%)
Size of family households - 4-person household (%)
Size of family households - 5-person household (%)
Size of family households - 6-person household (%)
Size of family households - 7-or-more-person household (%)
Size of nonfamily households - 1-person household (%)
Size of nonfamily households - 2-person household (%)
Size of nonfamily households - 3-person household (%)
Size of nonfamily households - 4-person household (%)
Size of nonfamily households - 5-person household (%)
Size of nonfamily households - 6-person household (%)
Size of nonfamily households - 7-or-moreperson household (%)
Year house built - Built 2010 or later (%)
Year house built - Built 2000 to 2009 (%)
Year house built - Built 1990 to 1999 (%)
Year house built - Built 1980 to 1989 (%)
Year house built - Built 1970 to 1979 (%)
Year house built - Built 1960 to 1969 (%)
Year house built - Built 1950 to 1959 (%)
Year house built - Built 1940 to 1949 (%)
Year house built - Built 1939 or earlier (%)
Median number of rooms in houses and condos
Median number of rooms in apartments
Median number of bedrooms in owner occupied houses
Mean number of bedrooms in owner occupied houses
Median number of bedrooms in renter occupied houses
Mean number of bedrooms in renter occupied houses
Median number of vehichles in owner occupied houses
Mean number of vehichles in owner occupied houses
Median number of vehichles in renter occupied houses
Mean number of vehichles in renter occupied houses
Rooms in owner-occupied houses - 1 room (%)
Rooms in owner-occupied houses - 2 rooms (%)
Rooms in owner-occupied houses - 3 rooms (%)
Rooms in owner-occupied houses - 4 rooms (%)
Rooms in owner-occupied houses - 5 rooms (%)
Rooms in owner-occupied houses - 6 rooms (%)
Rooms in owner-occupied houses - 7 rooms (%)
Rooms in owner-occupied houses - 8 rooms (%)
Rooms in owner-occupied houses - 9+ rooms (%)
Rooms in renter-occupied houses - 1 room (%)
Rooms in renter-occupied houses - 2 rooms (%)
Rooms in renter-occupied houses - 3 rooms (%)
Rooms in renter-occupied houses - 4 rooms (%)
Rooms in renter-occupied houses - 5 rooms (%)
Rooms in renter-occupied houses - 6 rooms (%)
Rooms in renter-occupied houses - 7 rooms (%)
Rooms in renter-occupied houses - 8 rooms (%)
Rooms in renter-occupied houses - 9+ rooms (%)
Bedrooms in owner-occupied houses - no bedrooms (%)
Bedrooms in owner-occupied houses - 1 bedroom (%)
Bedrooms in owner-occupied houses - 2 bedrooms (%)
Bedrooms in owner-occupied houses - 3 bedrooms (%)
Bedrooms in owner-occupied houses - 4 bedrooms (%)
Bedrooms in owner-occupied houses - 5+ bedrooms (%)
Bedrooms in renter-occupied houses - no bedrooms (%)
Bedrooms in renter-occupied houses - 1 bedroom (%)
Bedrooms in renter-occupied houses - 2 bedrooms (%)
Bedrooms in renter-occupied houses - 3 bedrooms (%)
Bedrooms in renter-occupied houses - 4 bedrooms (%)
Bedrooms in renter-occupied houses - 5+ bedrooms (%)
Vehicles available in owner-occupied houses - no vehicle available (%)
Vehicles available in owner-occupied houses - 1 vehicle available(%)
Vehicles available in owner-occupied houses - 2 Vehicles available (%)
Vehicles available in owner-occupied houses - 3 Vehicles available (%)
Vehicles available in owner-occupied houses - 4 Vehicles available (%)
Vehicles available in owner-occupied houses - 5+ Vehicles available (%)
Vehicles available in renter-occupied houses - no vehicle available (%)
Vehicles available in renter-occupied houses - 1 vehicle available (%)
Vehicles available in renter-occupied houses - 2 Vehicles available (%)
Vehicles available in renter-occupied houses - 3 Vehicles available (%)
Vehicles available in renter-occupied houses - 4 Vehicles available (%)
Vehicles available in renter-occupied houses - 5+ Vehicles available (%)
Housing units in structures - 1, detached (%)
Housing units in structures - 1, attached (%)
Housing units in structures - 2 (%)
Housing units in structures - 3 or 4 (%)
Housing units in structures - 5 to 9 (%)
Housing units in structures - 10 to 19 (%)
Housing units in structures - 20 to 49 (%)
Housing units in structures - 50 or more (%)
Housing units in structures - Mobile home (%)
Housing units in structures - Boat, RV, van, etc. (%)
Housing units in structures - Owners - 1, detached (%)
Housing units in structures - Owners - 1, attached (%)
Housing units in structures - Owners - 2 (%)
Housing units in structures - Owners - 3 or 4 (%)
Housing units in structures - Owners - 5 to 9 (%)
Housing units in structures - Owners - 10 to 19 (%)
Housing units in structures - Owners - 20 to 49 (%)
Housing units in structures - Owners - 50 or more (%)
Housing units in structures - Owners - Mobile home (%)
Housing units in structures - Owners - Boat, RV, van, etc. (%)
Housing units in structures - Renters - 1, detached (%)
Housing units in structures - Renters - 1, attached (%)
Housing units in structures - Renters - 2 (%)
Housing units in structures - Renters - 3 or 4 (%)
Housing units in structures - Renters - 5 to 9 (%)
Housing units in structures - Renters - 10 to 19 (%)
Housing units in structures - Renters - 20 to 49 (%)
Housing units in structures - Renters - 50 or more (%)
Housing units in structures - Renters - Mobile home (%)
Housing units in structures - Renters - Boat, RV, van, etc. (%)
House/condo owner moved in on average (years ago)
Renter moved in on average (years ago)
Year householder moved into unit - Moved in 1999 to March 2000 (%)
Year householder moved into unit - Moved in 1999 to March 2000 (%) - White
Year householder moved into unit - Moved in 1999 to March 2000 (%) - Black or African American
Year householder moved into unit - Moved in 1999 to March 2000 (%) - Asian
Year householder moved into unit - Moved in 1999 to March 2000 (%) - Hispanic or Latino
Year householder moved into unit - Moved in 1999 to March 2000 (%) - American Indian and Alaska Native
Year householder moved into unit - Moved in 1999 to March 2000 (%) - Multirace
Year householder moved into unit - Moved in 1999 to March 2000 (%) - Other Race
Year householder moved into unit - Moved in 1995 to 1998 (%)
Year householder moved into unit - Moved in 1995 to 1998 (%) - White
Year householder moved into unit - Moved in 1995 to 1998 (%) - Black or African American
Year householder moved into unit - Moved in 1995 to 1998 (%) - Asian
Year householder moved into unit - Moved in 1995 to 1998 (%) - Hispanic or Latino
Year householder moved into unit - Moved in 1995 to 1998 (%) - American Indian and Alaska Native
Year householder moved into unit - Moved in 1995 to 1998 (%) - Multirace
Year householder moved into unit - Moved in 1995 to 1998 (%) - Other Race
Year householder moved into unit - Moved in 1990 to 1994 (%)
Year householder moved into unit - Moved in 1990 to 1994 (%) - White
Year householder moved into unit - Moved in 1990 to 1994 (%) - Black or African American
Year householder moved into unit - Moved in 1990 to 1994 (%) - Asian
Year householder moved into unit - Moved in 1990 to 1994 (%) - Hispanic or Latino
Year householder moved into unit - Moved in 1990 to 1994 (%) - American Indian and Alaska Native
Year householder moved into unit - Moved in 1990 to 1994 (%) - Multirace
Year householder moved into unit - Moved in 1990 to 1994 (%) - Other Race
Year householder moved into unit - Moved in 1980 to 1989 (%)
Year householder moved into unit - Moved in 1980 to 1989 (%) - White
Year householder moved into unit - Moved in 1980 to 1989 (%) - Black or African American
Year householder moved into unit - Moved in 1980 to 1989 (%) - Asian
Year householder moved into unit - Moved in 1980 to 1989 (%) - Hispanic or Latino
Year householder moved into unit - Moved in 1980 to 1989 (%) - American Indian and Alaska Native
Year householder moved into unit - Moved in 1980 to 1989 (%) - Multirace
Year householder moved into unit - Moved in 1980 to 1989 (%) - Other Race
Year householder moved into unit - Moved in 1970 to 1979 (%)
Year householder moved into unit - Moved in 1970 to 1979 (%) - White
Year householder moved into unit - Moved in 1970 to 1979 (%) - Black or African American
Year householder moved into unit - Moved in 1970 to 1979 (%) - Asian
Year householder moved into unit - Moved in 1970 to 1979 (%) - Hispanic or Latino
Year householder moved into unit - Moved in 1970 to 1979 (%) - American Indian and Alaska Native
Year householder moved into unit - Moved in 1970 to 1979 (%) - Multirace
Year householder moved into unit - Moved in 1970 to 1979 (%) - Other Race
Year householder moved into unit - Moved in 1969 or earlier (%)
Year householder moved into unit - Moved in 1969 or earlier (%) - White
Year householder moved into unit - Moved in 1969 or earlier (%) - Black or African American
Year householder moved into unit - Moved in 1969 or earlier (%) - Asian
Year householder moved into unit - Moved in 1969 or earlier (%) - Hispanic or Latino
Year householder moved into unit - Moved in 1969 or earlier (%) - American Indian and Alaska Native
Year householder moved into unit - Moved in 1969 or earlier (%) - Multirace
Year householder moved into unit - Moved in 1969 or earlier (%) - Other Race
Housing units lacking complete plumbing facilities (%)
Housing units lacking complete kitchen facilities (%)
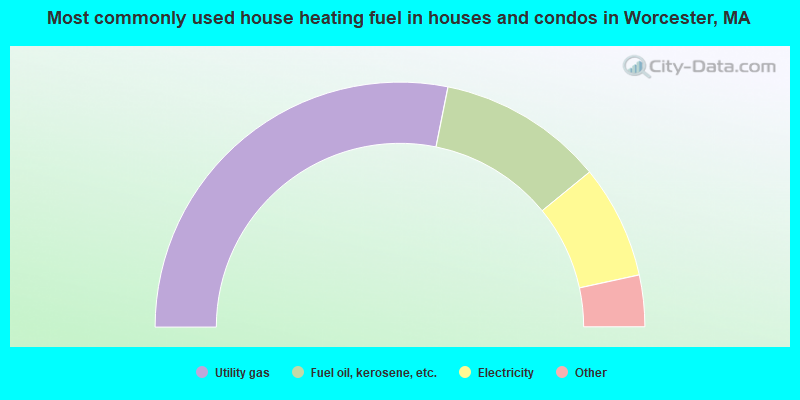
House heating fuel used in houses and condos - Utility gas (%)
House heating fuel used in houses and condos - Bottled, tank, or LP gas (%)
House heating fuel used in houses and condos - Electricity (%)
House heating fuel used in houses and condos - Fuel oil, kerosene, etc. (%)
House heating fuel used in houses and condos - Coal or coke (%)
House heating fuel used in houses and condos - Wood (%)
House heating fuel used in houses and condos - Solar energy (%)
House heating fuel used in houses and condos - Other fuel (%)
House heating fuel used in houses and condos - No fuel used (%)
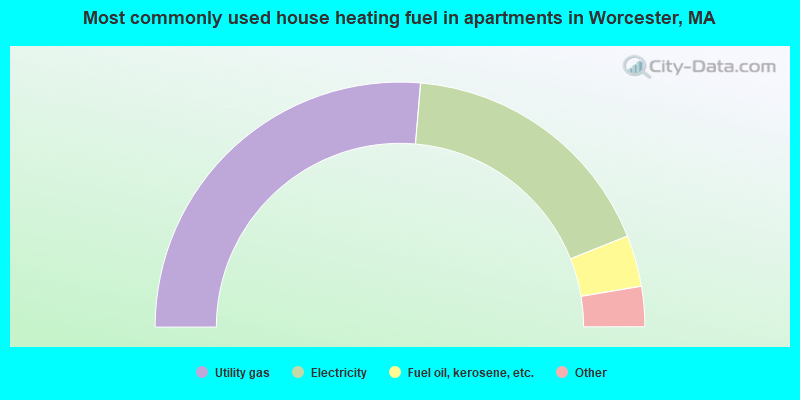
House heating fuel used in apartments - Utility gas (%)
House heating fuel used in apartments - Bottled, tank, or LP gas (%)
House heating fuel used in apartments - Electricity (%)
House heating fuel used in apartments - Fuel oil, kerosene, etc. (%)
House heating fuel used in apartments - Coal or coke (%)
House heating fuel used in apartments - Wood (%)
House heating fuel used in apartments - Solar energy (%)
House heating fuel used in apartments - Other fuel (%)
House heating fuel used in apartments - No fuel used (%)
Latest news about housing in Worcester, MA collected exclusively by city-data.com from local newspapers, TV, and radio stations
Median year house/condo built: 1955Median year apartment built: 1954Household type by relationship:
Households: 205,317
Male householders: 35,923 (11,727 living alone ), Female householders: 44,254 (14,578 living alone )25,509 spouses (24,848 opposite-sex spouses ), 7,788 unmarried partners , (7,362 opposite-sex unmarried partners ), 52,041 children (50,719 natural , 604 adopted , 718 stepchildren ), 2,481 grandchildren , 3,589 brothers or sisters , 4,833 parents , 75 foster children , 3,491 other relatives , 11,256 non-relatives In group quarters: 14,077
Size of family households: 18,554 2-persons , 11,319 3-persons , 9,241 4-persons , 2,734 5-persons , 1,801 6-persons , 945 7-or-more-persons .
Size of nonfamily households: 26,305 1-person , 6,095 2-persons , 2,157 3-persons , 938 4-persons , 88 6-persons .
19,026 married couples with children. single-parent households (4,054 men , 13,683 women ).
59.9% of residents of Worcester speak English at home. of residents speak Spanish at home (58% speak English very well , 17% speak English well , 19% speak English not well , 6% don't speak English at all ).of residents speak other Indo-European language at home (44% speak English very well , 26% speak English well , 14% speak English not well , 16% don't speak English at all ).of residents speak Asian or Pacific Island language at home (50% speak English very well , 24% speak English well , 23% speak English not well , 2% don't speak English at all ).of residents speak other language at home (68% speak English very well , 24% speak English well , 7% speak English not well ).
Foreign born population: 50,901 (24.8%)of them are naturalized citizens )
Median number of rooms in houses and condos:
Median number of rooms in apartments
Owner-occupied Renter-occupied
Bedrooms in owner-occupied houses and condos in Worcester, Massachusetts
183 no bedroom 1,159 1 bedroom 8,799 2 bedrooms 13,806 3 bedrooms 5,160 4 bedrooms 1,647 5+ bedrooms
Bedrooms in renter-occupied apartments in Worcester, Massachusetts
2,199 no bedroom 11,979 1 bedroom 16,698 2 bedrooms 14,351 3 bedrooms 3,351 4 bedrooms 845 5+ bedrooms
Owner-occupied Renter-occupied
Rooms in owner-occupied houses in Worcester, Massachusetts
183 1 room 390 2 rooms 895 3 rooms 3,900 4 rooms 5,631 5 rooms 7,670 6 rooms 4,879 7 rooms 2,583 8 rooms 4,623 9+ rooms
Rooms in renter-occupied apartments in Worcester, Massachusetts
1,841 1 room 4,213 2 rooms 8,331 3 rooms 10,368 4 rooms 11,024 5 rooms 6,525 6 rooms 4,113 7 rooms 1,576 8 rooms 1,432 9+ rooms
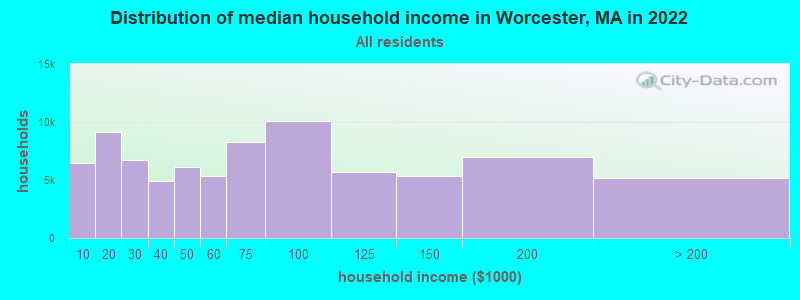
Worcester, MA household income distribution 6,474 Less than $10,0009,096 $10,000 to $19,9996,715 $20,000 to $29,9994,909 $30,000 to $39,9996,123 $40,000 to $49,9995,349 $50,000 to $59,9998,244 $60,000 to $74,99910,118 $75,000 to $99,9995,713 $100,000 to $124,9995,342 $125,000 to $149,9996,959 $150,000 to $199,9995,135 $200,000 or more
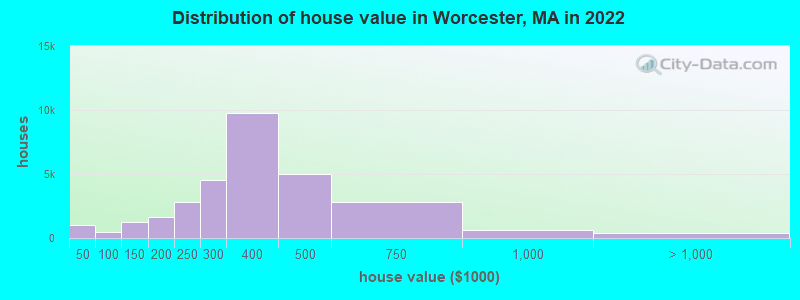
Home value of owner - occupied houses in 2022 in Worcester, MA 339 Less than $10,00064 $10,000 to $14,99988 $15,000 to $19,999125 $20,000 to $24,999265 $25,000 to $29,99964 $30,000 to $34,99918 $35,000 to $39,99959 $40,000 to $49,999115 $50,000 to $59,99979 $60,000 to $69,99923 $70,000 to $79,99981 $80,000 to $89,999129 $90,000 to $99,999717 $100,000 to $124,999516 $125,000 to $149,999854 $150,000 to $174,999780 $175,000 to $199,9992,779 $200,000 to $249,9994,497 $250,000 to $299,9999,799 $300,000 to $399,9994,983 $400,000 to $499,9992,780 $500,000 to $749,999663 $750,000 to $999,999274 $1,000,000 to $1,499,999100 $2,000,000 or moreRent paid by renters in 2022 in Worcester, MA 160 Less than $100195 $100 to $1491,253 $200 to $2492,529 $250 to $2991,408 $300 to $3491,009 $350 to $399762 $400 to $449286 $450 to $499957 $500 to $549333 $550 to $599354 $600 to $649595 $650 to $699167 $700 to $749668 $750 to $7992,777 $800 to $8993,900 $900 to $99911,499 $1,000 to $1,2497,735 $1,250 to $1,4998,033 $1,500 to $1,9992,250 $2,000 to $2,499851 $2,500 to $2,999284 $3,000 to $3,499125 $3,500 or more1,293 No cash rent
Percentage of workers working in this county: 82.9%Number of people working at home: 11,362 (11.0% of all workers )
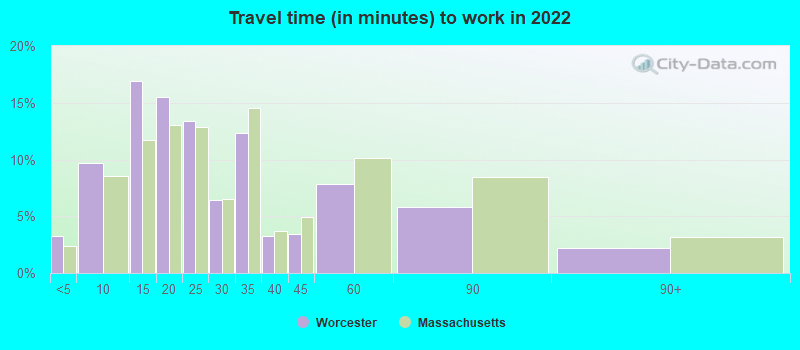
Travel time to work (commute)
Less than 5 minutes: 3,5515 to 9 minutes: 9,15110 to 14 minutes: 15,94415 to 19 minutes: 14,16120 to 24 minutes: 12,98225 to 29 minutes: 6,22130 to 34 minutes: 12,37735 to 39 minutes: 2,08140 to 44 minutes: 3,22445 to 59 minutes: 5,20660 to 89 minutes: 5,60890 or more minutes: 1,447
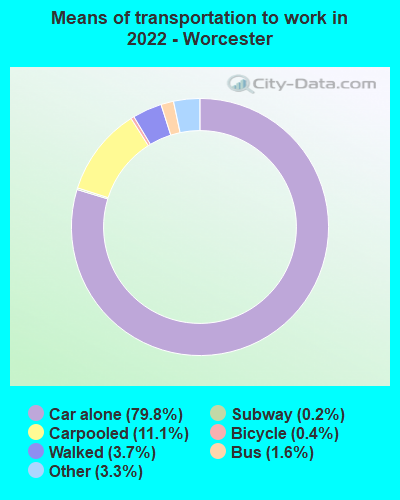
Means of transportation to work:
Drove a car alone: 79,140 (71.6%)Carpooled: 10,980 (9.9%)Bus : 1,595 (1.4%)Long-distance train or commuter rail : 212 (0.2%)Taxi: 3,246 (2.9%)Bicycle: 403 (0.4%)Walked: 3,630 (3.3%)Worked at home: 11,362 (10.3%)
Unemployment by race in 2022
Unemployment rate for White non-Hispanic residents 7.5% Males5.6% FemalesUnemployment rate for Black residents 4.1% Males8.2% FemalesUnemployment rate for American Indian and Alaska Native residents 4.7% FemalesUnemployment rate for Asian residents 3.5% Males3.3% FemalesUnemployment rate for other race residents 3.5% Males11.7% FemalesUnemployment rate for two or more race residents 7.9% Males10.2% FemalesUnemployment rate for Hispanic or Latino residents 7.0% Males8.2% Females
Year of entry for the foreign-born population in Worcester, Massachusetts
25,769 2010 or later 14,062 2000 to 2009 5,745 1990 to 1999 6,149 1980 to 1989 2,194 1970 to 1979 3,168 Before 1970
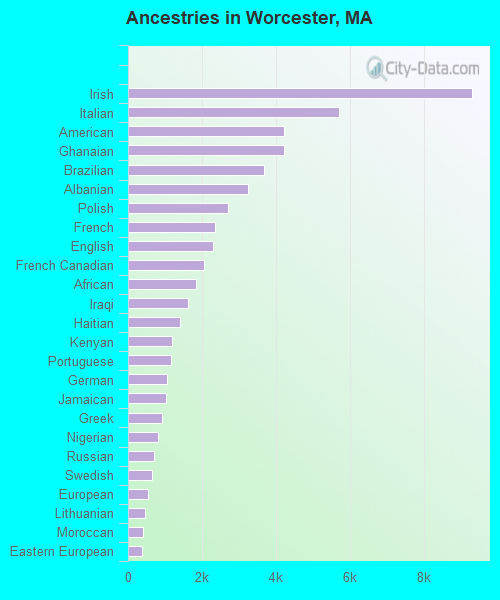
First ancestries reported:
Irish: 9,297 (8.4%)
Italian: 5,708 (5.2%)
American: 4,230 (3.8%)
Ghanaian: 4,220 (3.8%)
Brazilian: 3,674 (3.3%)
Albanian: 3,247 (2.9%)
Polish: 2,712 (2.5%)
French: 2,340 (2.1%)
English: 2,309 (2.1%)
French Canadian: 2,044 (1.8%)
African: 1,850 (1.7%)
Iraqi: 1,630 (1.5%)
Haitian: 1,419 (1.3%)
Kenyan: 1,192 (1.1%)
Portuguese: 1,166 (1.1%)
German: 1,058 (1.0%)
Jamaican: 1,035 (0.9%)
Greek: 907 (0.8%)
Nigerian: 817 (0.7%)
Russian: 705 (0.6%)
Swedish: 640 (0.6%)
European: 537 (0.5%)
Lithuanian: 462 (0.4%)
Moroccan: 395 (0.4%)
Eastern European: 380 (0.3%)
Lebanese: 366 (0.3%)
Canadian: 347 (0.3%)
Syrian: 319 (0.3%)
Scottish: 303 (0.3%)
Armenian: 286 (0.3%)
Arab: 227 (0.2%)
Norwegian: 220 (0.2%)
Trinidadian and Tobagonian: 197 (0.2%)
Finnish: 170 (0.2%)
Jordanian: 169 (0.2%)
Somali: 156 (0.1%)
Scotch-Irish: 147 (0.1%)
Liberian: 129 (0.1%)
British: 126 (0.1%)
Cape Verdean: 116 (0.1%)
Northern European: 115 (0.1%)
Dutch: 113 (0.1%)
West Indian: 108 (0.10%)
Slovene: 106 (0.10%)
Ukrainian: 101 (0.09%)
Serbian: 90 (0.08%)
Iranian: 71 (0.06%)
Guyanese: 70 (0.06%)
Welsh: 70 (0.06%)
Ethiopian: 66 (0.06%)
Afghan: 65 (0.06%)
Danish: 63 (0.06%)
Zimbabwean: 62 (0.06%)
Austrian: 61 (0.06%)
Romanian: 55 (0.05%)
Swiss: 54 (0.05%)
Israeli: 51 (0.05%)
Turkish: 41 (0.04%)
Macedonian: 31 (0.03%)
Czech: 29 (0.03%)
South African: 26 (0.02%)
Ugandan: 23 (0.02%)
Palestinian: 23 (0.02%)
Scandinavian: 23 (0.02%)
Belgian: 22 (0.02%)
Hungarian: 19 (0.02%)
Yugoslavian: 19 (0.02%)
British West Indian: 11 (0.01%)
Assyrian: 10 (0.01%)
Slavic: 10 (0.01%)
Bulgarian: 10 (0.01%)
Egyptian: 9 (0.01%)
Sudanese: 8 (0.01%)
Most common places of birth for foreign-born residents (%): Ghana Worcester:
13.8% (6,747)Massachusetts:
1.0% (12,327)
Dominican Republic Worcester:
9.4% (4,594)Massachusetts:
8.3% (101,767)
Brazil Worcester:
9.2% (4,508)Massachusetts:
7.6% (92,959)
Vietnam Worcester:
8.9% (4,337)Massachusetts:
3.0% (37,197)
Albania Worcester:
6.7% (3,288)Massachusetts:
1.1% (13,076)
El Salvador Worcester:
4.7% (2,284)Massachusetts:
3.7% (45,667)
China, excluding Hong Kong and Taiwan Worcester:
3.8% (1,879)Massachusetts:
8.4% (103,233)
Iraq Worcester:
2.8% (1,393)Massachusetts:
0.4% (4,735)
Haiti Worcester:
2.2% (1,086)Massachusetts:
4.9% (60,432)
Ecuador Worcester:
2.2% (1,082)Massachusetts:
1.0% (11,727)
Kenya Worcester:
2.2% (1,068)Massachusetts:
0.7% (8,746)
Colombia Worcester:
2.2% (1,063)Massachusetts:
2.3% (27,810)
Jamaica Worcester:
2.0% (968)Massachusetts:
1.7% (21,468)
Poland Worcester:
1.7% (841)Massachusetts:
0.9% (10,915)
Liberia Worcester:
1.6% (783)Massachusetts:
0.2% (2,812)
Place of birth for U.S.-born residents:
This state: 104,707Other state: 35,063Northeast: 20,831Midwest: 3,447South: 6,536West: 4,249 82.1% of Worcester residents lived in the same house 1 years ago.
Out of people who lived in different houses, 37.3% lived in this county.
Out of people who lived in different counties, 53.4% lived in Massachusetts.
Worcester:
82.1%State average:
87.7%
Education attainment for males 25 years and older:
No schooling: 2,145Nursery to 4th grade: 4575th and 6th grade: 8257th and 8th grade: 1,1949th grade: 65410th grade: 72711th grade: 1,71312th grade, no diploma: 1,886High school graduate (or equivalency): 16,882Less than 1 year of college: 3,142Some college more than 1 year, no degree: 6,422Associate degree: 4,392Bachelor's degree: 13,332Master's degree: 4,549Professional school degree: 1,505Doctorate degree: 1,800
Education attainment for females 25 years and older:
No schooling: 1,491Nursery to 4th grade: 6225th and 6th grade: 1,0487th and 8th grade: 1,0189th grade: 53710th grade: 69511th grade: 49612th grade, no diploma: 1,384High school graduate (or equivalency): 20,428Less than 1 year of college: 3,924Some college more than 1 year, no degree: 8,797Associate degree: 5,462Bachelor's degree: 13,933Master's degree: 7,863Professional school degree: 1,773Doctorate degree: 1,237
Housing units in structures:
One, detached: 25,236One, attached: 4,629Two: 8,6413 or 4: 22,6815 to 9: 7,05510 to 19: 6,37220 to 49: 3,46350 or more: 6,870Mobile homes: 351Median worth of mobile homes: $127,684
Housing units lacking complete plumbing facilities in 2022: 2.0%Housing units lacking complete kitchen facilities in 2022: 2.3%House/condo owner moved in on average 10 years ago
Renter moved in on average 3 years ago
Private vs. public school enrollment:
Students in private schools in grades 1 to 8 (elementary and middle school): 1,652 Here:
9.5%Massachusetts:
10.3%
Students in private schools in grades 9 to 12 (high school): 1,818 Here:
21.0%Massachusetts:
12.3%
Students in private undergraduate colleges: 15,332 Here:
59.0%Massachusetts:
51.2%