The median household income in Allen, TX in 2022 was $121,127, which was 40.3% greater than the median annual income of $72,284 across the entire state of Texas. Compared to the median income of $78,924 in 2000 this represents an increase of 34.8%. The per capita income in 2022 was $55,022, which means an increase of 48.1% compared to 2000 when it was $28,575.
Whole page based on the data from 2000 / 2022 when the population of Allen, Texas was 43,554 / 111,548
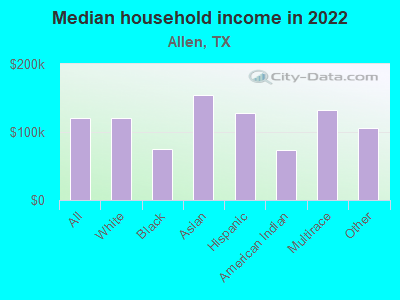
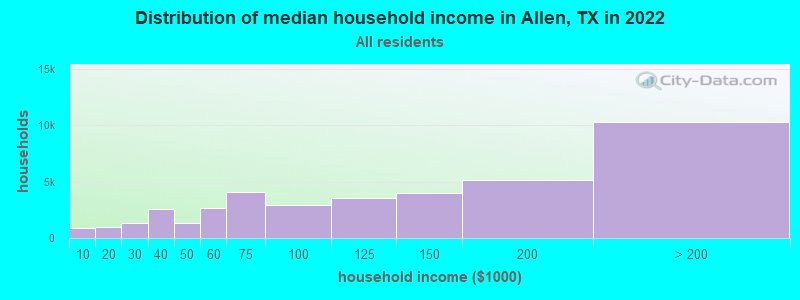
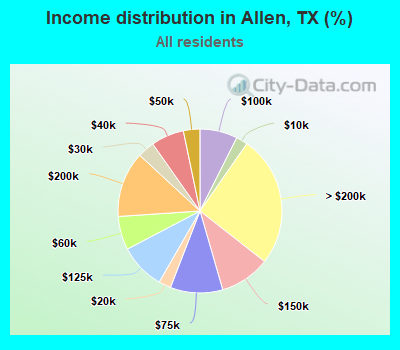
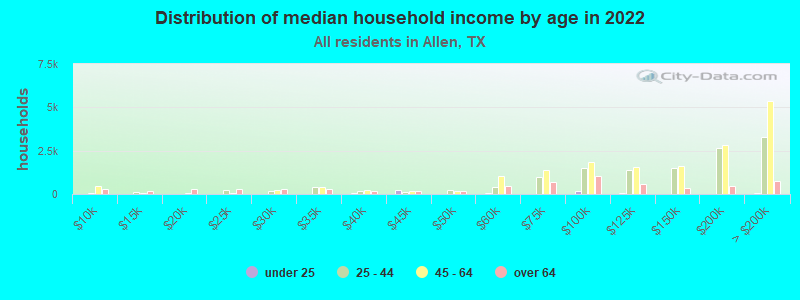
Income statistics for all residents
Median household income in Allen, TX in 2022:
Allen:
$121,127
State:
$72,284
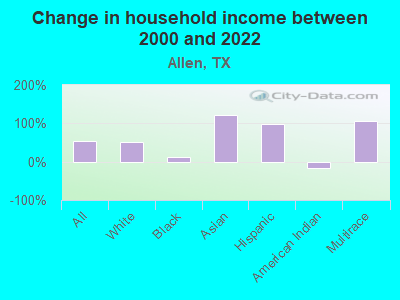
Change in median household income between 2000 and 2022:
Allen, Texas:
+53.5%
State:
+81.0%
Number of households with income < $10k:
Allen:
2.3% (900)
State:
5.5% (611,011)
Number of households with income $10k - 20k:
Allen:
2.4% (955)
State:
6.7% (743,157)
Number of households with income $20k - 30k:
Allen:
3.4% (1,333)
State:
7.2% (803,381)
Number of households with income $30k - 40k:
Allen:
6.5% (2,579)
State:
7.8% (866,080)
Number of households with income $40k - 50k:
Allen:
3.3% (1,294)
Texas:
7.3% (810,440)
Number of households with income $50k - 60k:
Allen:
6.6% (2,634)
Texas:
7.2% (799,783)
Number of households with income $60k - 75k:
Allen:
10.4% (4,112)
State:
9.9% (1,095,384)
Number of households with income $75k - 100k:
Allen:
7.4% (2,946)
State:
12.8% (1,419,057)
Number of households with income $100k - 125k:
Allen:
9.0% (3,582)
State:
9.5% (1,054,577)
Number of households with income $125k - 150k:
Allen:
9.9% (3,946)
State:
6.7% (741,518)
Number of households with income $150k - 200k:
Allen:
12.9% (5,136)
State:
8.7% (961,776)
Number of households with income > $200k:
Allen:
25.9% (10,280)
Texas:
10.7% (1,181,544)
Aggregate household income in Allen in 2022: $5,921,370,700
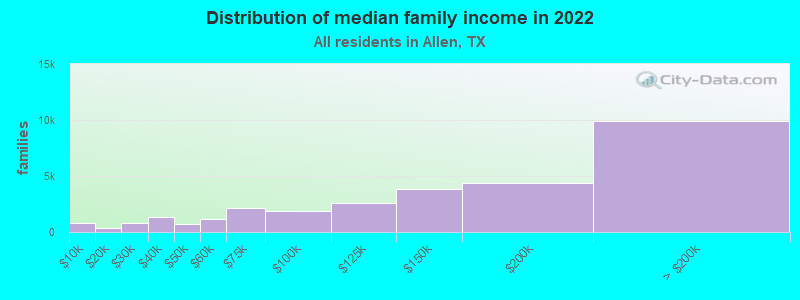
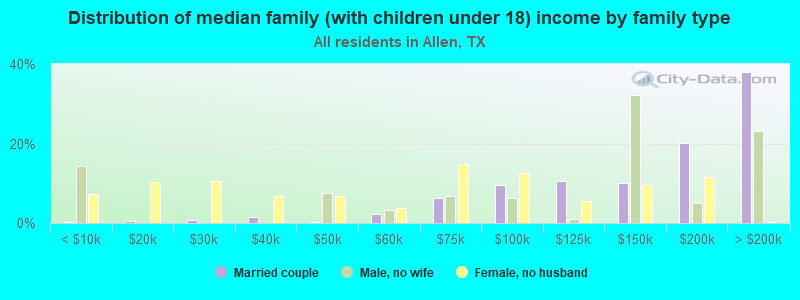
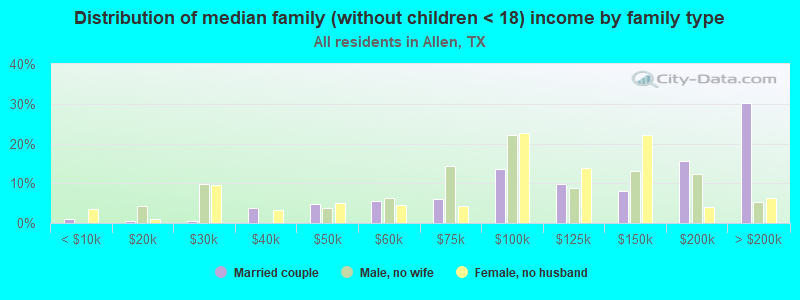
Median family income in Allen in 2022:
Allen:
$141,077
State:
$86,267
Number of families with income < $10k:
Allen:
2.6% (762)
State:
4.0% (297,884)
Number of families with income $10k - 20k:
Allen:
1.2% (352)
State:
4.3% (324,514)
Number of families with income $20k - 30k:
Allen:
2.6% (763)
State:
5.8% (430,949)
Number of families with income $30k - 40k:
Allen:
4.4% (1,296)
Texas:
6.6% (493,535)
Number of families with income $40k - 50k:
Allen:
2.4% (700)
Texas:
6.7% (499,663)
Number of families with income $50k - 60k:
Allen:
4.0% (1,178)
Texas:
6.6% (492,203)
Number of families with income $60k - 75k:
Allen:
7.3% (2,175)
Texas:
9.5% (710,229)
Number of families with income $75k - 100k:
Allen:
6.3% (1,870)
State:
13.6% (1,015,480)
Number of families with income $100k - 125k:
Allen:
8.6% (2,564)
Texas:
10.7% (797,961)
Number of families with income $125k - 150k:
Allen:
12.9% (3,836)
State:
8.1% (602,985)
Number of families with income $150k - 200k:
Allen:
14.6% (4,361)
State:
10.7% (804,459)
Number of families with income > $200k:
Allen:
33.3% (9,924)
Texas:
13.5% (1,013,514)
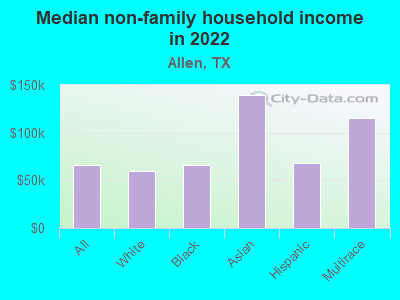
Median non-family income in Allen in 2022:
Allen:
$65,695
State:
$45,999
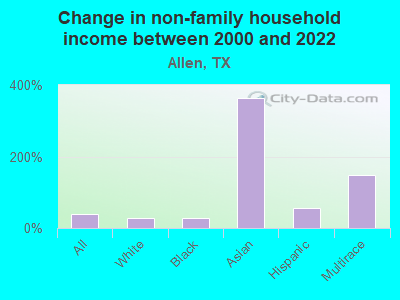
Change in median non-family income between 2000 and 2022:
Allen, Texas:
+38.7%
State:
+79.5%
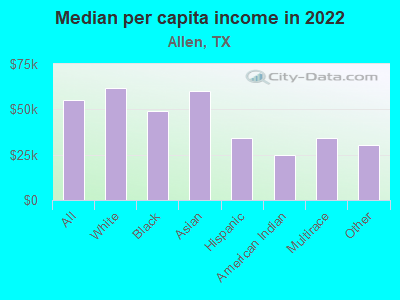
Median per capita income in Allen in 2022:
Allen:
$55,022
Texas:
$38,123
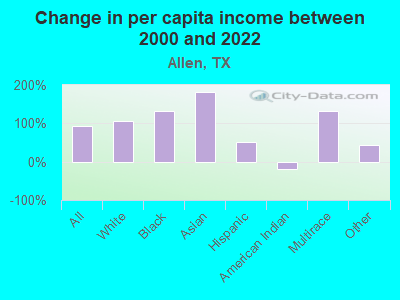
Change in median per capita income between 2000 and 2022:
Allen, Texas:
+92.6%
State:
+94.3%
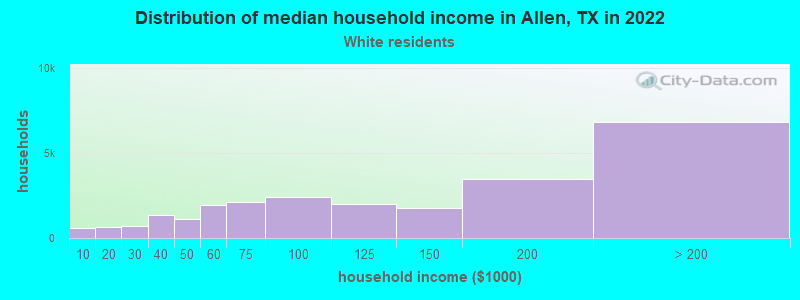
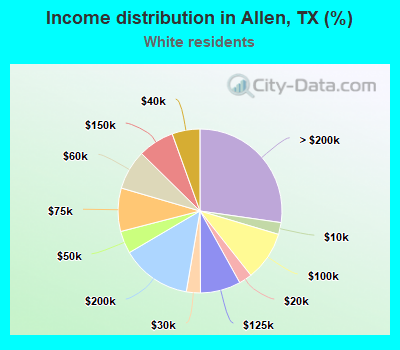
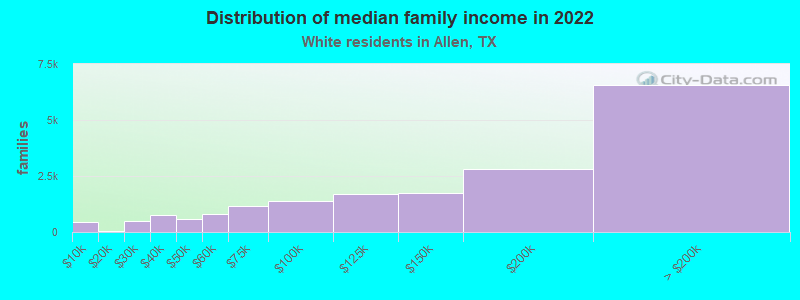
Income statistics for White residents
Median household income in Allen, TX in 2022:
Allen:
$120,605
Texas:
$82,032
Change in median household income between 2000 and 2022:
Allen, Texas:
+50.3%
State:
+91.0%
Number of households with income < $10k:
Allen:
2.3% (584)
Texas:
4.7% (273,716)
Number of households with income $10k - 20k:
Allen:
2.6% (649)
Texas:
5.5% (322,702)
Number of households with income $20k - 30k:
Allen:
2.8% (698)
State:
6.2% (363,947)
Number of households with income $30k - 40k:
Allen:
5.5% (1,374)
Texas:
6.8% (399,275)
Number of households with income $40k - 50k:
Allen:
4.4% (1,111)
State:
6.5% (383,417)
Number of households with income $50k - 60k:
Allen:
7.8% (1,956)
State:
6.6% (388,535)
Number of households with income $60k - 75k:
Allen:
8.5% (2,135)
State:
9.7% (566,295)
Number of households with income $75k - 100k:
Allen:
9.7% (2,430)
State:
13.0% (760,276)
Number of households with income $100k - 125k:
Allen:
7.9% (1,985)
State:
10.2% (597,596)
Number of households with income $125k - 150k:
Allen:
7.1% (1,781)
State:
7.4% (436,830)
Number of households with income $150k - 200k:
Allen:
13.8% (3,455)
Texas:
9.9% (583,067)
Number of households with income > $200k:
Allen:
27.3% (6,813)
Texas:
13.5% (792,647)
Aggregate household income in Allen in 2022: $3,811,103,200
Median family income in Allen in 2022:
Allen:
$152,665
State:
$101,788
Number of families with income < $10k:
Allen:
2.4% (446)
State:
2.8% (108,142)
Number of families with income $10k - 20k:
Allen:
0.2% (46)
Texas:
2.9% (113,421)
Number of families with income $20k - 30k:
Allen:
2.7% (505)
State:
4.1% (157,688)
Number of families with income $30k - 40k:
Allen:
4.2% (781)
State:
5.2% (198,847)
Number of families with income $40k - 50k:
Allen:
3.0% (564)
State:
5.6% (216,490)
Number of families with income $50k - 60k:
Allen:
4.4% (810)
State:
5.7% (220,689)
Number of families with income $60k - 75k:
Allen:
6.4% (1,178)
State:
9.0% (346,106)
Number of families with income $75k - 100k:
Allen:
7.4% (1,370)
Texas:
13.7% (527,363)
Number of families with income $100k - 125k:
Allen:
9.2% (1,699)
Texas:
11.6% (448,411)
Number of families with income $125k - 150k:
Allen:
9.5% (1,761)
State:
9.2% (355,798)
Number of families with income $150k - 200k:
Allen:
15.2% (2,822)
State:
12.5% (480,185)
Number of families with income > $200k:
Allen:
35.4% (6,566)
State:
17.6% (677,490)
Median non-family income in Allen in 2022:
Allen:
$59,967
State:
$50,587
Change in median non-family income between 2000 and 2022:
Allen, Texas:
+26.9%
State:
+87.7%
Median per capita income in Allen in 2022:
Allen:
$61,525
State:
$47,740
Change in median per capita income between 2000 and 2022:
Allen, Texas:
+107.2%
Texas:
+114.3%
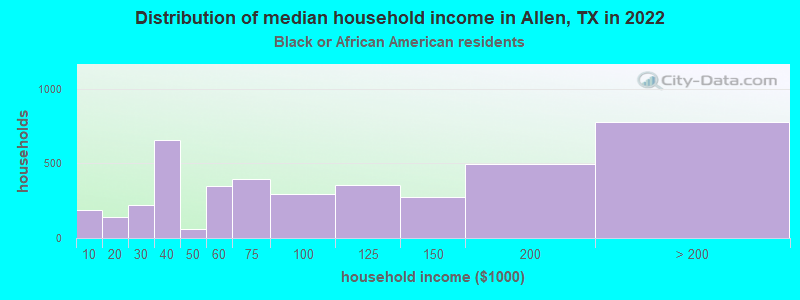
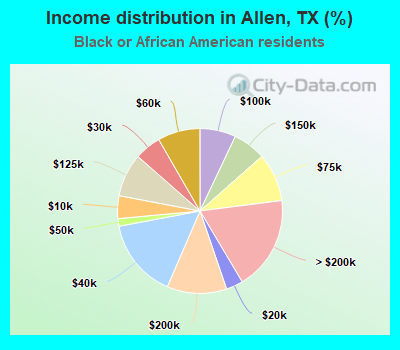
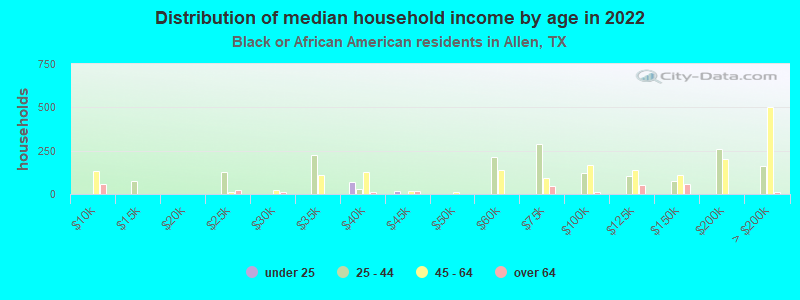
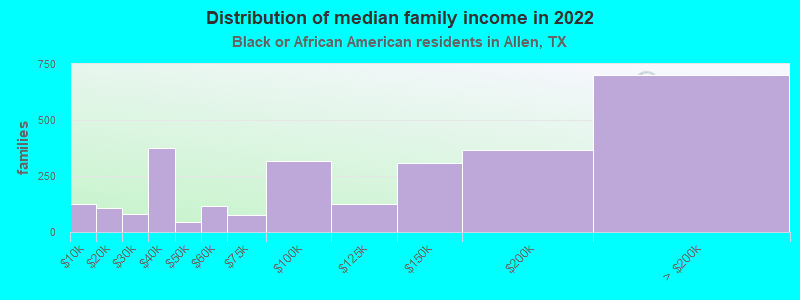
Income statistics for Black or African American residents
Median household income in Allen, TX in 2022:
Allen:
$74,523
State:
$55,759
Change in median household income between 2000 and 2022:
Allen, Texas:
+10.7%
Texas:
+90.3%
Number of households with income < $10k:
Allen:
4.5% (188)
State:
8.9% (126,378)
Number of households with income $10k - 20k:
Allen:
3.3% (140)
State:
9.9% (140,369)
Number of households with income $20k - 30k:
Allen:
5.2% (218)
Texas:
8.5% (120,639)
Number of households with income $30k - 40k:
Allen:
15.5% (653)
Texas:
9.7% (137,517)
Number of households with income $40k - 50k:
Allen:
1.5% (62)
Texas:
8.0% (112,973)
Number of households with income $50k - 60k:
Allen:
8.3% (350)
State:
8.3% (117,156)
Number of households with income $60k - 75k:
Allen:
9.5% (398)
Texas:
10.4% (147,462)
Number of households with income $75k - 100k:
Allen:
7.0% (296)
State:
11.5% (162,718)
Number of households with income $100k - 125k:
Allen:
8.5% (356)
Texas:
8.2% (115,829)
Number of households with income $125k - 150k:
Allen:
6.5% (271)
State:
4.9% (69,556)
Number of households with income $150k - 200k:
Allen:
11.7% (492)
Texas:
6.4% (90,701)
Number of households with income > $200k:
Allen:
18.5% (776)
State:
5.5% (77,988)
Aggregate household income in Allen in 2022: $542,266,400
Median family income in Allen in 2022:
Allen:
$127,830
State:
$69,134
Number of families with income < $10k:
Allen:
4.5% (124)
State:
6.8% (55,625)
Number of families with income $10k - 20k:
Allen:
3.9% (107)
State:
6.8% (55,300)
Number of families with income $20k - 30k:
Allen:
2.9% (80)
State:
7.1% (57,877)
Number of families with income $30k - 40k:
Allen:
13.6% (374)
Texas:
8.5% (68,776)
Number of families with income $40k - 50k:
Allen:
1.7% (46)
Texas:
7.1% (57,907)
Number of families with income $50k - 60k:
Allen:
4.2% (115)
State:
7.3% (59,511)
Number of families with income $60k - 75k:
Allen:
2.8% (75)
State:
10.1% (81,994)
Number of families with income $75k - 100k:
Allen:
11.6% (317)
State:
12.7% (103,723)
Number of families with income $100k - 125k:
Allen:
4.6% (125)
State:
9.4% (76,609)
Number of families with income $125k - 150k:
Allen:
11.2% (307)
State:
6.8% (55,615)
Number of families with income $150k - 200k:
Allen:
13.4% (368)
Texas:
9.4% (76,146)
Number of families with income > $200k:
Allen:
25.7% (703)
Texas:
7.9% (64,439)
Median non-family income in Allen in 2022:
Allen:
$66,504
State:
$40,133
Change in median non-family income between 2000 and 2022:
Allen, Texas:
+29.3%
Texas:
+102.2%
Median per capita income in Allen in 2022:
Allen:
$49,287
State:
$30,490
Change in median per capita income between 2000 and 2022:
Allen, Texas:
+131.4%
State:
+113.9%
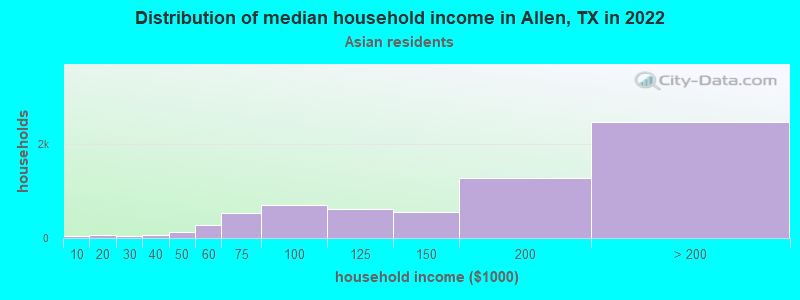
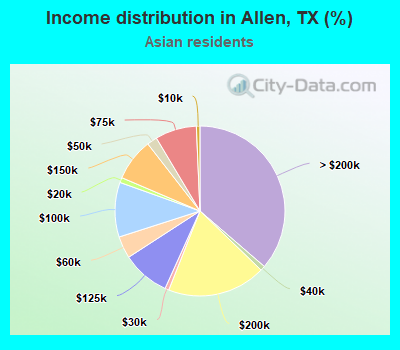
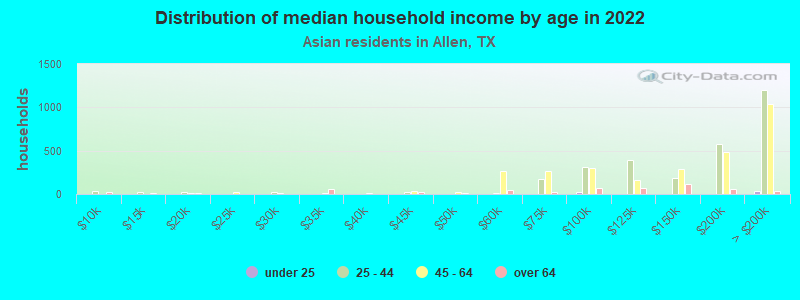
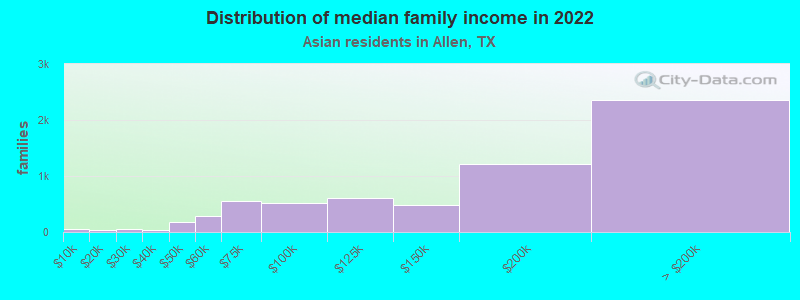
Income statistics for Asian residents
Median household income in Allen, TX in 2022:
Allen:
$154,299
Texas:
$107,673
Change in median household income between 2000 and 2022:
Allen, Texas:
+123.0%
Texas:
+115.1%
Number of households with income < $10k:
Allen:
0.7% (46)
Texas:
5.2% (29,885)
Number of households with income $10k - 20k:
Allen:
1.0% (65)
Texas:
4.7% (27,044)
Number of households with income $20k - 30k:
Allen:
0.7% (50)
State:
4.1% (23,363)
Number of households with income $30k - 40k:
Allen:
0.9% (61)
State:
4.1% (23,309)
Number of households with income $40k - 50k:
Allen:
1.9% (132)
Texas:
5.2% (29,826)
Number of households with income $50k - 60k:
Allen:
4.2% (285)
State:
4.7% (26,512)
Number of households with income $60k - 75k:
Allen:
7.9% (535)
State:
6.5% (36,905)
Number of households with income $75k - 100k:
Allen:
10.4% (705)
State:
11.3% (64,350)
Number of households with income $100k - 125k:
Allen:
9.1% (618)
State:
11.4% (64,714)
Number of households with income $125k - 150k:
Allen:
8.1% (547)
Texas:
9.3% (52,719)
Number of households with income $150k - 200k:
Allen:
18.8% (1,273)
Texas:
12.5% (70,953)
Number of households with income > $200k:
Allen:
36.3% (2,464)
State:
21.1% (120,260)
Aggregate household income in Allen in 2022: $1,029,431,800
Median family income in Allen in 2022:
Allen:
$160,285
Texas:
$123,328
Number of families with income < $10k:
Allen:
0.7% (46)
Texas:
3.1% (13,567)
Number of families with income $10k - 20k:
Allen:
0.7% (43)
Texas:
3.0% (13,043)
Number of families with income $20k - 30k:
Allen:
0.8% (49)
State:
3.4% (14,738)
Number of families with income $30k - 40k:
Allen:
0.6% (41)
Texas:
3.4% (15,033)
Number of families with income $40k - 50k:
Allen:
2.7% (170)
State:
4.9% (21,622)
Number of families with income $50k - 60k:
Allen:
4.4% (278)
Texas:
4.7% (20,568)
Number of families with income $60k - 75k:
Allen:
8.7% (553)
State:
6.1% (26,637)
Number of families with income $75k - 100k:
Allen:
8.2% (522)
State:
10.7% (46,626)
Number of families with income $100k - 125k:
Allen:
9.5% (609)
Texas:
11.3% (49,585)
Number of families with income $125k - 150k:
Allen:
7.6% (485)
State:
9.8% (43,043)
Number of families with income $150k - 200k:
Allen:
19.2% (1,222)
State:
14.7% (64,203)
Number of families with income > $200k:
Allen:
37.0% (2,363)
State:
24.8% (108,511)
Median non-family income in Allen in 2022:
Allen:
$139,654
State:
$64,320
Median per capita income in Allen in 2022:
Allen:
$60,167
State:
$48,626
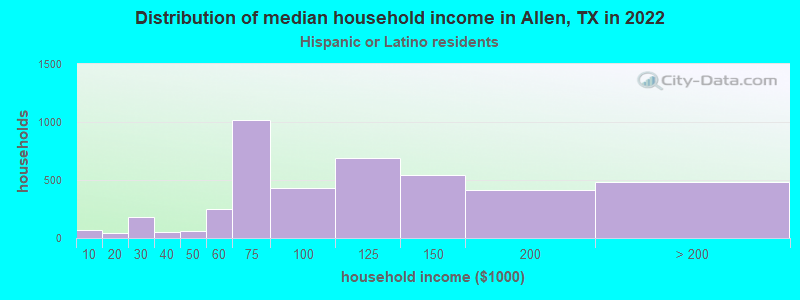
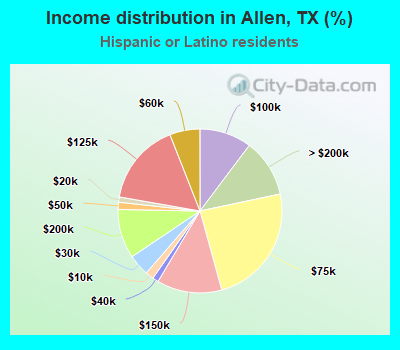
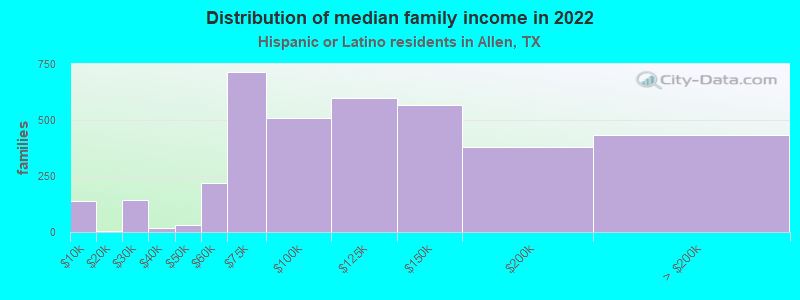
Income statistics for Hispanic or Latino residents
Median household income in Allen, TX in 2022:
Allen:
$127,515
Texas:
$60,504
Change in median household income between 2000 and 2022:
Allen, Texas:
+97.5%
State:
+102.5%
Number of households with income < $10k:
Allen:
1.6% (69)
State:
5.8% (213,953)
Number of households with income $10k - 20k:
Allen:
1.0% (44)
State:
8.0% (297,456)
Number of households with income $20k - 30k:
Allen:
4.2% (178)
Texas:
9.2% (340,166)
Number of households with income $30k - 40k:
Allen:
1.2% (50)
State:
9.5% (354,336)
Number of households with income $40k - 50k:
Allen:
1.4% (60)
State:
8.8% (327,013)
Number of households with income $50k - 60k:
Allen:
6.0% (252)
Texas:
8.3% (308,818)
Number of households with income $60k - 75k:
Allen:
24.0% (1,016)
State:
10.9% (405,109)
Number of households with income $75k - 100k:
Allen:
10.3% (434)
State:
13.8% (511,639)
Number of households with income $100k - 125k:
Allen:
16.3% (688)
Texas:
8.6% (319,728)
Number of households with income $125k - 150k:
Allen:
12.8% (543)
Texas:
5.7% (210,932)
Number of households with income $150k - 200k:
Allen:
9.7% (411)
State:
6.4% (236,055)
Number of households with income > $200k:
Allen:
11.4% (483)
State:
5.1% (189,259)
Aggregate household income in Allen in 2022: $465,134,100
Median family income in Allen in 2022:
Allen:
$127,865
State:
$65,080
Number of families with income < $10k:
Allen:
3.6% (137)
State:
5.3% (147,493)
Number of families with income $10k - 20k:
Allen:
0.2% (6)
State:
6.3% (174,531)
Number of families with income $20k - 30k:
Allen:
3.8% (142)
Texas:
8.6% (238,528)
Number of families with income $30k - 40k:
Allen:
0.5% (19)
State:
9.1% (251,999)
Number of families with income $40k - 50k:
Allen:
0.8% (30)
State:
8.6% (240,188)
Number of families with income $50k - 60k:
Allen:
5.8% (218)
State:
8.0% (223,566)
Number of families with income $60k - 75k:
Allen:
19.0% (714)
State:
10.9% (302,688)
Number of families with income $75k - 100k:
Allen:
13.5% (507)
Texas:
14.3% (398,554)
Number of families with income $100k - 125k:
Allen:
15.9% (598)
State:
9.5% (264,007)
Number of families with income $125k - 150k:
Allen:
15.1% (567)
Texas:
6.2% (171,274)
Number of families with income $150k - 200k:
Allen:
10.1% (381)
State:
7.3% (202,259)
Number of families with income > $200k:
Allen:
11.6% (435)
Texas:
5.9% (165,129)
Median non-family income in Allen in 2022:
Allen:
$68,539
State:
$39,934
Change in median non-family income between 2000 and 2022:
Allen, Texas:
+56.0%
State:
+109.1%
Median per capita income in Allen in 2022:
Allen:
$34,111
State:
$24,862
Change in median per capita income between 2000 and 2022:
Allen, Texas:
+51.7%
Texas:
+130.8%
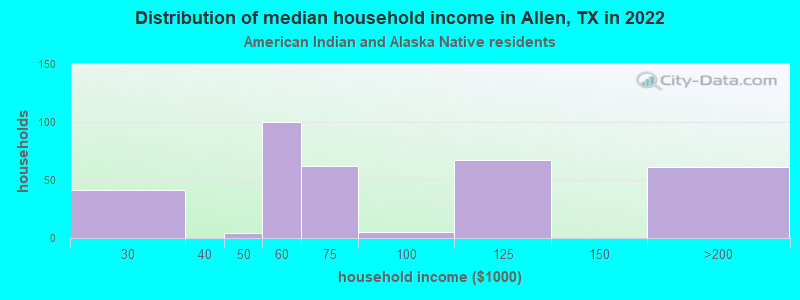
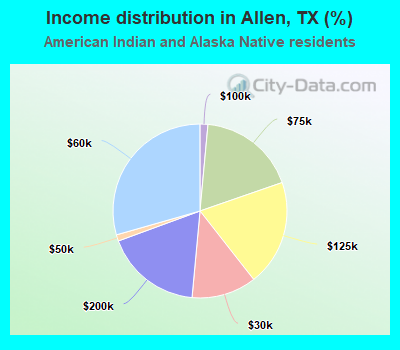
Income statistics for American Indian and Alaska Native residents
Median household income in Allen, TX in 2022:
Allen:
$73,403
State:
$65,765
Change in median household income between 2000 and 2022:: -16.9%
Allen, Texas:
-16.9%
State:
+88.3%
Number of households with income < $10k:
Allen:
0.0% (0)
Texas:
4.1% (3,398)
Number of households with income $10k - 20k:
Allen:
0.0% (0)
State:
8.3% (6,949)
Number of households with income $20k - 30k:
Allen:
12.1% (41)
Texas:
9.3% (7,742)
Number of households with income $30k - 40k:
Allen:
0.0% (0)
State:
9.1% (7,627)
Number of households with income $40k - 50k:
Allen:
1.2% (4)
State:
7.1% (5,922)
Number of households with income $50k - 60k:
Allen:
29.4% (100)
State:
8.1% (6,761)
Number of households with income $60k - 75k:
Allen:
18.2% (62)
State:
12.7% (10,588)
Number of households with income $75k - 100k:
Allen:
1.5% (5)
State:
13.0% (10,903)
Number of households with income $100k - 125k:
Allen:
19.7% (67)
State:
9.9% (8,256)
Number of households with income $125k - 150k:
Allen:
0.0% (0)
Texas:
5.2% (4,355)
Number of households with income $150k - 200k:
Allen:
17.9% (61)
Texas:
6.7% (5,623)
Number of households with income > $200k:
Allen:
0.0% (0)
Texas:
6.6% (5,522)
Aggregate household income in Allen in 2022: $28,788,400
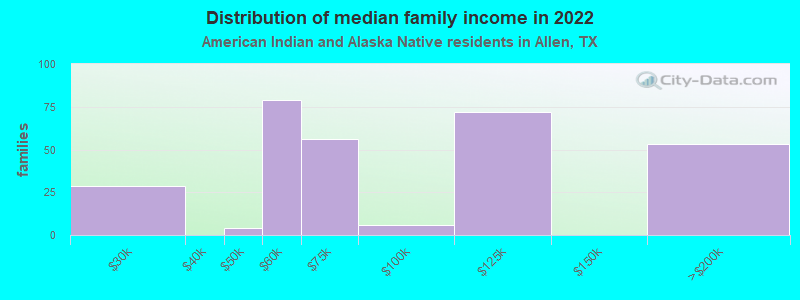
Median family income in Allen in 2022:
Allen:
$73,403
Texas:
$72,369
Number of families with income $20k - 30k:
Allen:
9.6% (29)
Texas:
7.3% (4,502)
Number of families with income $40k - 50k:
Allen:
1.3% (4)
State:
7.9% (4,855)
Number of families with income $50k - 60k:
Allen:
26.4% (79)
State:
7.1% (4,347)
Number of families with income $60k - 75k:
Allen:
18.8% (56)
Texas:
12.1% (7,429)
Number of families with income $75k - 100k:
Allen:
2.0% (6)
State:
14.4% (8,852)
Number of families with income $100k - 125k:
Allen:
24.0% (72)
State:
11.4% (6,997)
Number of families with income $150k - 200k:
Allen:
17.9% (53)
Texas:
6.9% (4,246)
Median per capita income in Allen in 2022:
Allen:
$24,599
State:
$28,166
Change in median per capita income between 2000 and 2022:: -18.0%
Allen, Texas:
-18.0%
Texas:
+77.2%
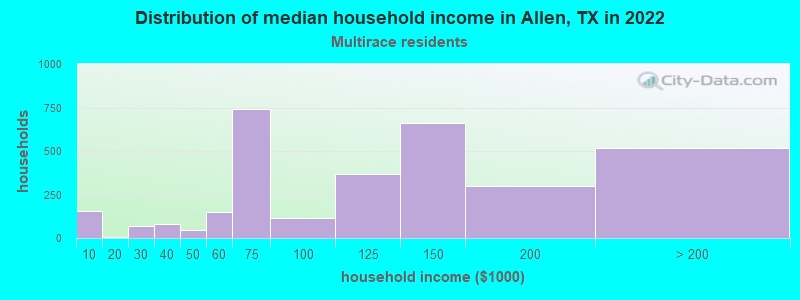
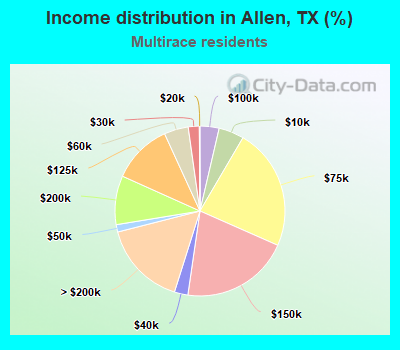
Income statistics for Multirace residents
Median household income in Allen, TX in 2022:
Allen:
$131,672
State:
$62,748
Change in median household income between 2000 and 2022:
Allen, Texas:
+107.1%
State:
+92.3%
Number of households with income < $10k:
Allen:
4.8% (154)
State:
5.5% (122,324)
Number of households with income $10k - 20k:
Allen:
0.1% (4)
State:
8.2% (182,232)
Number of households with income $20k - 30k:
Allen:
2.1% (67)
State:
8.5% (189,456)
Number of households with income $30k - 40k:
Allen:
2.6% (83)
Texas:
8.9% (197,499)
Number of households with income $40k - 50k:
Allen:
1.4% (45)
State:
8.7% (191,735)
Number of households with income $50k - 60k:
Allen:
4.6% (148)
State:
8.0% (177,535)
Number of households with income $60k - 75k:
Allen:
23.2% (743)
Texas:
10.5% (232,479)
Number of households with income $75k - 100k:
Allen:
3.6% (117)
Texas:
13.1% (290,448)
Number of households with income $100k - 125k:
Allen:
11.4% (367)
State:
8.6% (191,595)
Number of households with income $125k - 150k:
Allen:
20.7% (663)
State:
6.0% (133,361)
Number of households with income $150k - 200k:
Allen:
9.3% (298)
State:
7.2% (159,195)
Number of households with income > $200k:
Allen:
16.2% (518)
State:
6.7% (148,064)
Aggregate household income in Allen in 2022: $420,267,800
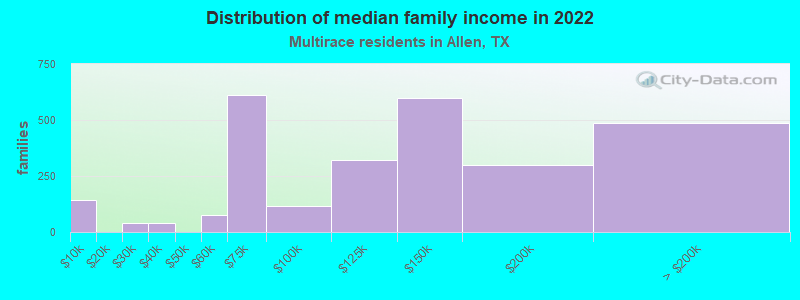
Median family income in Allen in 2022:
Allen:
$132,611
State:
$69,780
Number of families with income < $10k:
Allen:
5.2% (142)
State:
4.4% (70,825)
Number of families with income $20k - 30k:
Allen:
1.5% (40)
Texas:
7.8% (126,627)
Number of families with income $30k - 40k:
Allen:
1.5% (42)
State:
8.5% (137,626)
Number of families with income $50k - 60k:
Allen:
2.7% (74)
State:
7.9% (127,739)
Number of families with income $60k - 75k:
Allen:
22.4% (613)
State:
10.5% (169,549)
Number of families with income $75k - 100k:
Allen:
4.3% (118)
State:
14.0% (226,284)
Number of families with income $100k - 125k:
Allen:
11.8% (323)
State:
9.5% (153,597)
Number of families with income $125k - 150k:
Allen:
21.9% (598)
Texas:
6.7% (107,900)
Number of families with income $150k - 200k:
Allen:
10.8% (297)
State:
8.5% (137,607)
Number of families with income > $200k:
Allen:
17.8% (487)
State:
7.9% (127,299)
Median non-family income in Allen in 2022:
Allen:
$115,746
Texas:
$40,634
Change in median non-family income between 2000 and 2022:
Allen, Texas:
+149.0%
State:
+77.2%
Median per capita income in Allen in 2022:
Allen:
$34,082
State:
$26,785
Change in median per capita income between 2000 and 2022:
Allen, Texas:
+130.7%
State:
+110.9%
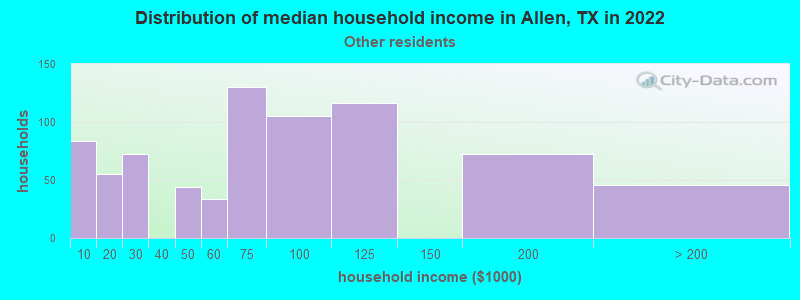
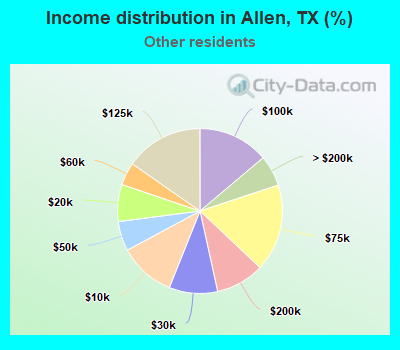
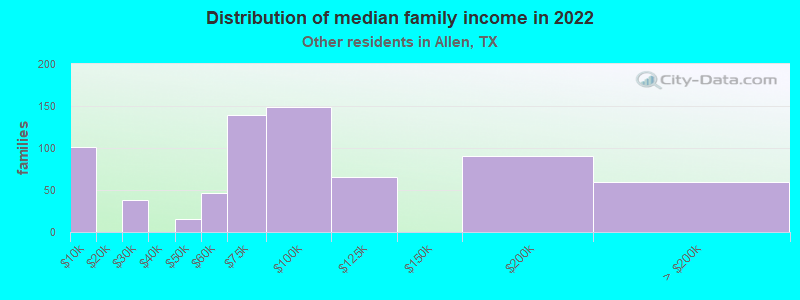
Income statistics for other residents
Median household income in Allen, TX in 2022:
Allen:
$105,818
Texas:
$57,114
Number of households with income < $10k:
Allen:
11.1% (84)
State:
5.9% (54,162)
Number of households with income $10k - 20k:
Allen:
7.3% (55)
Texas:
6.8% (62,891)
Number of households with income $20k - 30k:
Allen:
9.5% (72)
Texas:
10.6% (97,294)
Number of households with income $30k - 40k:
Allen:
0.0% (0)
State:
10.8% (99,670)
Number of households with income $40k - 50k:
Allen:
5.8% (44)
Texas:
9.3% (85,548)
Number of households with income $50k - 60k:
Allen:
4.5% (34)
State:
9.0% (82,757)
Number of households with income $60k - 75k:
Allen:
17.2% (130)
State:
10.9% (100,326)
Number of households with income $75k - 100k:
Allen:
13.9% (105)
State:
14.0% (128,767)
Number of households with income $100k - 125k:
Allen:
15.3% (116)
Texas:
8.2% (75,218)
Number of households with income $125k - 150k:
Allen:
0.0% (0)
Texas:
4.8% (44,223)
Number of households with income $150k - 200k:
Allen:
9.5% (72)
Texas:
5.6% (51,376)
Number of households with income > $200k:
Allen:
6.1% (46)
Texas:
4.0% (36,393)
Aggregate household income in Allen in 2022: $89,513,000
Median family income in Allen in 2022:
Allen:
$89,963
State:
$60,064
Number of families with income < $10k:
Allen:
14.4% (101)
State:
6.8% (47,502)
Number of families with income $20k - 30k:
Allen:
5.4% (38)
State:
9.9% (68,761)
Number of families with income $40k - 50k:
Allen:
2.2% (16)
State:
9.0% (62,441)
Number of families with income $50k - 60k:
Allen:
6.6% (47)
State:
8.5% (59,321)
Number of families with income $60k - 75k:
Allen:
19.7% (139)
State:
11.2% (77,588)
Number of families with income $75k - 100k:
Allen:
21.2% (149)
State:
14.5% (101,032)
Number of families with income $100k - 125k:
Allen:
9.3% (65)
Texas:
8.8% (61,439)
Number of families with income $150k - 200k:
Allen:
12.8% (90)
Texas:
5.9% (41,211)
Number of families with income > $200k:
Allen:
8.4% (59)
State:
4.5% (31,243)
Median per capita income in Allen in 2022:
Allen:
$30,511
State:
$23,899
Change in median per capita income between 2000 and 2022:
Allen, Texas:
+44.0%
State:
+135.2%
Discuss Allen, Texas (TX) on our hugely popular Texas forum.