The median household income in Alvin, TX in 2022 was $63,894, which was 13.1% less than the median annual income of $72,284 across the entire state of Texas. Compared to the median income of $38,576 in 2000 this represents an increase of 39.6%. The per capita income in 2022 was $28,309, which means an increase of 39.9% compared to 2000 when it was $17,016.
Whole page based on the data from 2000 / 2022 when the population of Alvin, Texas was 21,413 / 28,316
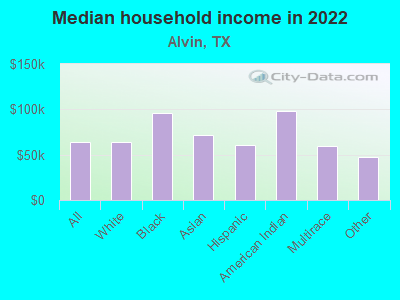
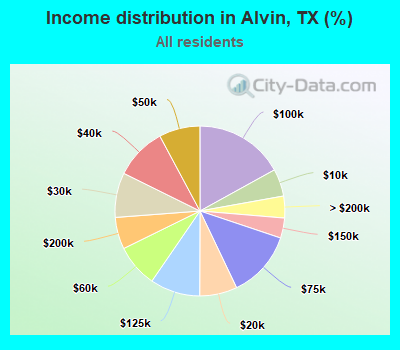
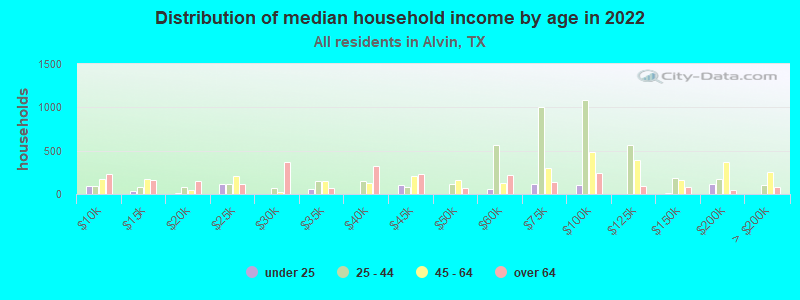
Income statistics for all residents
Median household income in Alvin, TX in 2022:
Alvin:
$63,895
State:
$72,284
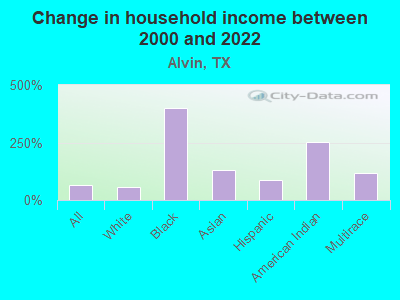
Change in median household income between 2000 and 2022:
Alvin, Texas:
+65.6%
State:
+81.0%
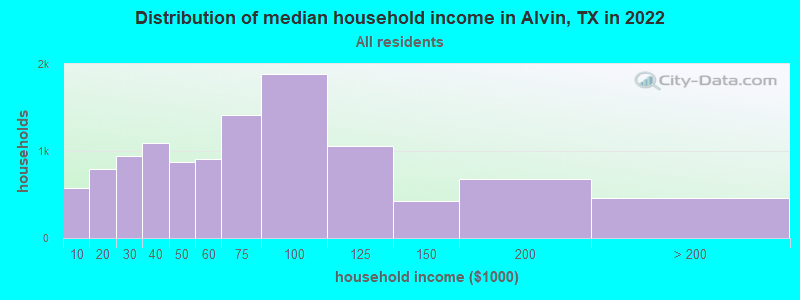
Number of households with income < $10k:
Alvin:
5.2% (578)
State:
5.5% (611,011)
Number of households with income $10k - 20k:
Alvin:
7.2% (794)
State:
6.7% (743,157)
Number of households with income $20k - 30k:
Alvin:
8.5% (945)
State:
7.2% (803,381)
Number of households with income $30k - 40k:
Alvin:
9.9% (1,095)
State:
7.8% (866,080)
Number of households with income $40k - 50k:
Alvin:
7.8% (869)
Texas:
7.3% (810,440)
Number of households with income $50k - 60k:
Alvin:
8.1% (904)
Texas:
7.2% (799,783)
Number of households with income $60k - 75k:
Alvin:
12.8% (1,417)
State:
9.9% (1,095,384)
Number of households with income $75k - 100k:
Alvin:
17.0% (1,884)
State:
12.8% (1,419,057)
Number of households with income $100k - 125k:
Alvin:
9.5% (1,057)
State:
9.5% (1,054,577)
Number of households with income $125k - 150k:
Alvin:
3.8% (424)
State:
6.7% (741,518)
Number of households with income $150k - 200k:
Alvin:
6.1% (673)
State:
8.7% (961,776)
Number of households with income > $200k:
Alvin:
4.2% (461)
Texas:
10.7% (1,181,544)
Aggregate household income in Alvin in 2022: $796,569,742
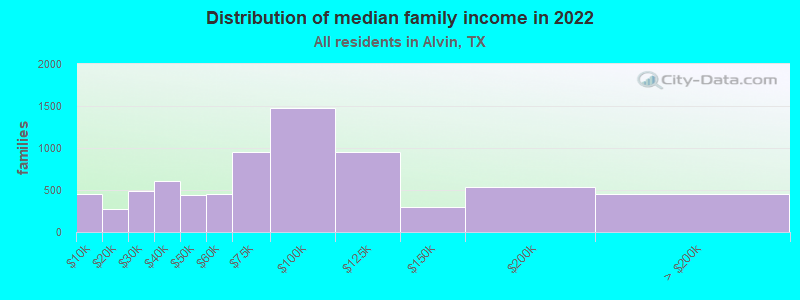
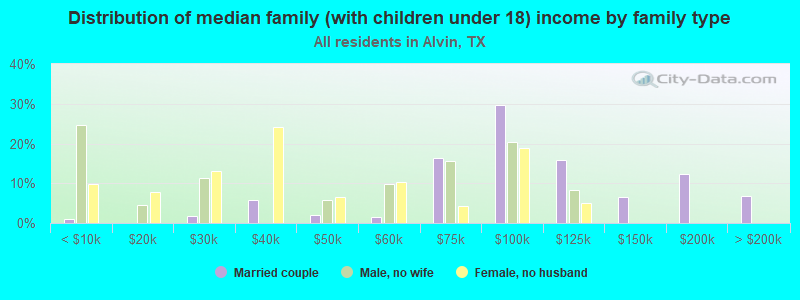
Median family income in Alvin in 2022:
Alvin:
$77,169
State:
$86,267
Number of families with income < $10k:
Alvin:
6.2% (458)
State:
4.0% (297,884)
Number of families with income $10k - 20k:
Alvin:
3.7% (273)
State:
4.3% (324,514)
Number of families with income $20k - 30k:
Alvin:
6.7% (494)
State:
5.8% (430,949)
Number of families with income $30k - 40k:
Alvin:
8.2% (609)
Texas:
6.6% (493,535)
Number of families with income $40k - 50k:
Alvin:
5.9% (437)
Texas:
6.7% (499,663)
Number of families with income $50k - 60k:
Alvin:
6.2% (456)
Texas:
6.6% (492,203)
Number of families with income $60k - 75k:
Alvin:
12.8% (947)
Texas:
9.5% (710,229)
Number of families with income $75k - 100k:
Alvin:
20.0% (1,472)
State:
13.6% (1,015,480)
Number of families with income $100k - 125k:
Alvin:
12.8% (947)
Texas:
10.7% (797,961)
Number of families with income $125k - 150k:
Alvin:
4.0% (293)
State:
8.1% (602,985)
Number of families with income $150k - 200k:
Alvin:
7.3% (540)
State:
10.7% (804,459)
Number of families with income > $200k:
Alvin:
6.1% (453)
Texas:
13.5% (1,013,514)
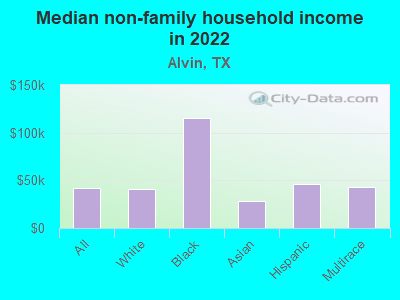
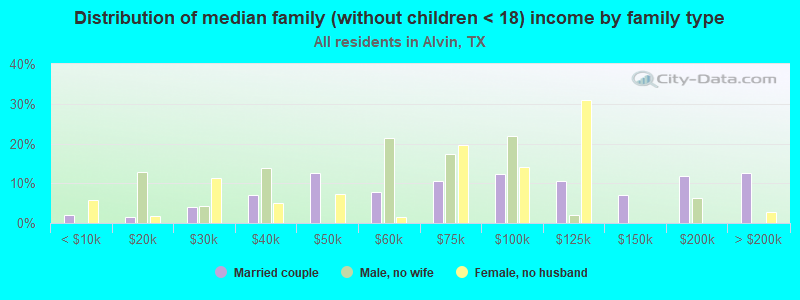
Median non-family income in Alvin in 2022:
Alvin:
$41,641
State:
$45,999
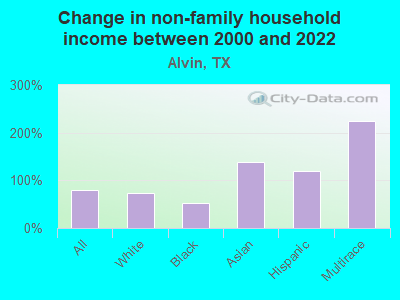
Change in median non-family income between 2000 and 2022:
Alvin, Texas:
+78.9%
State:
+79.5%
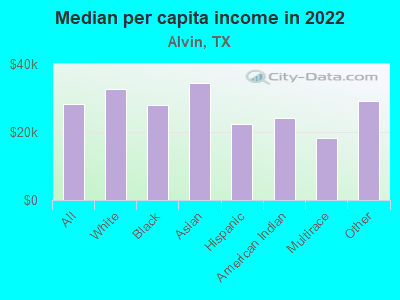
Median per capita income in Alvin in 2022:
Alvin:
$28,309
Texas:
$38,123
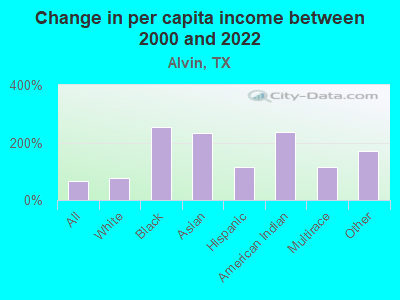
Change in median per capita income between 2000 and 2022:
Alvin, Texas:
+66.4%
State:
+94.3%
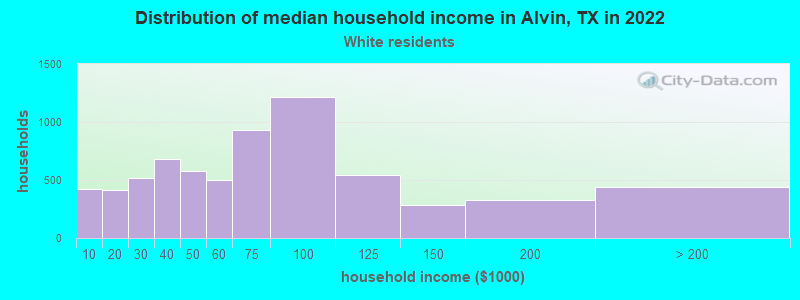
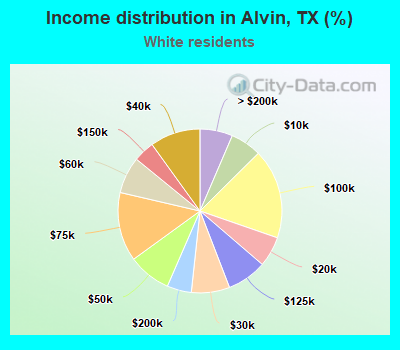
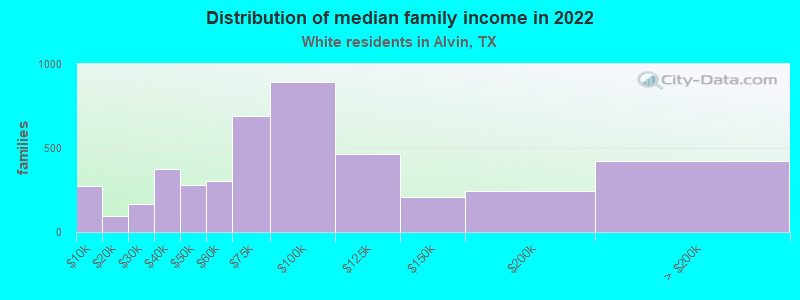
Income statistics for White residents
Median household income in Alvin, TX in 2022:
Alvin:
$63,442
Texas:
$82,032
Change in median household income between 2000 and 2022:
Alvin, Texas:
+57.1%
State:
+91.0%
Number of households with income < $10k:
Alvin:
6.1% (421)
Texas:
4.7% (273,716)
Number of households with income $10k - 20k:
Alvin:
6.0% (410)
Texas:
5.5% (322,702)
Number of households with income $20k - 30k:
Alvin:
7.6% (518)
State:
6.2% (363,947)
Number of households with income $30k - 40k:
Alvin:
9.9% (682)
Texas:
6.8% (399,275)
Number of households with income $40k - 50k:
Alvin:
8.5% (581)
State:
6.5% (383,417)
Number of households with income $50k - 60k:
Alvin:
7.3% (498)
State:
6.6% (388,535)
Number of households with income $60k - 75k:
Alvin:
13.6% (935)
State:
9.7% (566,295)
Number of households with income $75k - 100k:
Alvin:
17.7% (1,215)
State:
13.0% (760,276)
Number of households with income $100k - 125k:
Alvin:
7.9% (539)
State:
10.2% (597,596)
Number of households with income $125k - 150k:
Alvin:
4.2% (285)
State:
7.4% (436,830)
Number of households with income $150k - 200k:
Alvin:
4.8% (331)
Texas:
9.9% (583,067)
Number of households with income > $200k:
Alvin:
6.5% (443)
Texas:
13.5% (792,647)
Aggregate household income in Alvin in 2022: $534,670,321
Median family income in Alvin in 2022:
Alvin:
$75,640
State:
$101,788
Number of families with income < $10k:
Alvin:
6.2% (273)
State:
2.8% (108,142)
Number of families with income $10k - 20k:
Alvin:
2.1% (95)
Texas:
2.9% (113,421)
Number of families with income $20k - 30k:
Alvin:
3.7% (165)
State:
4.1% (157,688)
Number of families with income $30k - 40k:
Alvin:
8.5% (375)
State:
5.2% (198,847)
Number of families with income $40k - 50k:
Alvin:
6.3% (279)
State:
5.6% (216,490)
Number of families with income $50k - 60k:
Alvin:
6.9% (303)
State:
5.7% (220,689)
Number of families with income $60k - 75k:
Alvin:
15.7% (692)
State:
9.0% (346,106)
Number of families with income $75k - 100k:
Alvin:
20.2% (892)
Texas:
13.7% (527,363)
Number of families with income $100k - 125k:
Alvin:
10.5% (463)
Texas:
11.6% (448,411)
Number of families with income $125k - 150k:
Alvin:
4.7% (209)
State:
9.2% (355,798)
Number of families with income $150k - 200k:
Alvin:
5.5% (244)
State:
12.5% (480,185)
Number of families with income > $200k:
Alvin:
9.5% (420)
State:
17.6% (677,490)
Median non-family income in Alvin in 2022:
Alvin:
$41,314
State:
$50,587
Change in median non-family income between 2000 and 2022:
Alvin, Texas:
+73.4%
State:
+87.7%
Median per capita income in Alvin in 2022:
Alvin:
$32,738
State:
$47,740
Change in median per capita income between 2000 and 2022:
Alvin, Texas:
+76.4%
Texas:
+114.3%
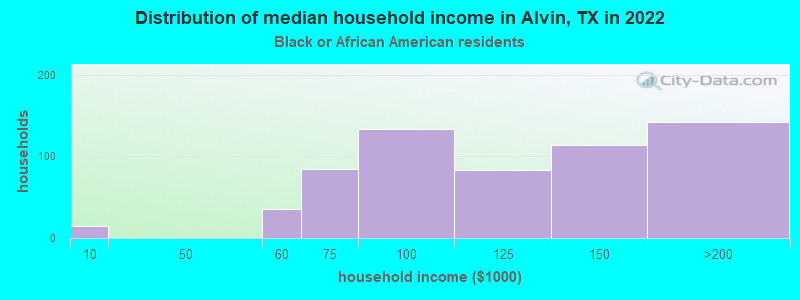
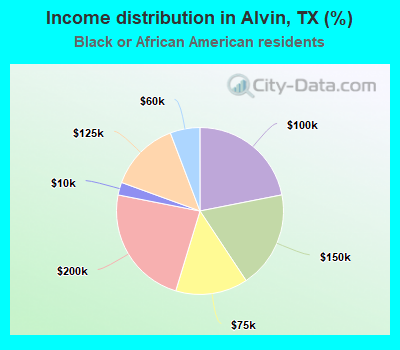
Income statistics for Black or African American residents
Median household income in Alvin, TX in 2022:
Alvin:
$96,236
State:
$55,759
Number of households with income < $10k:
Alvin:
2.5% (15)
Texas:
8.9% (126,378)
Number of households with income $10k - 20k:
Alvin:
0.0% (0)
State:
9.9% (140,369)
Number of households with income $20k - 30k:
Alvin:
0.0% (0)
State:
8.5% (120,639)
Number of households with income $30k - 40k:
Alvin:
0.0% (0)
Texas:
9.7% (137,517)
Number of households with income $40k - 50k:
Alvin:
0.0% (0)
Texas:
8.0% (112,973)
Number of households with income $50k - 60k:
Alvin:
5.8% (35)
Texas:
8.3% (117,156)
Number of households with income $60k - 75k:
Alvin:
14.0% (85)
State:
10.4% (147,462)
Number of households with income $75k - 100k:
Alvin:
21.9% (133)
Texas:
11.5% (162,718)
Number of households with income $100k - 125k:
Alvin:
13.7% (83)
State:
8.2% (115,829)
Number of households with income $125k - 150k:
Alvin:
18.8% (114)
Texas:
4.9% (69,556)
Number of households with income $150k - 200k:
Alvin:
23.4% (142)
State:
6.4% (90,701)
Number of households with income > $200k:
Alvin:
0.0% (0)
Texas:
5.5% (77,988)
Aggregate household income in Alvin in 2022: $55,026,185
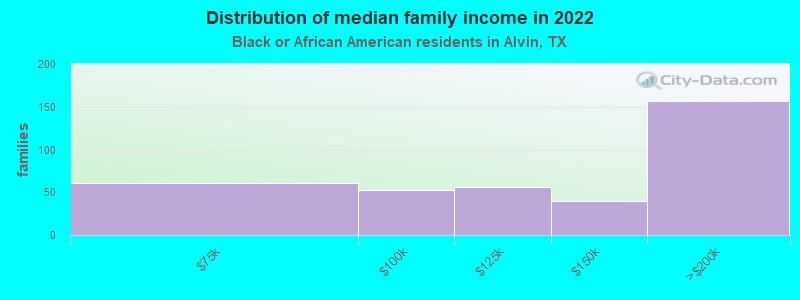
Median family income in Alvin in 2022:
Alvin:
$95,858
State:
$69,134
Number of families with income $60k - 75k:
Alvin:
16.6% (61)
State:
10.1% (81,994)
Number of families with income $75k - 100k:
Alvin:
14.4% (53)
State:
12.7% (103,723)
Number of families with income $100k - 125k:
Alvin:
15.2% (56)
State:
9.4% (76,609)
Number of families with income $125k - 150k:
Alvin:
10.9% (40)
State:
6.8% (55,615)
Number of families with income $150k - 200k:
Alvin:
42.9% (157)
Texas:
9.4% (76,146)
Median non-family income in Alvin in 2022:
Alvin:
$115,621
Texas:
$40,133
Change in median non-family income between 2000 and 2022:
Alvin, Texas:
+51.9%
State:
+102.2%
Median per capita income in Alvin in 2022:
Alvin:
$27,820
State:
$30,490
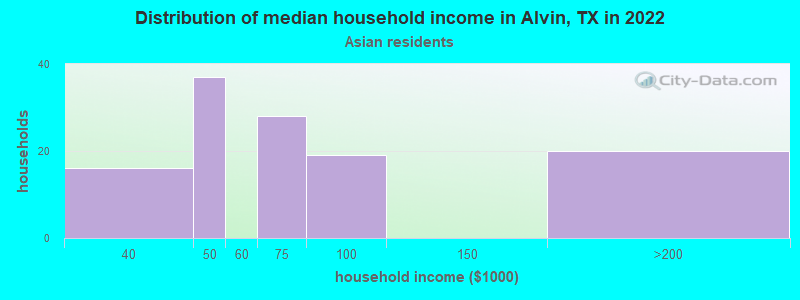
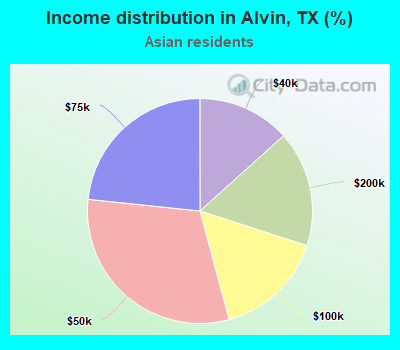
Income statistics for Asian residents
Median household income in Alvin, TX in 2022:
Alvin:
$71,448
State:
$107,673
Change in median household income between 2000 and 2022:
Alvin, Texas:
+132.0%
State:
+115.1%
Number of households with income < $10k:
Alvin:
0.0% (0)
State:
5.2% (29,885)
Number of households with income $10k - 20k:
Alvin:
0.0% (0)
Texas:
4.7% (27,044)
Number of households with income $20k - 30k:
Alvin:
0.0% (0)
Texas:
4.1% (23,363)
Number of households with income $30k - 40k:
Alvin:
13.3% (16)
State:
4.1% (23,309)
Number of households with income $40k - 50k:
Alvin:
30.8% (37)
Texas:
5.2% (29,826)
Number of households with income $50k - 60k:
Alvin:
0.0% (0)
State:
4.7% (26,512)
Number of households with income $60k - 75k:
Alvin:
23.3% (28)
State:
6.5% (36,905)
Number of households with income $75k - 100k:
Alvin:
15.8% (19)
Texas:
11.3% (64,350)
Number of households with income $100k - 125k:
Alvin:
0.0% (0)
Texas:
11.4% (64,714)
Number of households with income $125k - 150k:
Alvin:
0.0% (0)
Texas:
9.3% (52,719)
Number of households with income $150k - 200k:
Alvin:
16.7% (20)
Texas:
12.5% (70,953)
Number of households with income > $200k:
Alvin:
0.0% (0)
State:
21.1% (120,260)
Aggregate household income in Alvin in 2022: $11,843,614
Median non-family income in Alvin in 2022:
Alvin:
$28,705
State:
$64,320
Change in median non-family income between 2000 and 2022:
Alvin, Texas:
+137.6%
Texas:
+131.1%
Median per capita income in Alvin in 2022:
Alvin:
$34,268
State:
$48,626
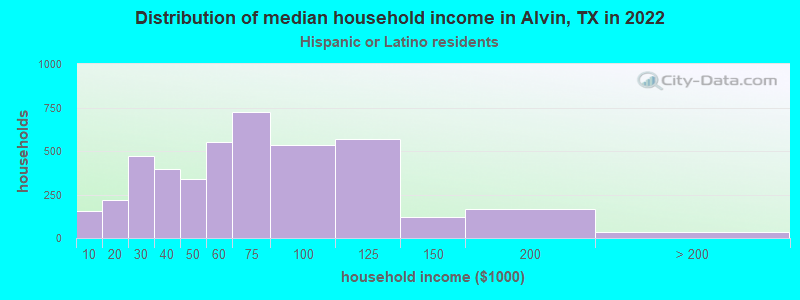
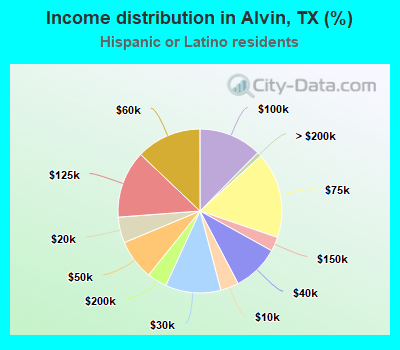
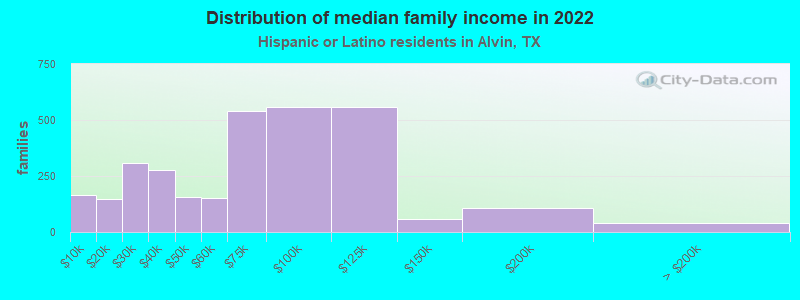
Income statistics for Hispanic or Latino residents
Median household income in Alvin, TX in 2022:
Alvin:
$60,647
State:
$60,504
Change in median household income between 2000 and 2022:
Alvin, Texas:
+87.2%
State:
+102.5%
Number of households with income < $10k:
Alvin:
3.6% (154)
State:
5.8% (213,953)
Number of households with income $10k - 20k:
Alvin:
5.1% (218)
Texas:
8.0% (297,456)
Number of households with income $20k - 30k:
Alvin:
10.9% (469)
Texas:
9.2% (340,166)
Number of households with income $30k - 40k:
Alvin:
9.2% (396)
State:
9.5% (354,336)
Number of households with income $40k - 50k:
Alvin:
7.9% (340)
Texas:
8.8% (327,013)
Number of households with income $50k - 60k:
Alvin:
12.9% (552)
Texas:
8.3% (308,818)
Number of households with income $60k - 75k:
Alvin:
16.9% (725)
Texas:
10.9% (405,109)
Number of households with income $75k - 100k:
Alvin:
12.4% (533)
State:
13.8% (511,639)
Number of households with income $100k - 125k:
Alvin:
13.3% (570)
Texas:
8.6% (319,728)
Number of households with income $125k - 150k:
Alvin:
2.8% (122)
State:
5.7% (210,932)
Number of households with income $150k - 200k:
Alvin:
3.9% (168)
Texas:
6.4% (236,055)
Number of households with income > $200k:
Alvin:
0.9% (37)
State:
5.1% (189,259)
Aggregate household income in Alvin in 2022: $266,959,915
Median family income in Alvin in 2022:
Alvin:
$64,951
State:
$65,080
Number of families with income < $10k:
Alvin:
5.4% (167)
Texas:
5.3% (147,493)
Number of families with income $10k - 20k:
Alvin:
4.8% (147)
State:
6.3% (174,531)
Number of families with income $20k - 30k:
Alvin:
10.1% (310)
State:
8.6% (238,528)
Number of families with income $30k - 40k:
Alvin:
8.9% (275)
State:
9.1% (251,999)
Number of families with income $40k - 50k:
Alvin:
5.1% (158)
State:
8.6% (240,188)
Number of families with income $50k - 60k:
Alvin:
5.0% (154)
State:
8.0% (223,566)
Number of families with income $60k - 75k:
Alvin:
17.5% (540)
Texas:
10.9% (302,688)
Number of families with income $75k - 100k:
Alvin:
18.2% (560)
State:
14.3% (398,554)
Number of families with income $100k - 125k:
Alvin:
18.1% (557)
State:
9.5% (264,007)
Number of families with income $125k - 150k:
Alvin:
2.0% (60)
State:
6.2% (171,274)
Number of families with income $150k - 200k:
Alvin:
3.5% (108)
Texas:
7.3% (202,259)
Number of families with income > $200k:
Alvin:
1.4% (42)
State:
5.9% (165,129)
Median non-family income in Alvin in 2022:
Alvin:
$45,814
State:
$39,934
Change in median non-family income between 2000 and 2022:
Alvin, Texas:
+118.6%
Texas:
+109.1%
Median per capita income in Alvin in 2022:
Alvin:
$22,222
State:
$24,862
Change in median per capita income between 2000 and 2022:
Alvin, Texas:
+116.3%
State:
+130.8%
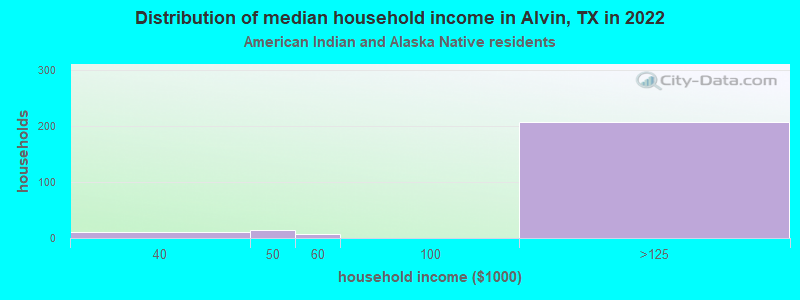
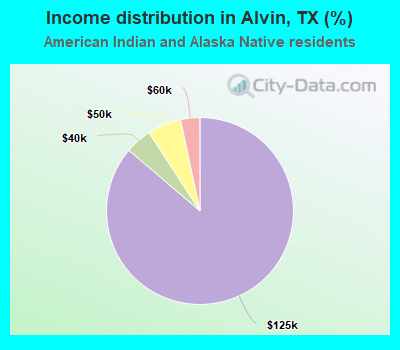
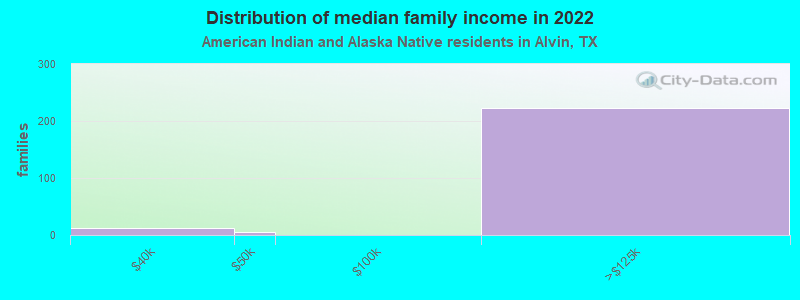
Income statistics for American Indian and Alaska Native residents
Median household income in Alvin, TX in 2022:
Alvin:
$97,856
Texas:
$65,765
Number of households with income < $10k:
Alvin:
0.0% (0)
Texas:
4.1% (3,398)
Number of households with income $10k - 20k:
Alvin:
0.0% (0)
State:
8.3% (6,949)
Number of households with income $20k - 30k:
Alvin:
0.0% (0)
State:
9.3% (7,742)
Number of households with income $30k - 40k:
Alvin:
4.6% (11)
State:
9.1% (7,627)
Number of households with income $40k - 50k:
Alvin:
5.8% (14)
State:
7.1% (5,922)
Number of households with income $50k - 60k:
Alvin:
3.3% (8)
State:
8.1% (6,761)
Number of households with income $60k - 75k:
Alvin:
0.0% (0)
Texas:
12.7% (10,588)
Number of households with income $75k - 100k:
Alvin:
0.0% (0)
State:
13.0% (10,903)
Number of households with income $100k - 125k:
Alvin:
86.2% (207)
State:
9.9% (8,256)
Number of households with income $125k - 150k:
Alvin:
0.0% (0)
State:
5.2% (4,355)
Number of households with income $150k - 200k:
Alvin:
0.0% (0)
State:
6.7% (5,623)
Number of households with income > $200k:
Alvin:
0.0% (0)
Texas:
6.6% (5,522)
Aggregate household income in Alvin in 2022: $13,362,974
Median family income in Alvin in 2022:
Alvin:
$97,425
State:
$72,369
Number of families with income $30k - 40k:
Alvin:
5.1% (12)
Texas:
7.5% (4,592)
Number of families with income $40k - 50k:
Alvin:
2.6% (6)
State:
7.9% (4,855)
Number of families with income $100k - 125k:
Alvin:
92.3% (223)
Texas:
11.4% (6,997)
Median per capita income in Alvin in 2022:
Alvin:
$24,095
State:
$28,166
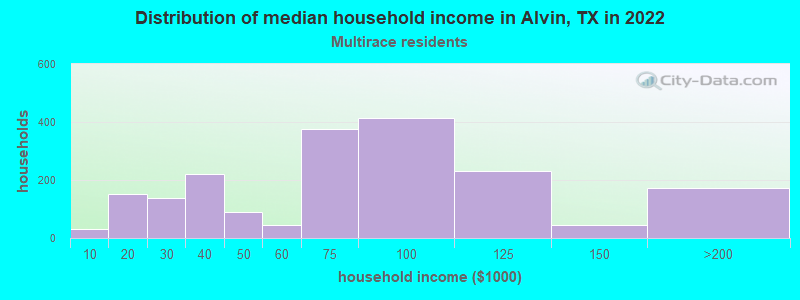
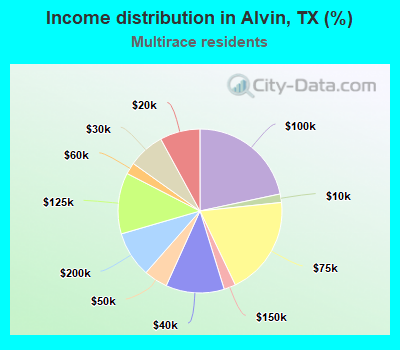
Income statistics for Multirace residents
Median household income in Alvin, TX in 2022:
Alvin:
$59,529
State:
$62,748
Change in median household income between 2000 and 2022:
Alvin, Texas:
+119.3%
State:
+92.3%
Number of households with income < $10k:
Alvin:
1.7% (32)
Texas:
5.5% (122,324)
Number of households with income $10k - 20k:
Alvin:
7.9% (152)
State:
8.2% (182,232)
Number of households with income $20k - 30k:
Alvin:
7.2% (138)
State:
8.5% (189,456)
Number of households with income $30k - 40k:
Alvin:
11.5% (221)
Texas:
8.9% (197,499)
Number of households with income $40k - 50k:
Alvin:
4.7% (90)
State:
8.7% (191,735)
Number of households with income $50k - 60k:
Alvin:
2.3% (44)
Texas:
8.0% (177,535)
Number of households with income $60k - 75k:
Alvin:
19.6% (375)
State:
10.5% (232,479)
Number of households with income $75k - 100k:
Alvin:
21.7% (415)
State:
13.1% (290,448)
Number of households with income $100k - 125k:
Alvin:
12.1% (231)
State:
8.6% (191,595)
Number of households with income $125k - 150k:
Alvin:
2.3% (44)
State:
6.0% (133,361)
Number of households with income $150k - 200k:
Alvin:
9.0% (173)
State:
7.2% (159,195)
Number of households with income > $200k:
Alvin:
0.0% (0)
State:
6.7% (148,064)
Aggregate household income in Alvin in 2022: $144,661,599
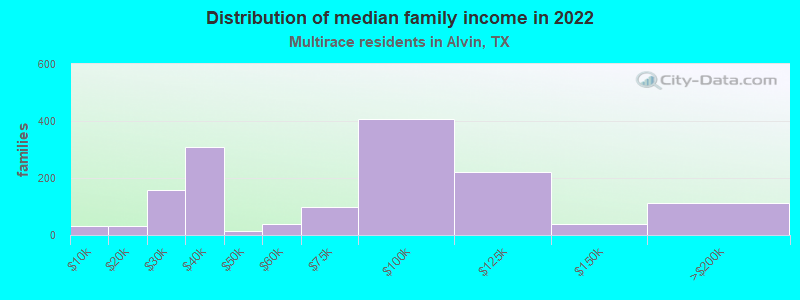
Median family income in Alvin in 2022:
Alvin:
$72,347
Texas:
$69,780
Number of families with income < $10k:
Alvin:
2.2% (33)
Texas:
4.4% (70,825)
Number of families with income $10k - 20k:
Alvin:
2.2% (32)
Texas:
5.9% (95,279)
Number of families with income $20k - 30k:
Alvin:
10.7% (157)
Texas:
7.8% (126,627)
Number of families with income $30k - 40k:
Alvin:
21.2% (309)
Texas:
8.5% (137,626)
Number of families with income $40k - 50k:
Alvin:
1.0% (15)
State:
8.4% (135,809)
Number of families with income $50k - 60k:
Alvin:
2.5% (37)
State:
7.9% (127,739)
Number of families with income $60k - 75k:
Alvin:
6.7% (97)
Texas:
10.5% (169,549)
Number of families with income $75k - 100k:
Alvin:
27.8% (406)
State:
14.0% (226,284)
Number of families with income $100k - 125k:
Alvin:
15.2% (222)
State:
9.5% (153,597)
Number of families with income $125k - 150k:
Alvin:
2.7% (40)
Texas:
6.7% (107,900)
Number of families with income $150k - 200k:
Alvin:
7.6% (112)
State:
8.5% (137,607)
Median non-family income in Alvin in 2022:
Alvin:
$42,527
Texas:
$40,634
Median per capita income in Alvin in 2022:
Alvin:
$18,256
State:
$26,785
Change in median per capita income between 2000 and 2022:
Alvin, Texas:
+115.6%
State:
+110.9%
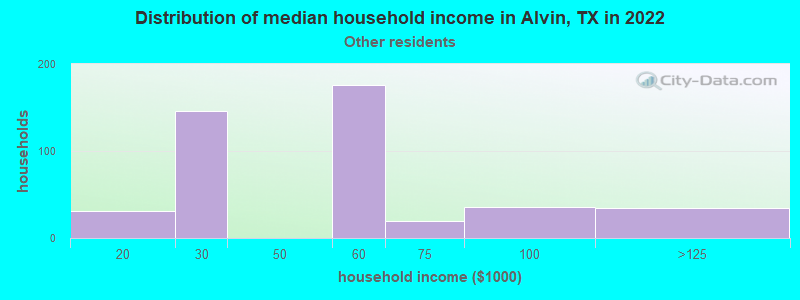
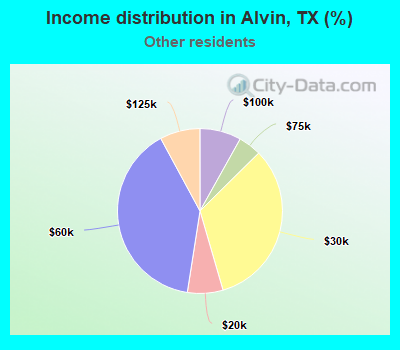
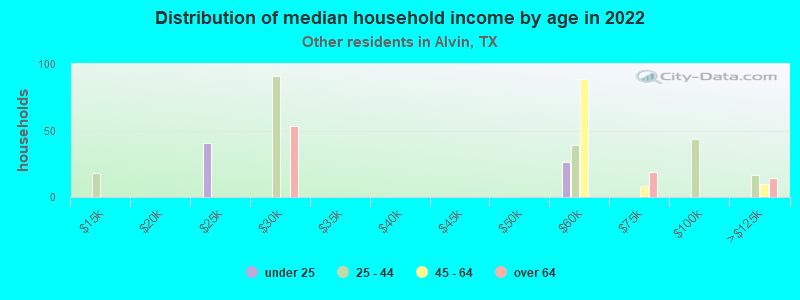
Income statistics for other residents
Median household income in Alvin, TX in 2022:
Alvin:
$47,183
State:
$57,114
Number of households with income < $10k:
Alvin:
0.0% (0)
State:
5.9% (54,162)
Number of households with income $10k - 20k:
Alvin:
7.0% (31)
State:
6.8% (62,891)
Number of households with income $20k - 30k:
Alvin:
32.9% (146)
Texas:
10.6% (97,294)
Number of households with income $30k - 40k:
Alvin:
0.0% (0)
State:
10.8% (99,670)
Number of households with income $40k - 50k:
Alvin:
0.0% (0)
State:
9.3% (85,548)
Number of households with income $50k - 60k:
Alvin:
39.6% (176)
Texas:
9.0% (82,757)
Number of households with income $60k - 75k:
Alvin:
4.5% (20)
Texas:
10.9% (100,326)
Number of households with income $75k - 100k:
Alvin:
8.1% (36)
State:
14.0% (128,767)
Number of households with income $100k - 125k:
Alvin:
7.9% (35)
State:
8.2% (75,218)
Number of households with income $125k - 150k:
Alvin:
0.0% (0)
State:
4.8% (44,223)
Number of households with income $150k - 200k:
Alvin:
0.0% (0)
State:
5.6% (51,376)
Number of households with income > $200k:
Alvin:
0.0% (0)
State:
4.0% (36,393)
Aggregate household income in Alvin in 2022: $21,305,017
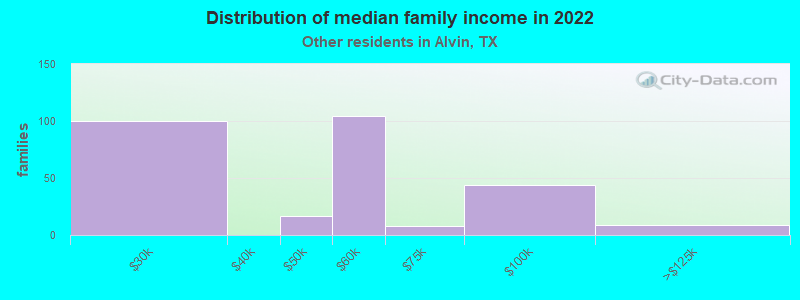
Median family income in Alvin in 2022:
Alvin:
$44,710
State:
$60,064
Number of families with income $20k - 30k:
Alvin:
35.6% (100)
Texas:
9.9% (68,761)
Number of families with income $40k - 50k:
Alvin:
6.0% (17)
State:
9.0% (62,441)
Number of families with income $50k - 60k:
Alvin:
36.8% (104)
State:
8.5% (59,321)
Number of families with income $60k - 75k:
Alvin:
2.8% (8)
State:
11.2% (77,588)
Number of families with income $75k - 100k:
Alvin:
15.6% (44)
State:
14.5% (101,032)
Number of families with income $100k - 125k:
Alvin:
3.2% (9)
State:
8.8% (61,439)
Median per capita income in Alvin in 2022:
Alvin:
$29,078
Texas:
$23,899
Discuss Alvin, Texas (TX) on our hugely popular Texas forum.