Coachella Valley, California (CA) income map, earnings map, and wages data
The median household income in Coachella Valley, CA in 2022 was $72,127, which was 26.9% less than the median annual income of $91,551 across the entire state of California. Compared to the median income of $35,659 in 2000 this represents an increase of 50.6%. The per capita income in 2022 was $26,935, which means an increase of 47.3% compared to 2000 when it was $14,193.
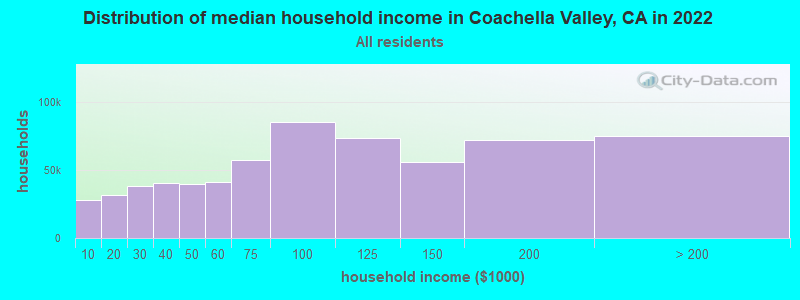
Income statistics for all residents
Median household income in Coachella Valley, CA in 2022:| Coachella Valley: | $72,128 |
| State: | $91,551 |
Change in median household income between 2000 and 2022:| Coachella Valley, California: | +102.3% |
| State: | +92.8% |
Number of households with income < $10k:| Coachella Valley: | 4.4% (27,994) |
| State: | 4.8% (654,370) |
Number of households with income $10k - 20k:| Coachella Valley: | 4.9% (31,658) |
| State: | 5.8% (789,493) |
Number of households with income $20k - 30k:| Coachella Valley: | 6.0% (38,209) |
| State: | 5.7% (778,318) |
Number of households with income $30k - 40k:| Coachella Valley: | 6.3% (40,601) |
| State: | 5.8% (783,170) |
Number of households with income $40k - 50k:| Coachella Valley: | 6.3% (40,098) |
| State: | 5.8% (781,352) |
Number of households with income $50k - 60k:| Coachella Valley: | 6.4% (41,236) |
| State: | 5.6% (760,175) |
Number of households with income $60k - 75k:| Coachella Valley: | 9.0% (57,739) |
| State: | 8.2% (1,104,699) |
Number of households with income $75k - 100k:| Coachella Valley: | 13.4% (85,442) |
| State: | 12.0% (1,627,633) |
Number of households with income $100k - 125k:| Coachella Valley: | 11.5% (73,531) |
| State: | 10.0% (1,358,619) |
Number of households with income $125k - 150k:| Coachella Valley: | 8.8% (56,239) |
| California: | 7.6% (1,027,455) |
Number of households with income $150k - 200k:| Coachella Valley: | 11.2% (71,854) |
| State: | 10.6% (1,439,811) |
Number of households with income > $200k:| Coachella Valley: | 11.8% (75,189) |
| California: | 18.0% (2,445,491) |
Aggregate household income in Coachella Valley in 2022: $64,931,611,778
Median family income in Coachella Valley in 2022:| Coachella Valley: | $72,068 |
| State: | $104,823 |
Median non-family income in Coachella Valley in 2022:| Coachella Valley: | $49,535 |
| State: | $59,348 |
Change in median non-family income between 2000 and 2022:| Coachella Valley, California: | +90.9% |
| State: | +85.3% |
Median per capita income in Coachella Valley in 2022:| Coachella Valley: | $26,935 |
| California: | $46,661 |
Change in median per capita income between 2000 and 2022:| Coachella Valley, California: | +89.8% |
| California: | +105.5% |
Income statistics for White residents
Median household income in Coachella Valley, CA in 2022:| Coachella Valley: | $79,311 |
| State: | $100,917 |
Change in median household income between 2000 and 2022:| Coachella Valley, California: | +101.4% |
| State: | +96.8% |
Number of households with income < $10k:| Coachella Valley: | 4.4% (13,643) |
| California: | 4.4% (284,109) |
Number of households with income $10k - 20k:| Coachella Valley: | 5.2% (16,357) |
| State: | 5.3% (340,330) |
Number of households with income $20k - 30k:| Coachella Valley: | 6.3% (19,764) |
| State: | 5.3% (343,145) |
Number of households with income $30k - 40k:| Coachella Valley: | 5.7% (17,962) |
| State: | 5.1% (330,146) |
Number of households with income $40k - 50k:| Coachella Valley: | 5.8% (18,137) |
| California: | 5.2% (335,310) |
Number of households with income $50k - 60k:| Coachella Valley: | 6.0% (18,961) |
| California: | 5.1% (326,299) |
Number of households with income $60k - 75k:| Coachella Valley: | 8.8% (27,552) |
| State: | 7.6% (487,640) |
Number of households with income $75k - 100k:| Coachella Valley: | 12.4% (39,034) |
| State: | 11.5% (736,578) |
Number of households with income $100k - 125k:| Coachella Valley: | 10.7% (33,597) |
| State: | 10.1% (648,782) |
Number of households with income $125k - 150k:| Coachella Valley: | 9.0% (28,257) |
| State: | 7.8% (499,671) |
Number of households with income $150k - 200k:| Coachella Valley: | 11.5% (36,047) |
| State: | 11.4% (729,603) |
Number of households with income > $200k:| Coachella Valley: | 14.1% (44,274) |
| State: | 21.2% (1,364,246) |
Aggregate household income in Coachella Valley in 2022: $21,588,596,190
Median family income in Coachella Valley in 2022:| Coachella Valley: | $83,871 |
| California: | $125,379 |
Number of families with income < $10k:| Coachella Valley: | 3.8% (484) |
| State: | 2.2% (87,079) |
Number of families with income $10k - 20k:| Coachella Valley: | 3.8% (485) |
| State: | 2.5% (97,716) |
Number of families with income $20k - 30k:| Coachella Valley: | 4.9% (622) |
| State: | 3.5% (137,295) |
Number of families with income $30k - 40k:| Coachella Valley: | 6.1% (777) |
| State: | 3.9% (152,947) |
Number of families with income $40k - 50k:| Coachella Valley: | 5.5% (703) |
| California: | 4.3% (169,197) |
Number of families with income $50k - 60k:| Coachella Valley: | 5.2% (660) |
| California: | 4.5% (176,192) |
Number of families with income $60k - 75k:| Coachella Valley: | 6.6% (844) |
| California: | 7.0% (274,752) |
Number of families with income $75k - 100k:| Coachella Valley: | 9.5% (1,217) |
| State: | 11.3% (445,632) |
Number of families with income $100k - 125k:| Coachella Valley: | 11.8% (1,507) |
| California: | 10.7% (423,630) |
Number of families with income $125k - 150k:| Coachella Valley: | 10.3% (1,314) |
| California: | 9.1% (357,408) |
Number of families with income $150k - 200k:| Coachella Valley: | 13.6% (1,742) |
| State: | 13.5% (532,693) |
Number of families with income > $200k:| Coachella Valley: | 19.0% (2,427) |
| State: | 27.6% (1,086,948) |
Median non-family income in Coachella Valley in 2022:| Coachella Valley: | $55,368 |
| State: | $62,819 |
Change in median non-family income between 2000 and 2022:| Coachella Valley, California: | +89.2% |
| State: | +84.4% |
Median per capita income in Coachella Valley in 2022:| Coachella Valley: | $40,195 |
| California: | $61,706 |
Change in median per capita income between 2000 and 2022:| Coachella Valley, California: | +114.2% |
| State: | +122.7% |
Income statistics for Black or African American residents
Median household income in Coachella Valley, CA in 2022:| Coachella Valley: | $61,894 |
| California: | $63,268 |
Change in median household income between 2000 and 2022:| Coachella Valley, California: | +106.7% |
| State: | +81.0% |
Number of households with income < $10k:| Coachella Valley: | 7.4% (3,103) |
| California: | 9.0% (73,219) |
Number of households with income $10k - 20k:| Coachella Valley: | 7.7% (3,228) |
| California: | 10.6% (86,666) |
Number of households with income $20k - 30k:| Coachella Valley: | 5.3% (2,232) |
| California: | 7.1% (57,719) |
Number of households with income $30k - 40k:| Coachella Valley: | 5.6% (2,364) |
| State: | 7.2% (58,714) |
Number of households with income $40k - 50k:| Coachella Valley: | 5.7% (2,400) |
| State: | 7.1% (58,075) |
Number of households with income $50k - 60k:| Coachella Valley: | 7.0% (2,937) |
| State: | 6.8% (55,229) |
Number of households with income $60k - 75k:| Coachella Valley: | 8.5% (3,599) |
| State: | 8.8% (71,895) |
Number of households with income $75k - 100k:| Coachella Valley: | 13.3% (5,607) |
| State: | 11.9% (96,893) |
Number of households with income $100k - 125k:| Coachella Valley: | 13.0% (5,469) |
| State: | 8.7% (70,729) |
Number of households with income $125k - 150k:| Coachella Valley: | 6.8% (2,873) |
| State: | 6.3% (51,211) |
Number of households with income $150k - 200k:| Coachella Valley: | 9.2% (3,873) |
| State: | 7.2% (58,687) |
Number of households with income > $200k:| Coachella Valley: | 10.6% (4,477) |
| State: | 9.3% (75,487) |
Aggregate household income in Coachella Valley in 2022: $66,011,261
Median family income in Coachella Valley in 2022:| Coachella Valley: | $65,968 |
| California: | $77,263 |
Number of families with income < $10k:| Coachella Valley: | 14.6% (65) |
| California: | 5.9% (27,037) |
Number of families with income $10k - 20k:| Coachella Valley: | 9.1% (40) |
| State: | 6.4% (29,505) |
Number of families with income $20k - 30k:| Coachella Valley: | 4.4% (19) |
| California: | 5.6% (25,755) |
Number of families with income $30k - 40k:| Coachella Valley: | 5.4% (24) |
| State: | 6.8% (30,948) |
Number of families with income $40k - 50k:| Coachella Valley: | 2.8% (13) |
| California: | 8.3% (38,171) |
Number of families with income $50k - 60k:| Coachella Valley: | 14.2% (63) |
| California: | 7.0% (31,860) |
Number of families with income $60k - 75k:| Coachella Valley: | 20.9% (92) |
| State: | 8.7% (40,021) |
Number of families with income $75k - 100k:| Coachella Valley: | 9.5% (42) |
| State: | 12.4% (56,846) |
Number of families with income $100k - 125k:| Coachella Valley: | 4.5% (20) |
| State: | 9.8% (44,911) |
Number of families with income $150k - 200k:| Coachella Valley: | 14.5% (64) |
| California: | 9.3% (42,807) |
Median non-family income in Coachella Valley in 2022:| Coachella Valley: | $17,640 |
| California: | $41,942 |
Change in median non-family income between 2000 and 2022:| Coachella Valley, California: | +129.1% |
| State: | +72.0% |
Median per capita income in Coachella Valley in 2022:| Coachella Valley: | $25,171 |
| State: | $36,708 |
Change in median per capita income between 2000 and 2022:| Coachella Valley, California: | +132.5% |
| California: | +110.4% |
Income statistics for Asian residents
Median household income in Coachella Valley, CA in 2022:| Coachella Valley: | $115,015 |
| State: | $119,861 |
Change in median household income between 2000 and 2022:| Coachella Valley, California: | +115.7% |
| California: | +116.5% |
Number of households with income < $10k:| Coachella Valley: | 4.6% (2,492) |
| California: | 5.1% (106,273) |
Number of households with income $10k - 20k:| Coachella Valley: | 2.9% (1,564) |
| State: | 4.9% (101,815) |
Number of households with income $20k - 30k:| Coachella Valley: | 6.1% (3,314) |
| State: | 4.6% (94,414) |
Number of households with income $30k - 40k:| Coachella Valley: | 4.8% (2,617) |
| State: | 4.1% (84,491) |
Number of households with income $40k - 50k:| Coachella Valley: | 6.5% (3,490) |
| State: | 4.0% (81,758) |
Number of households with income $50k - 60k:| Coachella Valley: | 4.1% (2,207) |
| State: | 3.9% (80,971) |
Number of households with income $60k - 75k:| Coachella Valley: | 7.3% (3,958) |
| State: | 6.0% (124,194) |
Number of households with income $75k - 100k:| Coachella Valley: | 8.9% (4,823) |
| State: | 9.7% (200,337) |
Number of households with income $100k - 125k:| Coachella Valley: | 12.8% (6,901) |
| State: | 9.4% (193,488) |
Number of households with income $125k - 150k:| Coachella Valley: | 11.9% (6,449) |
| State: | 7.7% (158,253) |
Number of households with income $150k - 200k:| Coachella Valley: | 13.9% (7,535) |
| California: | 12.2% (252,139) |
Number of households with income > $200k:| Coachella Valley: | 16.1% (8,702) |
| California: | 28.4% (586,641) |
Aggregate household income in Coachella Valley in 2022: $235,381,352
Median family income in Coachella Valley in 2022:| Coachella Valley: | $127,914 |
| State: | $136,040 |
Number of families with income < $10k:| Coachella Valley: | 3.4% (64) |
| State: | 2.8% (42,046) |
Number of families with income $10k - 20k:| Coachella Valley: | 0.8% (15) |
| State: | 3.1% (46,821) |
Number of families with income $20k - 30k:| Coachella Valley: | 0.6% (12) |
| California: | 4.1% (61,519) |
Number of families with income $30k - 40k:| Coachella Valley: | 2.8% (53) |
| State: | 3.7% (55,234) |
Number of families with income $40k - 50k:| Coachella Valley: | 2.9% (54) |
| State: | 3.9% (58,471) |
Number of families with income $50k - 60k:| Coachella Valley: | 2.0% (37) |
| State: | 3.9% (58,911) |
Number of families with income $60k - 75k:| Coachella Valley: | 4.3% (80) |
| State: | 5.9% (88,675) |
Number of families with income $75k - 100k:| Coachella Valley: | 5.0% (93) |
| State: | 9.5% (143,103) |
Number of families with income $100k - 125k:| Coachella Valley: | 7.0% (131) |
| State: | 9.4% (142,085) |
Number of families with income $125k - 150k:| Coachella Valley: | 8.5% (158) |
| State: | 8.0% (120,635) |
Number of families with income $150k - 200k:| Coachella Valley: | 22.1% (412) |
| State: | 13.2% (198,099) |
Number of families with income > $200k:| Coachella Valley: | 40.5% (755) |
| State: | 32.5% (489,303) |
Median non-family income in Coachella Valley in 2022:| Coachella Valley: | $79,561 |
| State: | $74,216 |
Median per capita income in Coachella Valley in 2022:| Coachella Valley: | $46,011 |
| State: | $58,824 |
Change in median per capita income between 2000 and 2022:| Coachella Valley, California: | +104.0% |
| California: | +166.8% |
Income statistics for Hispanic or Latino residents
Median household income in Coachella Valley, CA in 2022:| Coachella Valley: | $66,778 |
| State: | $75,698 |
Change in median household income between 2000 and 2022:| Coachella Valley, California: | +126.6% |
| State: | +107.2% |
Number of households with income < $10k:| Coachella Valley: | 3.7% (9,423) |
| State: | 4.3% (183,294) |
Number of households with income $10k - 20k:| Coachella Valley: | 4.5% (11,563) |
| State: | 6.0% (253,903) |
Number of households with income $20k - 30k:| Coachella Valley: | 5.7% (14,708) |
| California: | 6.8% (286,386) |
Number of households with income $30k - 40k:| Coachella Valley: | 7.3% (18,684) |
| State: | 7.4% (313,728) |
Number of households with income $40k - 50k:| Coachella Valley: | 6.5% (16,619) |
| State: | 7.4% (313,199) |
Number of households with income $50k - 60k:| Coachella Valley: | 7.3% (18,845) |
| State: | 7.2% (305,366) |
Number of households with income $60k - 75k:| Coachella Valley: | 9.4% (24,162) |
| State: | 10.3% (434,937) |
Number of households with income $75k - 100k:| Coachella Valley: | 15.9% (40,732) |
| California: | 14.4% (607,302) |
Number of households with income $100k - 125k:| Coachella Valley: | 12.5% (32,069) |
| State: | 10.6% (447,424) |
Number of households with income $125k - 150k:| Coachella Valley: | 9.0% (23,122) |
| State: | 7.5% (316,022) |
Number of households with income $150k - 200k:| Coachella Valley: | 11.0% (28,390) |
| State: | 9.2% (386,269) |
Number of households with income > $200k:| Coachella Valley: | 7.3% (18,667) |
| State: | 8.8% (372,651) |
Aggregate household income in Coachella Valley in 2022: $11,172,302,873
Median family income in Coachella Valley in 2022:| Coachella Valley: | $69,061 |
| California: | $77,589 |
Number of families with income < $10k:| Coachella Valley: | 1.9% (212) |
| California: | 3.9% (129,468) |
Number of families with income $10k - 20k:| Coachella Valley: | 3.0% (334) |
| State: | 4.6% (151,997) |
Number of families with income $20k - 30k:| Coachella Valley: | 4.0% (443) |
| California: | 6.6% (216,764) |
Number of families with income $30k - 40k:| Coachella Valley: | 8.2% (913) |
| California: | 7.6% (249,849) |
Number of families with income $40k - 50k:| Coachella Valley: | 5.7% (637) |
| State: | 7.7% (254,822) |
Number of families with income $50k - 60k:| Coachella Valley: | 6.2% (684) |
| California: | 7.4% (244,815) |
Number of families with income $60k - 75k:| Coachella Valley: | 6.6% (735) |
| California: | 10.5% (345,838) |
Number of families with income $75k - 100k:| Coachella Valley: | 14.0% (1,558) |
| State: | 14.9% (491,589) |
Number of families with income $100k - 125k:| Coachella Valley: | 15.1% (1,683) |
| State: | 10.7% (355,400) |
Number of families with income $125k - 150k:| Coachella Valley: | 11.7% (1,302) |
| State: | 7.8% (259,317) |
Number of families with income $150k - 200k:| Coachella Valley: | 13.9% (1,551) |
| California: | 9.3% (306,566) |
Number of families with income > $200k:| Coachella Valley: | 9.6% (1,068) |
| California: | 9.1% (299,984) |
Median non-family income in Coachella Valley in 2022:| Coachella Valley: | $30,082 |
| State: | $49,746 |
Change in median non-family income between 2000 and 2022:| Coachella Valley, California: | +97.0% |
| State: | +100.7% |
Median per capita income in Coachella Valley in 2022:| Coachella Valley: | $21,692 |
| State: | $27,240 |
Change in median per capita income between 2000 and 2022:| Coachella Valley, California: | +141.6% |
| California: | +133.3% |
Income statistics for American Indian and Alaska Native residents
Median household income in Coachella Valley, CA in 2022:| Coachella Valley: | $63,498 |
| State: | $76,752 |
Change in median household income between 2000 and 2022:| Coachella Valley, California: | +101.6% |
| California: | +110.0% |
Number of households with income < $10k:| Coachella Valley: | 8.5% (783) |
| State: | 5.4% (8,471) |
Number of households with income $10k - 20k:| Coachella Valley: | 4.5% (412) |
| State: | 6.0% (9,381) |
Number of households with income $20k - 30k:| Coachella Valley: | 2.2% (202) |
| State: | 5.5% (8,668) |
Number of households with income $30k - 40k:| Coachella Valley: | 5.6% (514) |
| State: | 8.3% (13,030) |
Number of households with income $40k - 50k:| Coachella Valley: | 5.8% (534) |
| State: | 6.9% (10,908) |
Number of households with income $50k - 60k:| Coachella Valley: | 13.0% (1,197) |
| California: | 7.1% (11,198) |
Number of households with income $60k - 75k:| Coachella Valley: | 9.1% (832) |
| State: | 9.6% (15,190) |
Number of households with income $75k - 100k:| Coachella Valley: | 15.5% (1,422) |
| State: | 14.1% (22,274) |
Number of households with income $100k - 125k:| Coachella Valley: | 9.6% (886) |
| State: | 11.2% (17,643) |
Number of households with income $125k - 150k:| Coachella Valley: | 6.0% (554) |
| California: | 8.3% (13,117) |
Number of households with income $150k - 200k:| Coachella Valley: | 10.1% (926) |
| California: | 8.8% (13,853) |
Number of households with income > $200k:| Coachella Valley: | 10.1% (926) |
| California: | 8.8% (13,925) |
Aggregate household income in Coachella Valley in 2022: $54,727,117
Median family income in Coachella Valley in 2022:| Coachella Valley: | $69,306 |
| State: | $81,108 |
Number of families with income < $10k:| Coachella Valley: | 14.1% (56) |
| California: | 5.0% (5,711) |
Number of families with income $20k - 30k:| Coachella Valley: | 1.9% (8) |
| State: | 4.3% (4,876) |
Number of families with income $30k - 40k:| Coachella Valley: | 13.4% (53) |
| State: | 8.8% (9,994) |
Number of families with income $40k - 50k:| Coachella Valley: | 9.7% (39) |
| State: | 7.8% (8,776) |
Number of families with income $50k - 60k:| Coachella Valley: | 6.0% (24) |
| State: | 6.9% (7,834) |
Number of families with income $60k - 75k:| Coachella Valley: | 4.9% (19) |
| California: | 9.1% (10,247) |
Number of families with income $75k - 100k:| Coachella Valley: | 8.6% (34) |
| California: | 14.8% (16,731) |
Number of families with income $100k - 125k:| Coachella Valley: | 11.9% (47) |
| State: | 12.0% (13,609) |
Number of families with income > $200k:| Coachella Valley: | 29.4% (117) |
| State: | 10.1% (11,409) |
Median non-family income in Coachella Valley in 2022:| Coachella Valley: | $46,057 |
| State: | $51,296 |
Median per capita income in Coachella Valley in 2022:| Coachella Valley: | $23,837 |
| California: | $30,289 |
Change in median per capita income between 2000 and 2022:| Coachella Valley, California: | +133.6% |
| State: | +98.9% |
Income statistics for Multirace residents
Median household income in Coachella Valley, CA in 2022:| Coachella Valley: | $63,660 |
| State: | $83,153 |
Change in median household income between 2000 and 2022:| Coachella Valley, California: | +104.2% |
| State: | +106.0% |
Number of households with income < $10k:| Coachella Valley: | 4.2% (4,432) |
| California: | 4.2% (85,299) |
Number of households with income $10k - 20k:| Coachella Valley: | 4.7% (4,999) |
| California: | 6.1% (122,966) |
Number of households with income $20k - 30k:| Coachella Valley: | 5.5% (5,897) |
| State: | 6.4% (129,328) |
Number of households with income $30k - 40k:| Coachella Valley: | 7.8% (8,285) |
| State: | 6.4% (130,070) |
Number of households with income $40k - 50k:| Coachella Valley: | 7.2% (7,660) |
| State: | 6.5% (131,254) |
Number of households with income $50k - 60k:| Coachella Valley: | 7.3% (7,735) |
| State: | 6.5% (132,382) |
Number of households with income $60k - 75k:| Coachella Valley: | 8.9% (9,500) |
| California: | 9.4% (191,472) |
Number of households with income $75k - 100k:| Coachella Valley: | 15.1% (16,061) |
| California: | 13.3% (269,691) |
Number of households with income $100k - 125k:| Coachella Valley: | 10.7% (11,371) |
| State: | 10.2% (207,286) |
Number of households with income $125k - 150k:| Coachella Valley: | 8.9% (9,472) |
| California: | 7.8% (158,259) |
Number of households with income $150k - 200k:| Coachella Valley: | 10.2% (10,908) |
| State: | 10.3% (209,227) |
Number of households with income > $200k:| Coachella Valley: | 9.7% (10,362) |
| California: | 13.0% (263,210) |
Aggregate household income in Coachella Valley in 2022: $777,207,105
Median family income in Coachella Valley in 2022:| Coachella Valley: | $65,486 |
| State: | $87,642 |
Number of families with income < $10k:| Coachella Valley: | 3.1% (204) |
| California: | 3.2% (48,017) |
Number of families with income $10k - 20k:| Coachella Valley: | 5.3% (354) |
| California: | 4.1% (60,419) |
Number of families with income $20k - 30k:| Coachella Valley: | 5.8% (386) |
| California: | 6.1% (89,742) |
Number of families with income $30k - 40k:| Coachella Valley: | 6.6% (440) |
| State: | 6.2% (91,415) |
Number of families with income $40k - 50k:| Coachella Valley: | 4.5% (298) |
| State: | 6.8% (100,085) |
Number of families with income $50k - 60k:| Coachella Valley: | 4.6% (309) |
| State: | 6.7% (98,298) |
Number of families with income $60k - 75k:| Coachella Valley: | 6.3% (420) |
| California: | 9.5% (140,131) |
Number of families with income $75k - 100k:| Coachella Valley: | 25.1% (1,677) |
| State: | 13.8% (203,439) |
Number of families with income $150k - 200k:| Coachella Valley: | 22.4% (1,496) |
| State: | 10.9% (161,643) |
Number of families with income > $200k:| Coachella Valley: | 16.4% (1,099) |
| California: | 14.0% (207,317) |
Median non-family income in Coachella Valley in 2022:| Coachella Valley: | $32,316 |
| California: | $56,558 |
Change in median non-family income between 2000 and 2022:| Coachella Valley, California: | +80.4% |
| State: | +100.2% |
Median per capita income in Coachella Valley in 2022:| Coachella Valley: | $27,594 |
| California: | $32,124 |
Change in median per capita income between 2000 and 2022:| Coachella Valley, California: | +142.3% |
| State: | +120.4% |
Income statistics for other residents
Number of households with income < $10k:| Coachella Valley: | 3.0% (952) |
| State: | 4.6% (93,035) |
Number of households with income $10k - 20k:| Coachella Valley: | 4.4% (1,376) |
| California: | 6.3% (126,222) |
Number of households with income $20k - 30k:| Coachella Valley: | 6.1% (1,909) |
| State: | 7.1% (142,656) |
Number of households with income $30k - 40k:| Coachella Valley: | 7.3% (2,304) |
| State: | 8.2% (165,018) |
Number of households with income $40k - 50k:| Coachella Valley: | 6.8% (2,143) |
| State: | 8.0% (161,732) |
Number of households with income $50k - 60k:| Coachella Valley: | 6.8% (2,146) |
| California: | 7.6% (152,152) |
Number of households with income $60k - 75k:| Coachella Valley: | 10.3% (3,237) |
| California: | 10.4% (209,951) |
Number of households with income $75k - 100k:| Coachella Valley: | 15.3% (4,794) |
| California: | 14.7% (296,102) |
Number of households with income $100k - 125k:| Coachella Valley: | 13.1% (4,121) |
| California: | 10.7% (214,281) |
Number of households with income $125k - 150k:| Coachella Valley: | 8.2% (2,580) |
| State: | 7.1% (143,092) |
Number of households with income $150k - 200k:| Coachella Valley: | 11.5% (3,614) |
| State: | 8.6% (172,215) |
Number of households with income > $200k:| Coachella Valley: | 7.2% (2,249) |
| California: | 6.7% (134,102) |
Aggregate household income in Coachella Valley in 2022: $3,029,096,884
Median family income in Coachella Valley in 2022:| Coachella Valley: | $69,896 |
| California: | $72,756 |
Number of families with income < $10k:| Coachella Valley: | 5.5% (992) |
| State: | 4.3% (69,090) |
Number of families with income $10k - 20k:| Coachella Valley: | 5.7% (1,022) |
| State: | 5.1% (82,116) |
Number of families with income $20k - 30k:| Coachella Valley: | 8.2% (1,483) |
| State: | 7.0% (112,854) |
Number of families with income $30k - 40k:| Coachella Valley: | 9.4% (1,696) |
| State: | 8.4% (135,938) |
Number of families with income $40k - 50k:| Coachella Valley: | 8.4% (1,510) |
| State: | 8.4% (135,353) |
Number of families with income $50k - 60k:| Coachella Valley: | 6.6% (1,189) |
| California: | 7.7% (124,826) |
Number of families with income $60k - 75k:| Coachella Valley: | 9.2% (1,659) |
| California: | 10.7% (173,628) |
Number of families with income $75k - 100k:| Coachella Valley: | 13.2% (2,376) |
| California: | 15.2% (245,724) |
Number of families with income $100k - 125k:| Coachella Valley: | 11.4% (2,058) |
| State: | 10.9% (176,716) |
Number of families with income $125k - 150k:| Coachella Valley: | 6.6% (1,182) |
| State: | 7.4% (119,985) |
Number of families with income $150k - 200k:| Coachella Valley: | 6.0% (1,082) |
| State: | 8.5% (137,332) |
Number of families with income > $200k:| Coachella Valley: | 9.6% (1,734) |
| State: | 6.6% (106,346) |
Median non-family income in Coachella Valley in 2022:| Coachella Valley: | $36,336 |
| State: | $43,881 |
Change in median non-family income between 2000 and 2022:| Coachella Valley, California: | +121.1% |
| State: | +84.6% |
Median per capita income in Coachella Valley in 2022:| Coachella Valley: | $21,485 |
| California: | $25,164 |
Change in median per capita income between 2000 and 2022:| Coachella Valley, California: | +141.4% |
| State: | +137.9% |