The median household income in Ferrum, VA in 2022 was $33,431, which was 156.9% less than the median annual income of $85,873 across the entire state of Virginia. Compared to the median income of $35,208 in 2000 this represents a decrease of 5.3%. The per capita income in 2022 was $13,146, which means an increase of 6.6% compared to 2000 when it was $12,276.
Whole page based on the data from 2000 / 2022 when the population of Ferrum, Virginia was 1,313 / 1,729
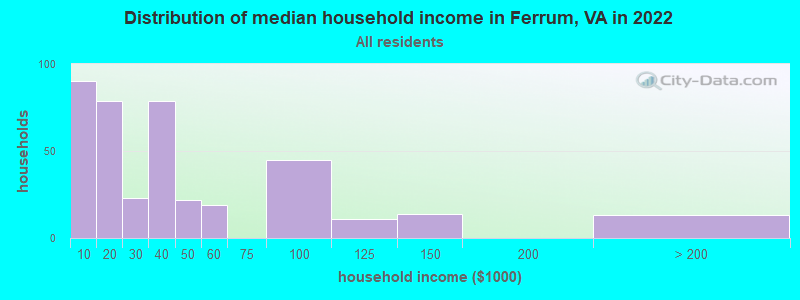
Income statistics for all residents
Median household income in Ferrum, VA in 2022:
Ferrum:
$33,431
Virginia:
$85,873
Change in median household income between 2000 and 2022:: -5.0%
Ferrum, Virginia:
-5.0%
State:
+84.0%
Number of households with income < $10k:
Ferrum:
22.8% (90)
State:
4.9% (165,315)
Number of households with income $10k - 20k:
Ferrum:
20.0% (79)
State:
5.9% (199,380)
Number of households with income $20k - 30k:
Ferrum:
5.8% (23)
State:
6.0% (202,243)
Number of households with income $30k - 40k:
Ferrum:
20.0% (79)
Virginia:
6.1% (205,967)
Number of households with income $40k - 50k:
Ferrum:
5.6% (22)
State:
6.4% (215,648)
Number of households with income $50k - 60k:
Ferrum:
4.8% (19)
Virginia:
6.2% (210,516)
Number of households with income $60k - 75k:
Ferrum:
0.0% (0)
State:
8.6% (292,112)
Number of households with income $75k - 100k:
Ferrum:
11.4% (45)
State:
12.2% (412,198)
Number of households with income $100k - 125k:
Ferrum:
2.8% (11)
Virginia:
10.3% (348,998)
Number of households with income $125k - 150k:
Ferrum:
3.5% (14)
State:
7.7% (261,236)
Number of households with income $150k - 200k:
Ferrum:
0.0% (0)
Virginia:
10.3% (347,282)
Number of households with income > $200k:
Ferrum:
3.3% (13)
State:
15.4% (519,712)
Aggregate household income in Ferrum in 2022: $17,515,563
Median family income in Ferrum in 2022:
Ferrum:
$46,943
Virginia:
$107,101
Number of families with income $10k - 20k:
Ferrum:
31.7% (68)
State:
3.3% (71,807)
Number of families with income $30k - 40k:
Ferrum:
10.5% (22)
Virginia:
4.7% (103,002)
Number of families with income $40k - 50k:
Ferrum:
10.3% (22)
State:
5.4% (118,579)
Number of families with income $50k - 60k:
Ferrum:
8.8% (19)
State:
5.5% (120,924)
Number of families with income $75k - 100k:
Ferrum:
20.8% (45)
State:
12.6% (277,221)
Number of families with income $100k - 125k:
Ferrum:
5.2% (11)
State:
11.3% (248,485)
Number of families with income $125k - 150k:
Ferrum:
6.6% (14)
Virginia:
9.0% (197,999)
Number of families with income > $200k:
Ferrum:
6.1% (13)
State:
20.3% (445,515)
Median per capita income in Ferrum in 2022:
Ferrum:
$13,147
State:
$47,199
Change in median per capita income between 2000 and 2022:
Ferrum, Virginia:
+7.1%
State:
+96.9%
Income statistics for White residents
Median household income in Ferrum, VA in 2022:
Ferrum:
$32,154
State:
$91,924
Change in median household income between 2000 and 2022:: -11.3%
Ferrum, Virginia:
-11.3%
Virginia:
+81.9%
Number of households with income < $10k:
Ferrum:
24.5% (68)
State:
4.1% (90,549)
Number of households with income $10k - 20k:
Ferrum:
27.0% (75)
State:
5.2% (114,324)
Number of households with income $20k - 30k:
Ferrum:
0.0% (0)
State:
5.7% (125,676)
Number of households with income $30k - 40k:
Ferrum:
11.5% (32)
State:
5.5% (121,220)
Number of households with income $40k - 50k:
Ferrum:
7.9% (22)
State:
6.0% (133,011)
Number of households with income $50k - 60k:
Ferrum:
0.0% (0)
Virginia:
6.2% (136,856)
Number of households with income $60k - 75k:
Ferrum:
0.0% (0)
State:
8.4% (186,094)
Number of households with income $75k - 100k:
Ferrum:
15.8% (44)
State:
12.5% (277,077)
Number of households with income $100k - 125k:
Ferrum:
4.0% (11)
State:
10.8% (237,562)
Number of households with income $125k - 150k:
Ferrum:
5.0% (14)
Virginia:
8.0% (177,532)
Number of households with income $150k - 200k:
Ferrum:
0.0% (0)
Virginia:
11.0% (242,106)
Number of households with income > $200k:
Ferrum:
4.3% (12)
State:
16.6% (366,064)
Aggregate household income in Ferrum in 2022: $13,556,579
Median non-family income in Ferrum in 2022:
Ferrum:
$2,407
State:
$53,785
Change in median non-family income between 2000 and 2022:: -90.4%
Ferrum, Virginia:
-90.4%
Virginia:
+70.5%
Median per capita income in Ferrum in 2022:
Ferrum:
$15,092
Virginia:
$53,456
Change in median per capita income between 2000 and 2022:
Ferrum, Virginia:
+14.1%
Virginia:
+99.2%
Income statistics for Black or African American residents
Median household income in Ferrum, VA in 2022:
Ferrum:
$38,149
State:
$60,526
Change in median household income between 2000 and 2022:
Ferrum, Virginia:
+95.6%
Virginia:
+87.6%
Number of households with income < $10k:
Ferrum:
19.8% (21)
State:
8.3% (52,649)
Number of households with income $10k - 20k:
Ferrum:
2.8% (3)
State:
9.6% (60,583)
Number of households with income $20k - 30k:
Ferrum:
22.6% (24)
State:
8.1% (51,220)
Number of households with income $30k - 40k:
Ferrum:
42.5% (45)
State:
8.6% (54,185)
Number of households with income $40k - 50k:
Ferrum:
0.0% (0)
Virginia:
8.1% (51,156)
Number of households with income $50k - 60k:
Ferrum:
12.3% (13)
State:
7.0% (44,637)
Number of households with income $60k - 75k:
Ferrum:
0.0% (0)
State:
9.8% (62,332)
Number of households with income $75k - 100k:
Ferrum:
0.0% (0)
Virginia:
11.4% (72,479)
Number of households with income $100k - 125k:
Ferrum:
0.0% (0)
State:
8.5% (53,997)
Number of households with income $125k - 150k:
Ferrum:
0.0% (0)
Virginia:
6.3% (40,032)
Number of households with income $150k - 200k:
Ferrum:
0.0% (0)
State:
6.9% (43,513)
Number of households with income > $200k:
Ferrum:
0.0% (0)
Virginia:
7.4% (46,851)
Aggregate household income in Ferrum in 2022: $3,101,073
Median per capita income in Ferrum in 2022:
Ferrum:
$10,258
Virginia:
$34,599
Change in median per capita income between 2000 and 2022:
Ferrum, Virginia:
+4.3%
State:
+119.8%
Income statistics for Hispanic or Latino residents
Median per capita income in Ferrum in 2022:
Ferrum:
$4,091
Virginia:
$32,277
Change in median per capita income between 2000 and 2022:
Ferrum, Virginia:
+32.5%
State:
+104.6%
Income statistics for Multirace residents
Median per capita income in Ferrum in 2022:
Ferrum:
$3,714
State:
$34,385
Change in median per capita income between 2000 and 2022:
Ferrum, Virginia:
+89.7%
State:
+130.2%
Income statistics for other residents
Median per capita income in Ferrum in 2022:
Ferrum:
$3,971
Virginia:
$29,023
Change in median per capita income between 2000 and 2022:
Ferrum, Virginia:
+15.8%
State:
+110.3%
Discuss Ferrum, Virginia (VA) on our hugely popular Virginia forum.