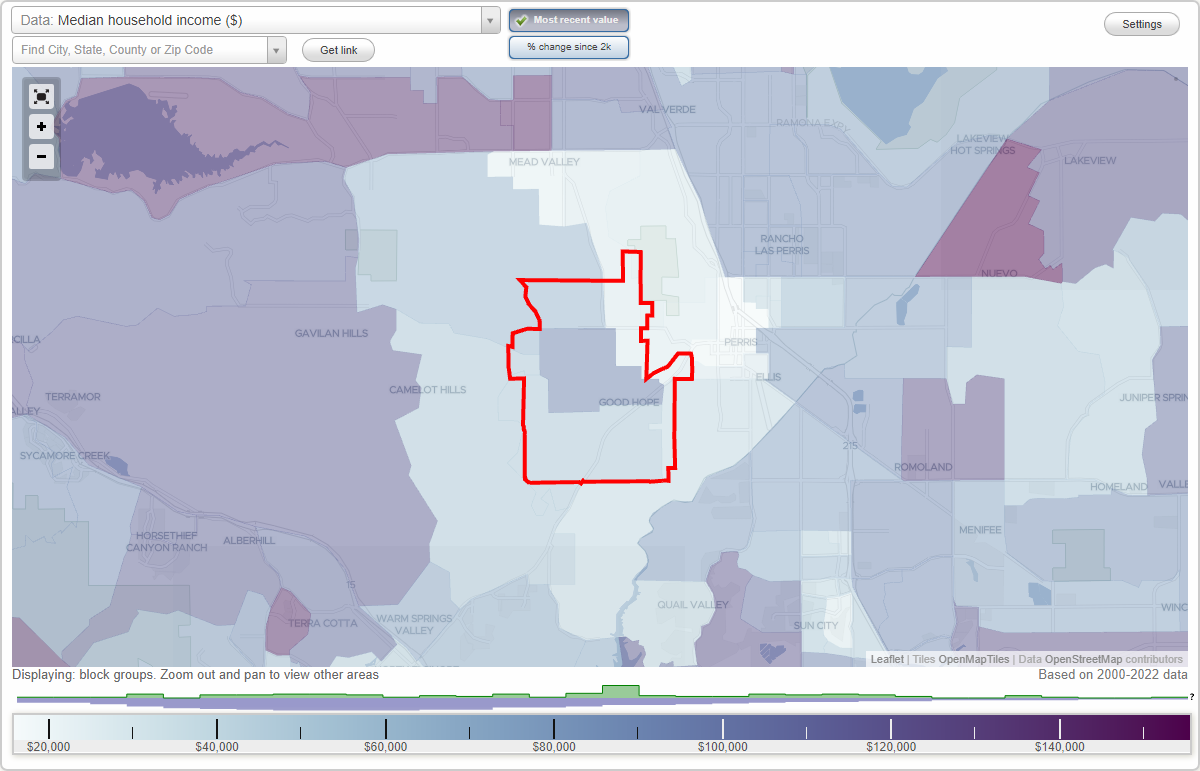
The median household income in Good Hope, CA in 2022 was $55,365, which was 65.4% less than the median annual income of $91,551 across the entire state of California. Compared to the median income of $42,887 in 2000 this represents an increase of 22.5%. The per capita income in 2022 was $17,716, which means a decrease of 5.5% compared to 2000 when it was $18,689.
Whole page based on the data from 2000 / 2022 when the population of Good Hope, California was 9,192 / 8,443
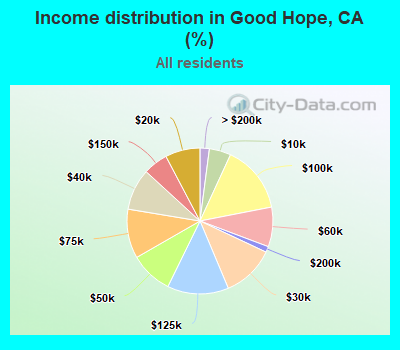
Income statistics for all residents
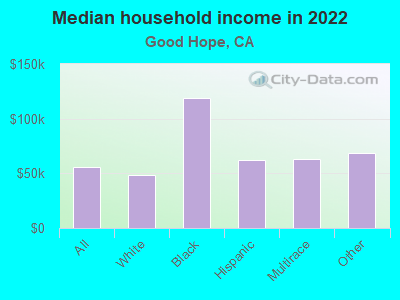
Median household income in Good Hope, CA in 2022:
Good Hope:
$55,366
State:
$91,551
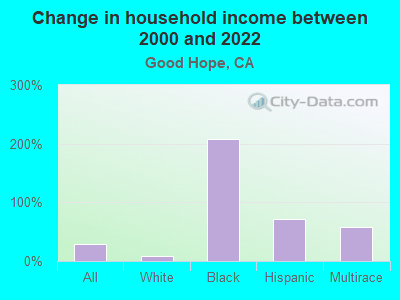
Change in median household income between 2000 and 2022:
Good Hope, California:
+29.1%
California:
+92.8%
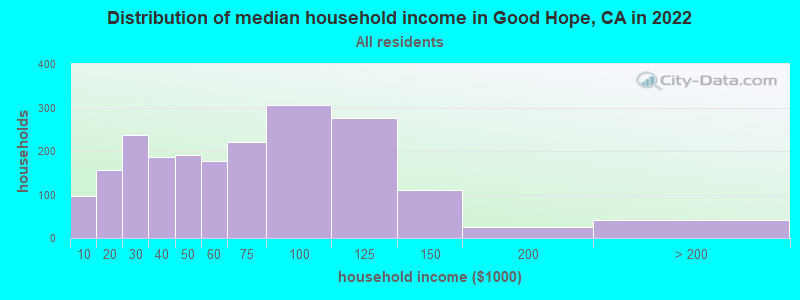
Number of households with income < $10k:
Good Hope:
4.8% (97)
State:
4.8% (654,370)
Number of households with income $10k - 20k:
Good Hope:
7.7% (156)
State:
5.8% (789,493)
Number of households with income $20k - 30k:
Good Hope:
11.7% (236)
State:
5.7% (778,318)
Number of households with income $30k - 40k:
Good Hope:
9.2% (186)
State:
5.8% (783,170)
Number of households with income $40k - 50k:
Good Hope:
9.4% (191)
State:
5.8% (781,352)
Number of households with income $50k - 60k:
Good Hope:
8.8% (178)
California:
5.6% (760,175)
Number of households with income $60k - 75k:
Good Hope:
10.9% (221)
State:
8.2% (1,104,699)
Number of households with income $75k - 100k:
Good Hope:
15.1% (305)
California:
12.0% (1,627,633)
Number of households with income $100k - 125k:
Good Hope:
13.6% (275)
State:
10.0% (1,358,619)
Number of households with income $125k - 150k:
Good Hope:
5.5% (111)
State:
7.6% (1,027,455)
Number of households with income $150k - 200k:
Good Hope:
1.3% (26)
State:
10.6% (1,439,811)
Number of households with income > $200k:
Good Hope:
2.1% (42)
State:
18.0% (2,445,491)
Aggregate household income in Good Hope in 2022: $133,898,814
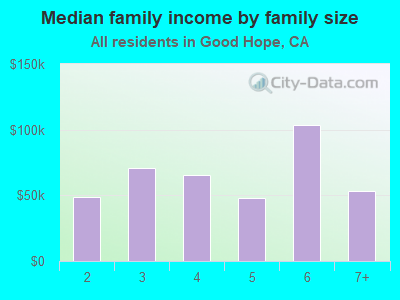
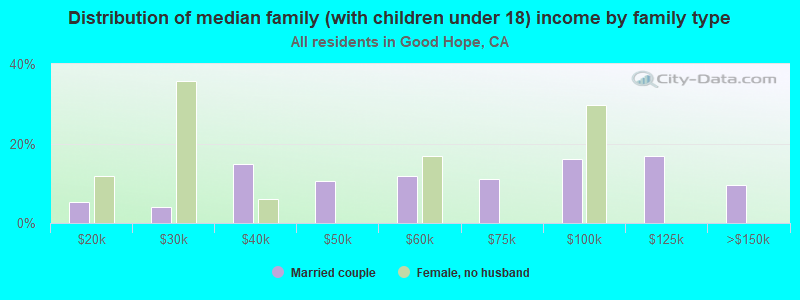
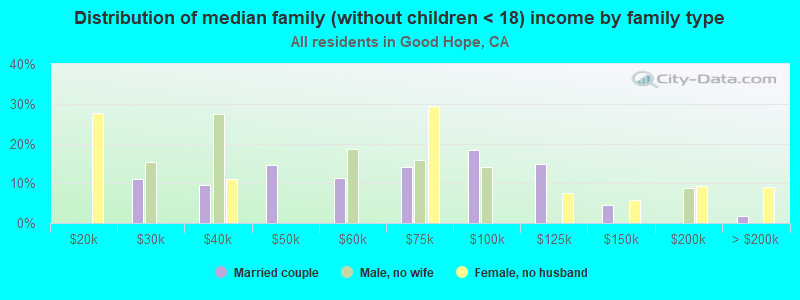
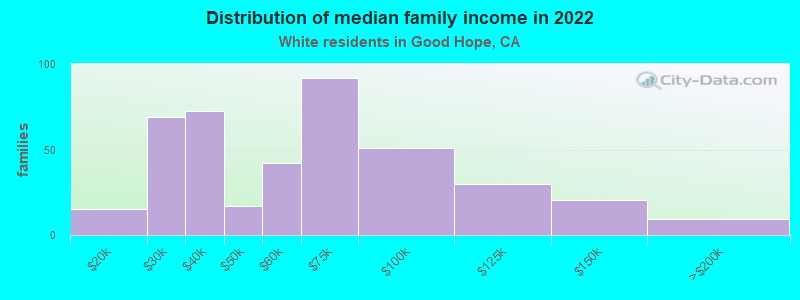
Median family income in Good Hope in 2022:
Good Hope:
$60,081
State:
$104,823
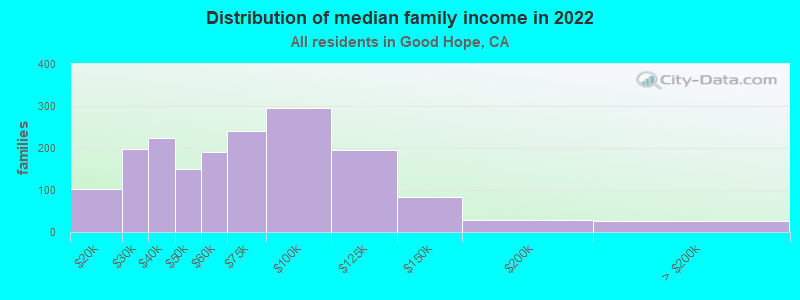
Number of families with income $10k - 20k:
Good Hope:
5.9% (102)
California:
3.5% (322,064)
Number of families with income $20k - 30k:
Good Hope:
11.4% (197)
California:
4.7% (433,722)
Number of families with income $30k - 40k:
Good Hope:
12.9% (224)
State:
5.2% (478,213)
Number of families with income $40k - 50k:
Good Hope:
8.7% (151)
State:
5.6% (511,647)
Number of families with income $50k - 60k:
Good Hope:
11.0% (190)
California:
5.5% (498,926)
Number of families with income $60k - 75k:
Good Hope:
13.8% (240)
California:
8.0% (731,094)
Number of families with income $75k - 100k:
Good Hope:
17.1% (296)
State:
12.2% (1,115,621)
Number of families with income $100k - 125k:
Good Hope:
11.3% (196)
California:
10.5% (959,600)
Number of families with income $125k - 150k:
Good Hope:
4.8% (83)
State:
8.4% (768,725)
Number of families with income $150k - 200k:
Good Hope:
1.7% (29)
State:
11.9% (1,087,239)
Number of families with income > $200k:
Good Hope:
1.5% (26)
State:
21.5% (1,963,769)
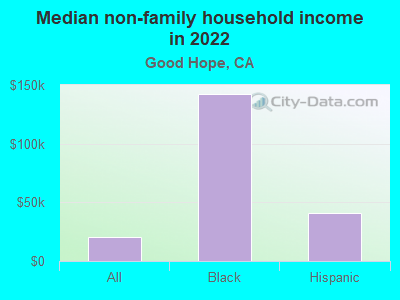
Median non-family income in Good Hope in 2022:
Good Hope:
$20,845
California:
$59,348
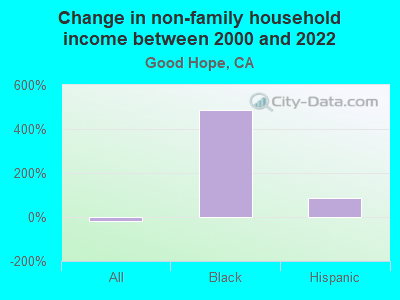
Change in median non-family income between 2000 and 2022:: -17.3%
Good Hope, California:
-17.3%
California:
+85.3%
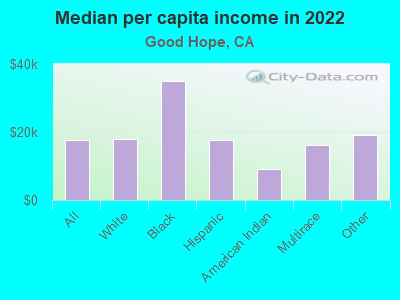
Median per capita income in Good Hope in 2022:
Good Hope:
$17,717
State:
$46,661
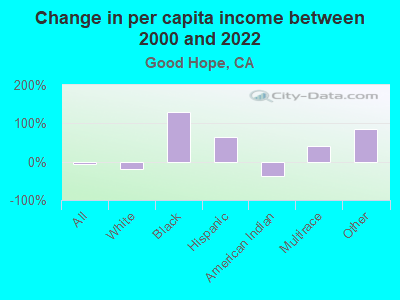
Change in median per capita income between 2000 and 2022:: -5.2%
Good Hope, California:
-5.2%
State:
+105.5%
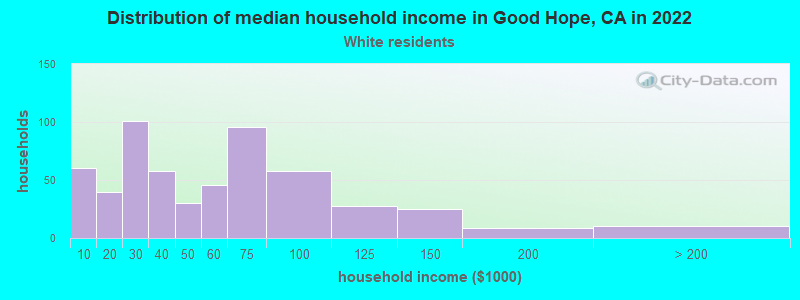
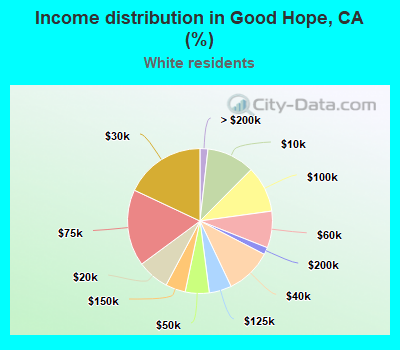
Income statistics for White residents
Median household income in Good Hope, CA in 2022:
Good Hope:
$48,426
State:
$100,917
Change in median household income between 2000 and 2022:
Good Hope, California:
+7.7%
State:
+96.8%
Number of households with income < $10k:
Good Hope:
10.7% (60)
State:
4.4% (284,109)
Number of households with income $10k - 20k:
Good Hope:
7.1% (40)
California:
5.3% (340,330)
Number of households with income $20k - 30k:
Good Hope:
18.0% (101)
State:
5.3% (343,145)
Number of households with income $30k - 40k:
Good Hope:
10.3% (58)
State:
5.1% (330,146)
Number of households with income $40k - 50k:
Good Hope:
5.3% (30)
State:
5.2% (335,310)
Number of households with income $50k - 60k:
Good Hope:
8.2% (46)
California:
5.1% (326,299)
Number of households with income $60k - 75k:
Good Hope:
17.1% (96)
State:
7.6% (487,640)
Number of households with income $75k - 100k:
Good Hope:
10.3% (58)
State:
11.5% (736,578)
Number of households with income $100k - 125k:
Good Hope:
5.0% (28)
State:
10.1% (648,782)
Number of households with income $125k - 150k:
Good Hope:
4.5% (25)
California:
7.8% (499,671)
Number of households with income $150k - 200k:
Good Hope:
1.6% (9)
State:
11.4% (729,603)
Number of households with income > $200k:
Good Hope:
1.8% (10)
State:
21.2% (1,364,246)
Aggregate household income in Good Hope in 2022: $30,850,354
Median family income in Good Hope in 2022:
Good Hope:
$53,647
State:
$125,379
Number of families with income $10k - 20k:
Good Hope:
3.6% (15)
California:
2.5% (97,716)
Number of families with income $20k - 30k:
Good Hope:
16.6% (69)
State:
3.5% (137,295)
Number of families with income $30k - 40k:
Good Hope:
17.3% (72)
State:
3.9% (152,947)
Number of families with income $40k - 50k:
Good Hope:
4.1% (17)
State:
4.3% (169,197)
Number of families with income $50k - 60k:
Good Hope:
10.1% (42)
California:
4.5% (176,192)
Number of families with income $60k - 75k:
Good Hope:
21.9% (92)
California:
7.0% (274,752)
Number of families with income $75k - 100k:
Good Hope:
12.2% (51)
State:
11.3% (445,632)
Number of families with income $100k - 125k:
Good Hope:
7.2% (30)
State:
10.7% (423,630)
Number of families with income $125k - 150k:
Good Hope:
5.0% (21)
State:
9.1% (357,408)
Number of families with income $150k - 200k:
Good Hope:
2.2% (9)
State:
13.5% (532,693)
Median per capita income in Good Hope in 2022:
Good Hope:
$17,939
State:
$61,706
Change in median per capita income between 2000 and 2022:: -18.5%
Good Hope, California:
-18.5%
State:
+122.7%
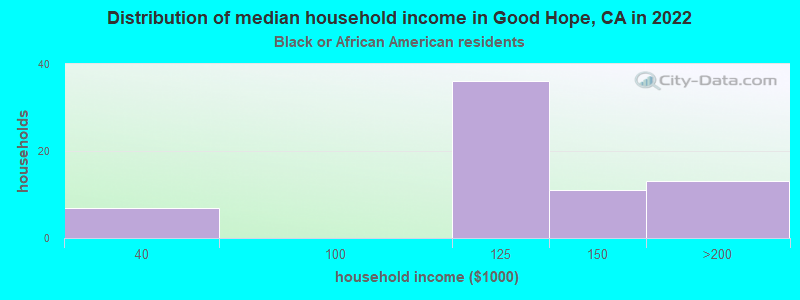
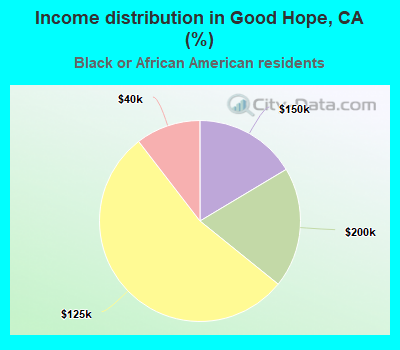
Income statistics for Black or African American residents
Median household income in Good Hope, CA in 2022:
Good Hope:
$119,090
California:
$63,268
Number of households with income < $10k:
Good Hope:
0.0% (0)
California:
9.0% (73,219)
Number of households with income $10k - 20k:
Good Hope:
0.0% (0)
State:
10.6% (86,666)
Number of households with income $20k - 30k:
Good Hope:
0.0% (0)
State:
7.1% (57,719)
Number of households with income $30k - 40k:
Good Hope:
10.4% (7)
State:
7.2% (58,714)
Number of households with income $40k - 50k:
Good Hope:
0.0% (0)
State:
7.1% (58,075)
Number of households with income $50k - 60k:
Good Hope:
0.0% (0)
State:
6.8% (55,229)
Number of households with income $60k - 75k:
Good Hope:
0.0% (0)
California:
8.8% (71,895)
Number of households with income $75k - 100k:
Good Hope:
0.0% (0)
California:
11.9% (96,893)
Number of households with income $100k - 125k:
Good Hope:
53.7% (36)
State:
8.7% (70,729)
Number of households with income $125k - 150k:
Good Hope:
16.4% (11)
California:
6.3% (51,211)
Number of households with income $150k - 200k:
Good Hope:
19.4% (13)
State:
7.2% (58,687)
Number of households with income > $200k:
Good Hope:
0.0% (0)
California:
9.3% (75,487)
Aggregate household income in Good Hope in 2022: $7,632,295
Median non-family income in Good Hope in 2022:
Good Hope:
$142,596
State:
$41,942
Median per capita income in Good Hope in 2022:
Good Hope:
$35,049
State:
$36,708
Change in median per capita income between 2000 and 2022:
Good Hope, California:
+129.1%
State:
+110.4%
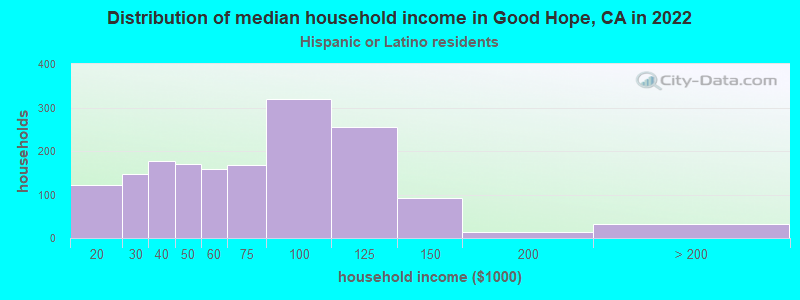
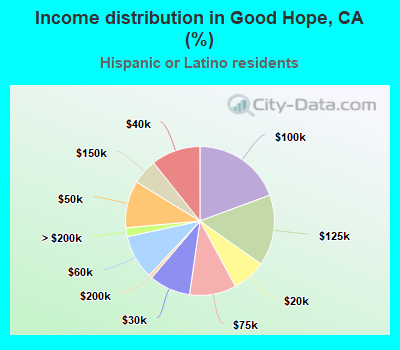
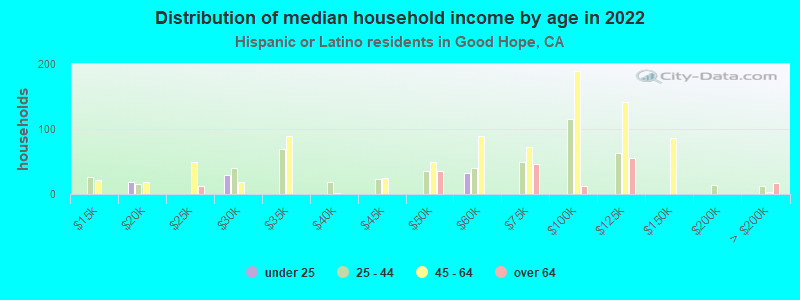
Income statistics for Hispanic or Latino residents
Median household income in Good Hope, CA in 2022:
Good Hope:
$62,624
State:
$75,698
Change in median household income between 2000 and 2022:
Good Hope, California:
+71.7%
State:
+107.2%
Number of households with income < $10k:
Good Hope:
0.0% (0)
California:
4.3% (183,294)
Number of households with income $10k - 20k:
Good Hope:
7.3% (121)
State:
6.0% (253,903)
Number of households with income $20k - 30k:
Good Hope:
9.0% (148)
California:
6.8% (286,386)
Number of households with income $30k - 40k:
Good Hope:
10.7% (177)
State:
7.4% (313,728)
Number of households with income $40k - 50k:
Good Hope:
10.2% (169)
State:
7.4% (313,199)
Number of households with income $50k - 60k:
Good Hope:
9.6% (159)
California:
7.2% (305,366)
Number of households with income $60k - 75k:
Good Hope:
10.2% (168)
State:
10.3% (434,937)
Number of households with income $75k - 100k:
Good Hope:
19.4% (320)
California:
14.4% (607,302)
Number of households with income $100k - 125k:
Good Hope:
15.4% (255)
State:
10.6% (447,424)
Number of households with income $125k - 150k:
Good Hope:
5.5% (91)
California:
7.5% (316,022)
Number of households with income $150k - 200k:
Good Hope:
0.8% (13)
State:
9.2% (386,269)
Number of households with income > $200k:
Good Hope:
1.9% (32)
State:
8.8% (372,651)
Aggregate household income in Good Hope in 2022: $121,678,152
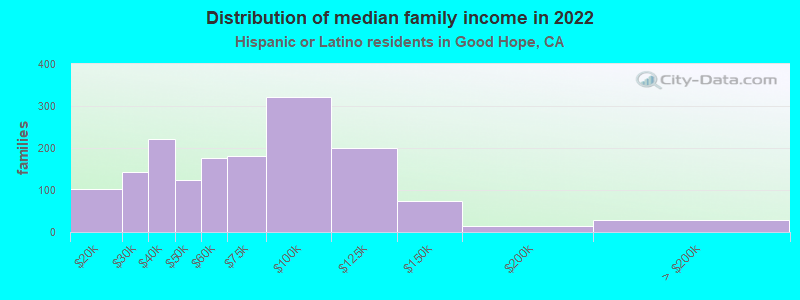
Median family income in Good Hope in 2022:
Good Hope:
$63,277
State:
$77,589
Number of families with income $10k - 20k:
Good Hope:
6.5% (102)
California:
4.6% (151,997)
Number of families with income $20k - 30k:
Good Hope:
9.1% (144)
State:
6.6% (216,764)
Number of families with income $30k - 40k:
Good Hope:
13.9% (221)
California:
7.6% (249,849)
Number of families with income $40k - 50k:
Good Hope:
7.9% (125)
State:
7.7% (254,822)
Number of families with income $50k - 60k:
Good Hope:
11.1% (176)
California:
7.4% (244,815)
Number of families with income $60k - 75k:
Good Hope:
11.4% (180)
California:
10.5% (345,838)
Number of families with income $75k - 100k:
Good Hope:
20.2% (321)
State:
14.9% (491,589)
Number of families with income $100k - 125k:
Good Hope:
12.6% (199)
State:
10.7% (355,400)
Number of families with income $125k - 150k:
Good Hope:
4.6% (73)
State:
7.8% (259,317)
Number of families with income $150k - 200k:
Good Hope:
1.0% (15)
State:
9.3% (306,566)
Number of families with income > $200k:
Good Hope:
1.8% (28)
California:
9.1% (299,984)
Median non-family income in Good Hope in 2022:
Good Hope:
$41,079
State:
$49,746
Change in median non-family income between 2000 and 2022:
Good Hope, California:
+85.6%
California:
+100.7%
Median per capita income in Good Hope in 2022:
Good Hope:
$17,588
State:
$27,240
Change in median per capita income between 2000 and 2022:
Good Hope, California:
+64.1%
State:
+133.3%
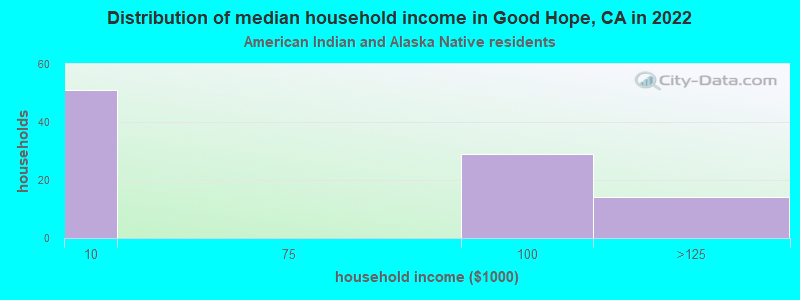
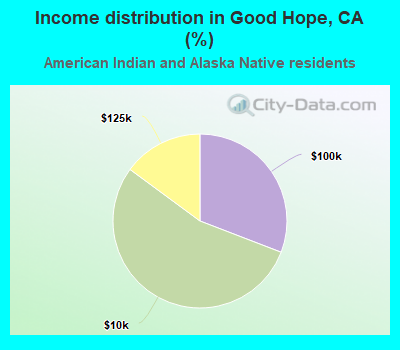
Income statistics for American Indian and Alaska Native residents
Number of households with income < $10k:
Good Hope:
54.3% (51)
State:
5.4% (8,471)
Number of households with income $10k - 20k:
Good Hope:
0.0% (0)
State:
6.0% (9,381)
Number of households with income $20k - 30k:
Good Hope:
0.0% (0)
California:
5.5% (8,668)
Number of households with income $30k - 40k:
Good Hope:
0.0% (0)
State:
8.3% (13,030)
Number of households with income $40k - 50k:
Good Hope:
0.0% (0)
California:
6.9% (10,908)
Number of households with income $50k - 60k:
Good Hope:
0.0% (0)
State:
7.1% (11,198)
Number of households with income $60k - 75k:
Good Hope:
0.0% (0)
California:
9.6% (15,190)
Number of households with income $75k - 100k:
Good Hope:
30.9% (29)
State:
14.1% (22,274)
Number of households with income $100k - 125k:
Good Hope:
14.9% (14)
State:
11.2% (17,643)
Number of households with income $125k - 150k:
Good Hope:
0.0% (0)
State:
8.3% (13,117)
Number of households with income $150k - 200k:
Good Hope:
0.0% (0)
State:
8.8% (13,853)
Number of households with income > $200k:
Good Hope:
0.0% (0)
State:
8.8% (13,925)
Aggregate household income in Good Hope in 2022: $3,631,768
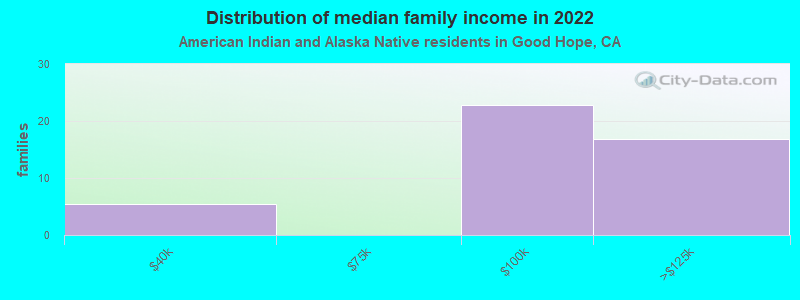
Median family income in Good Hope in 2022:
Good Hope:
$76,708
State:
$81,108
Number of families with income $30k - 40k:
Good Hope:
11.9% (5)
State:
8.8% (9,994)
Number of families with income $75k - 100k:
Good Hope:
50.7% (23)
State:
14.8% (16,731)
Number of families with income $100k - 125k:
Good Hope:
37.4% (17)
California:
12.0% (13,609)
Median per capita income in Good Hope in 2022:
Good Hope:
$9,197
California:
$30,289
Change in median per capita income between 2000 and 2022:: -37.0%
Good Hope, California:
-37.0%
State:
+98.9%
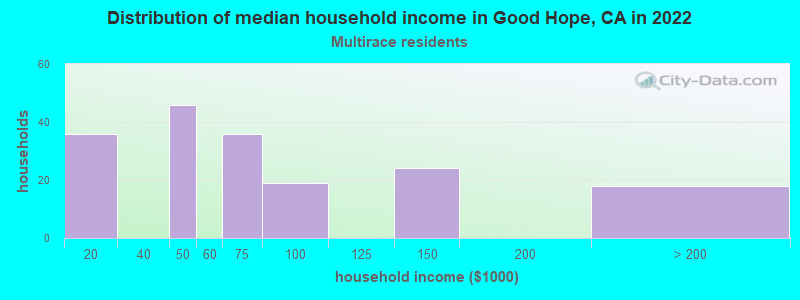
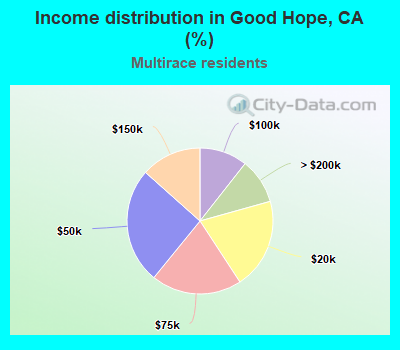
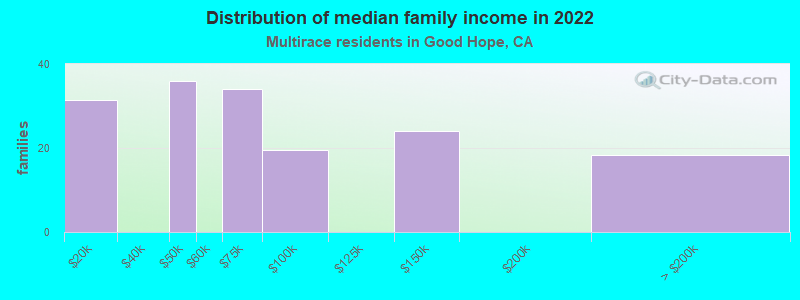
Income statistics for Multirace residents
Median household income in Good Hope, CA in 2022:
Good Hope:
$62,912
California:
$83,153
Change in median household income between 2000 and 2022:
Good Hope, California:
+58.4%
State:
+106.0%
Number of households with income < $10k:
Good Hope:
0.0% (0)
State:
4.2% (85,299)
Number of households with income $10k - 20k:
Good Hope:
20.1% (36)
State:
6.1% (122,966)
Number of households with income $20k - 30k:
Good Hope:
0.0% (0)
State:
6.4% (129,328)
Number of households with income $30k - 40k:
Good Hope:
0.0% (0)
California:
6.4% (130,070)
Number of households with income $40k - 50k:
Good Hope:
25.7% (46)
State:
6.5% (131,254)
Number of households with income $50k - 60k:
Good Hope:
0.0% (0)
State:
6.5% (132,382)
Number of households with income $60k - 75k:
Good Hope:
20.1% (36)
State:
9.4% (191,472)
Number of households with income $75k - 100k:
Good Hope:
10.6% (19)
State:
13.3% (269,691)
Number of households with income $100k - 125k:
Good Hope:
0.0% (0)
California:
10.2% (207,286)
Number of households with income $125k - 150k:
Good Hope:
13.4% (24)
California:
7.8% (158,259)
Number of households with income $150k - 200k:
Good Hope:
0.0% (0)
California:
10.3% (209,227)
Number of households with income > $200k:
Good Hope:
10.1% (18)
State:
13.0% (263,210)
Aggregate household income in Good Hope in 2022: $16,010,092
Median family income in Good Hope in 2022:
Good Hope:
$64,266
State:
$87,642
Number of families with income $10k - 20k:
Good Hope:
19.2% (31)
California:
4.1% (60,419)
Number of families with income $40k - 50k:
Good Hope:
22.1% (36)
State:
6.8% (100,085)
Number of families with income $60k - 75k:
Good Hope:
20.9% (34)
California:
9.5% (140,131)
Number of families with income $75k - 100k:
Good Hope:
12.0% (20)
California:
13.8% (203,439)
Number of families with income $125k - 150k:
Good Hope:
14.7% (24)
California:
8.4% (124,115)
Number of families with income > $200k:
Good Hope:
11.2% (18)
State:
14.0% (207,317)
Median per capita income in Good Hope in 2022:
Good Hope:
$16,132
State:
$32,124
Change in median per capita income between 2000 and 2022:
Good Hope, California:
+40.8%
State:
+120.4%
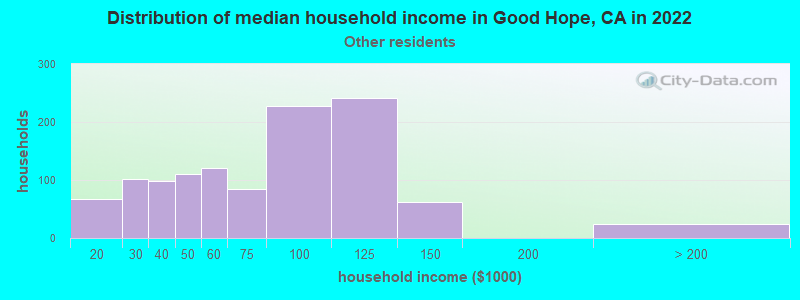
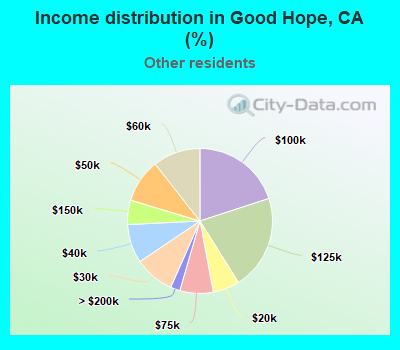
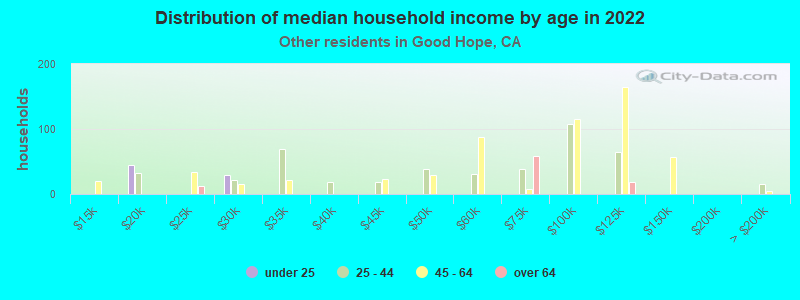
Income statistics for other residents
Median household income in Good Hope, CA in 2022:
Good Hope:
$68,491
California:
$71,383
Number of households with income < $10k:
Good Hope:
0.0% (0)
State:
4.6% (93,035)
Number of households with income $10k - 20k:
Good Hope:
6.0% (68)
State:
6.3% (126,222)
Number of households with income $20k - 30k:
Good Hope:
8.9% (102)
State:
7.1% (142,656)
Number of households with income $30k - 40k:
Good Hope:
8.7% (99)
State:
8.2% (165,018)
Number of households with income $40k - 50k:
Good Hope:
9.7% (111)
California:
8.0% (161,732)
Number of households with income $50k - 60k:
Good Hope:
10.6% (121)
State:
7.6% (152,152)
Number of households with income $60k - 75k:
Good Hope:
7.4% (85)
California:
10.4% (209,951)
Number of households with income $75k - 100k:
Good Hope:
20.0% (228)
California:
14.7% (296,102)
Number of households with income $100k - 125k:
Good Hope:
21.1% (241)
California:
10.7% (214,281)
Number of households with income $125k - 150k:
Good Hope:
5.4% (62)
State:
7.1% (143,092)
Number of households with income $150k - 200k:
Good Hope:
0.0% (0)
State:
8.6% (172,215)
Number of households with income > $200k:
Good Hope:
2.1% (24)
California:
6.7% (134,102)
Aggregate household income in Good Hope in 2022: $91,274,448
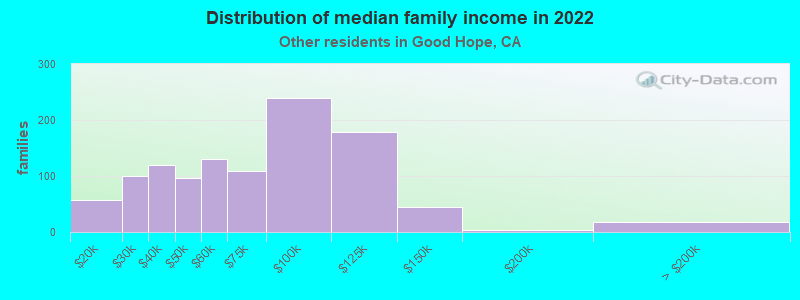
Median family income in Good Hope in 2022:
Good Hope:
$66,618
California:
$72,756
Number of families with income $10k - 20k:
Good Hope:
5.3% (58)
State:
5.1% (82,116)
Number of families with income $20k - 30k:
Good Hope:
9.1% (100)
State:
7.0% (112,854)
Number of families with income $30k - 40k:
Good Hope:
10.8% (119)
California:
8.4% (135,938)
Number of families with income $40k - 50k:
Good Hope:
8.8% (96)
State:
8.4% (135,353)
Number of families with income $50k - 60k:
Good Hope:
11.9% (131)
California:
7.7% (124,826)
Number of families with income $60k - 75k:
Good Hope:
10.0% (109)
California:
10.7% (173,628)
Number of families with income $75k - 100k:
Good Hope:
21.9% (240)
State:
15.2% (245,724)
Number of families with income $100k - 125k:
Good Hope:
16.3% (178)
State:
10.9% (176,716)
Number of families with income $125k - 150k:
Good Hope:
4.0% (44)
State:
7.4% (119,985)
Number of families with income $150k - 200k:
Good Hope:
0.3% (3)
State:
8.5% (137,332)
Number of families with income > $200k:
Good Hope:
1.7% (18)
State:
6.6% (106,346)
Median per capita income in Good Hope in 2022:
Good Hope:
$19,038
California:
$25,164
Change in median per capita income between 2000 and 2022:
Good Hope, California:
+84.3%
California:
+137.9%
Discuss Good Hope, California (CA) on our hugely popular California forum.