The median household income in Jordan Valley, OR in 2022 was $54,176, which was 39.6% less than the median annual income of $75,657 across the entire state of Oregon. Compared to the median income of $25,313 in 2000 this represents an increase of 53.3%. The per capita income in 2022 was $25,431, which means an increase of 43.0% compared to 2000 when it was $14,501.
Whole page based on the data from 2000 / 2022 when the population of Jordan Valley, Oregon was 239 / 164
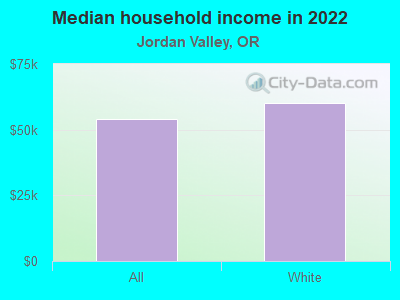
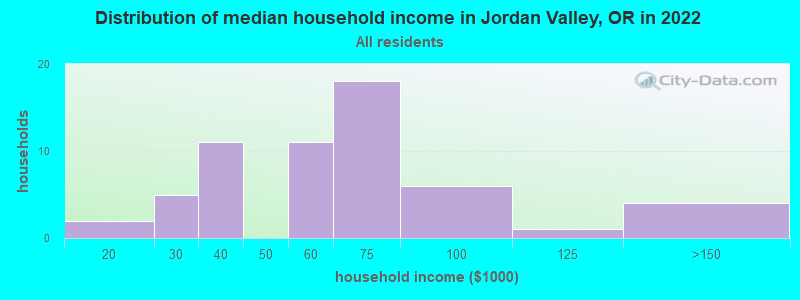
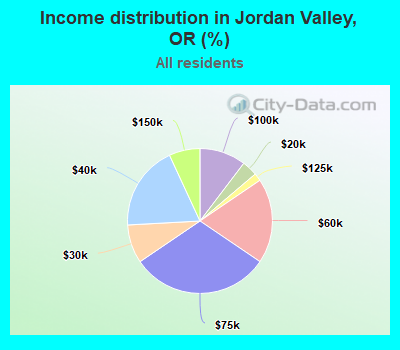
Income statistics for all residents
Median household income in Jordan Valley, OR in 2022:
Jordan Valley:
$54,177
Oregon:
$75,657
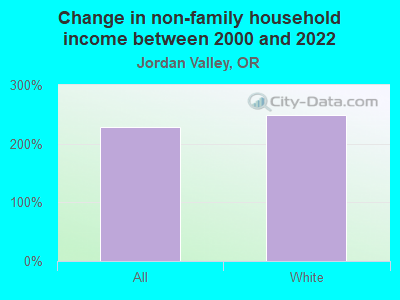
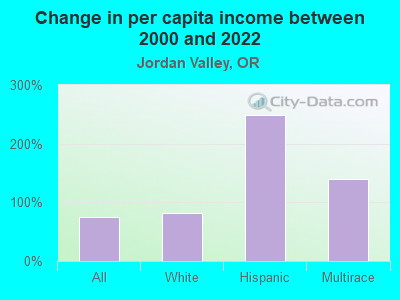
Change in median household income between 2000 and 2022:
Jordan Valley, Oregon:
+114.0%
State:
+84.9%
Number of households with income < $10k:
Jordan Valley:
0.0% (0)
Oregon:
5.1% (87,297)
Number of households with income $10k - 20k:
Jordan Valley:
3.4% (2)
State:
6.7% (115,299)
Number of households with income $20k - 30k:
Jordan Valley:
8.6% (5)
State:
6.9% (119,114)
Number of households with income $30k - 40k:
Jordan Valley:
19.0% (11)
Oregon:
7.1% (122,333)
Number of households with income $40k - 50k:
Jordan Valley:
0.0% (0)
Oregon:
7.2% (124,562)
Number of households with income $50k - 60k:
Jordan Valley:
19.0% (11)
State:
6.9% (118,435)
Number of households with income $60k - 75k:
Jordan Valley:
31.0% (18)
State:
9.8% (168,926)
Number of households with income $75k - 100k:
Jordan Valley:
10.3% (6)
Oregon:
13.3% (229,104)
Number of households with income $100k - 125k:
Jordan Valley:
1.7% (1)
Oregon:
10.5% (181,787)
Number of households with income $125k - 150k:
Jordan Valley:
6.9% (4)
State:
7.4% (127,392)
Number of households with income $150k - 200k:
Jordan Valley:
0.0% (0)
State:
8.6% (148,614)
Number of households with income > $200k:
Jordan Valley:
0.0% (0)
State:
10.6% (183,477)
Aggregate household income in Jordan Valley in 2022: $3,445,335
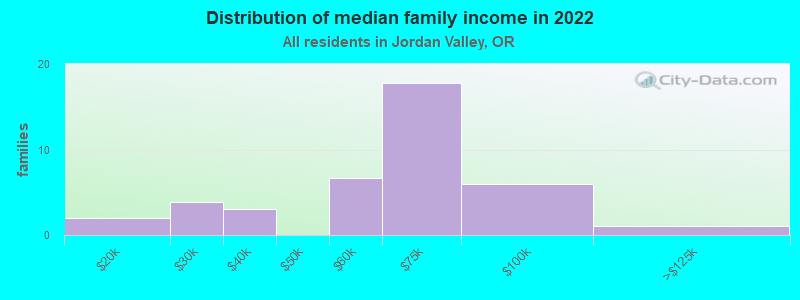
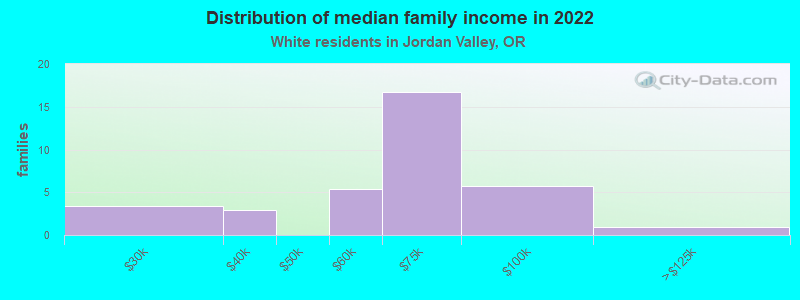
Median family income in Jordan Valley in 2022:
Jordan Valley:
$63,146
State:
$93,384
Number of families with income $10k - 20k:
Jordan Valley:
4.9% (2)
State:
3.0% (31,605)
Number of families with income $20k - 30k:
Jordan Valley:
9.6% (4)
State:
4.5% (47,306)
Number of families with income $30k - 40k:
Jordan Valley:
7.5% (3)
State:
5.8% (60,772)
Number of families with income $50k - 60k:
Jordan Valley:
16.4% (7)
State:
6.1% (63,915)
Number of families with income $60k - 75k:
Jordan Valley:
44.3% (18)
Oregon:
9.9% (102,697)
Number of families with income $75k - 100k:
Jordan Valley:
14.7% (6)
State:
14.3% (148,745)
Number of families with income $100k - 125k:
Jordan Valley:
2.5% (1)
State:
12.4% (129,023)
Median income for 2 person families:
Jordan Valley:
$53,748
State:
$82,858
Median income for families with 0 earners:
Jordan Valley:
$0
State:
$57,093
Median income for families with 1 earner:
Jordan Valley:
$0
State:
$67,488
Median income for families with 2 earners:
Jordan Valley:
$66,511
State:
$119,094
Median income for families with 3+ earners:
Jordan Valley:
$0
Oregon:
$141,024
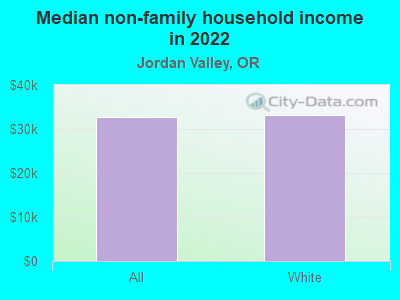
Median non-family income in Jordan Valley in 2022:
Jordan Valley:
$32,777
Oregon:
$48,114
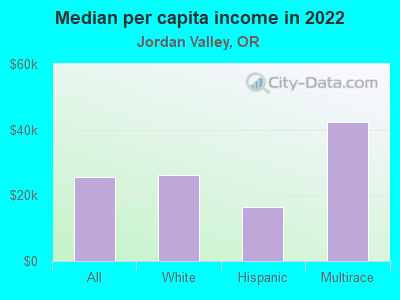
Median per capita income in Jordan Valley in 2022:
Jordan Valley:
$25,432
State:
$42,474
Change in median per capita income between 2000 and 2022:
Jordan Valley, Oregon:
+75.4%
State:
+102.8%
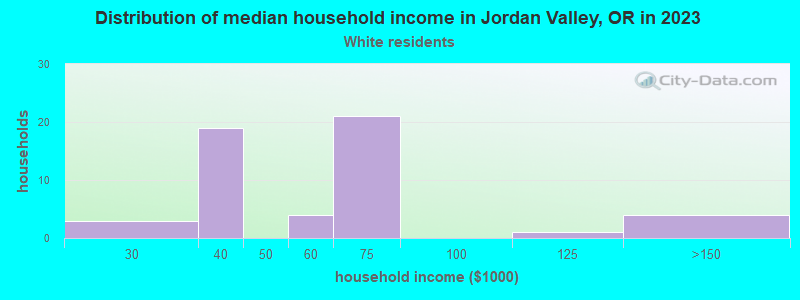
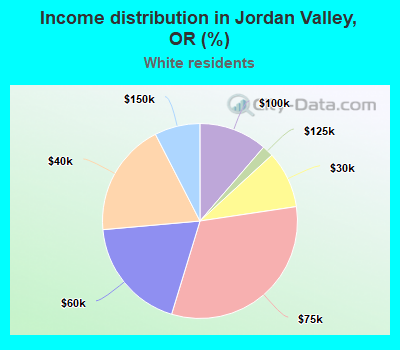
Income statistics for White residents
Median household income in Jordan Valley, OR in 2022:
Jordan Valley:
$60,015
State:
$76,846
Change in median household income between 2000 and 2022:
Jordan Valley, Oregon:
+140.1%
Oregon:
+84.8%
Number of households with income < $10k:
Jordan Valley:
0.0% (0)
State:
4.9% (67,757)
Number of households with income $10k - 20k:
Jordan Valley:
0.0% (0)
Oregon:
6.6% (91,229)
Number of households with income $20k - 30k:
Jordan Valley:
9.4% (5)
Oregon:
6.8% (93,981)
Number of households with income $30k - 40k:
Jordan Valley:
18.9% (10)
State:
6.9% (95,328)
Number of households with income $40k - 50k:
Jordan Valley:
0.0% (0)
State:
7.2% (100,221)
Number of households with income $50k - 60k:
Jordan Valley:
18.9% (10)
State:
6.9% (95,294)
Number of households with income $60k - 75k:
Jordan Valley:
32.1% (17)
State:
9.5% (132,178)
Number of households with income $75k - 100k:
Jordan Valley:
11.3% (6)
Oregon:
13.5% (187,105)
Number of households with income $100k - 125k:
Jordan Valley:
1.9% (1)
Oregon:
10.5% (145,264)
Number of households with income $125k - 150k:
Jordan Valley:
7.5% (4)
Oregon:
7.3% (101,755)
Number of households with income $150k - 200k:
Jordan Valley:
0.0% (0)
State:
8.7% (121,099)
Number of households with income > $200k:
Jordan Valley:
0.0% (0)
State:
11.1% (153,992)
Aggregate household income in Jordan Valley in 2022: $3,269,767
Median family income in Jordan Valley in 2022:
Jordan Valley:
$65,553
State:
$95,912
Number of families with income $20k - 30k:
Jordan Valley:
9.7% (3)
State:
4.1% (33,830)
Number of families with income $30k - 40k:
Jordan Valley:
8.3% (3)
State:
5.6% (46,508)
Number of families with income $50k - 60k:
Jordan Valley:
15.2% (5)
Oregon:
6.0% (49,589)
Number of families with income $60k - 75k:
Jordan Valley:
47.6% (17)
State:
9.4% (77,838)
Number of families with income $75k - 100k:
Jordan Valley:
16.4% (6)
Oregon:
14.7% (121,106)
Number of families with income $100k - 125k:
Jordan Valley:
2.7% (1)
Oregon:
12.3% (101,829)
Median non-family income in Jordan Valley in 2022:
Jordan Valley:
$33,145
Oregon:
$48,924
Median per capita income in Jordan Valley in 2022:
Jordan Valley:
$26,080
Oregon:
$45,669
Change in median per capita income between 2000 and 2022:
Jordan Valley, Oregon:
+82.1%
State:
+106.5%
Income statistics for Hispanic or Latino residents
Median per capita income in Jordan Valley in 2022:
Jordan Valley:
$16,403
State:
$25,274
Income statistics for Multirace residents
Aggregate household income in Jordan Valley in 2022: $1,989,373
Median per capita income in Jordan Valley in 2022:
Jordan Valley:
$42,323
Oregon:
$29,750
Change in median per capita income between 2000 and 2022:
Jordan Valley, Oregon:
+139.2%
Oregon:
+148.0%
Discuss Jordan Valley, Oregon (OR) on our hugely popular Oregon forum.