The median household income in Krebs, OK in 2022 was $44,499, which was 34.1% less than the median annual income of $59,673 across the entire state of Oklahoma. Compared to the median income of $24,514 in 2000 this represents an increase of 44.9%. The per capita income in 2022 was $23,202, which means an increase of 43.8% compared to 2000 when it was $13,042.
Whole page based on the data from 2000 / 2022 when the population of Krebs, Oklahoma was 2,051 / 2,019
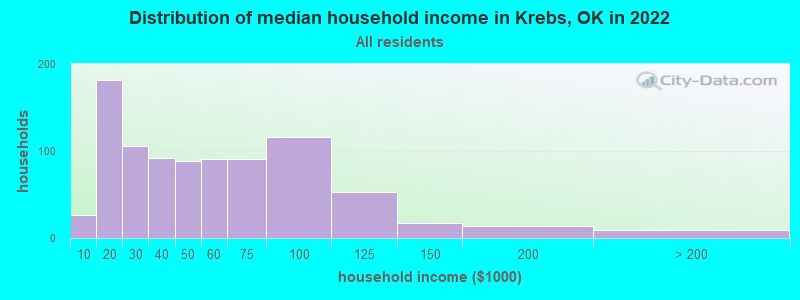
Income statistics for all residents
Median household income in Krebs, OK in 2022:
Krebs:
$44,500
State:
$59,673
Change in median household income between 2000 and 2022:
Krebs, Oklahoma:
+81.5%
Oklahoma:
+78.7%
Number of households with income < $10k:
Krebs:
2.9% (26)
State:
6.4% (100,950)
Number of households with income $10k - 20k:
Krebs:
20.6% (182)
Oklahoma:
8.8% (137,709)
Number of households with income $20k - 30k:
Krebs:
12.0% (106)
State:
9.1% (143,661)
Number of households with income $30k - 40k:
Krebs:
10.4% (92)
State:
9.0% (141,098)
Number of households with income $40k - 50k:
Krebs:
9.9% (88)
State:
8.9% (140,217)
Number of households with income $50k - 60k:
Krebs:
10.3% (91)
State:
8.1% (126,882)
Number of households with income $60k - 75k:
Krebs:
10.3% (91)
State:
10.0% (157,916)
Number of households with income $75k - 100k:
Krebs:
13.1% (116)
Oklahoma:
12.4% (195,015)
Number of households with income $100k - 125k:
Krebs:
6.0% (53)
Oklahoma:
9.0% (141,779)
Number of households with income $125k - 150k:
Krebs:
1.9% (17)
State:
5.8% (91,594)
Number of households with income $150k - 200k:
Krebs:
1.6% (14)
Oklahoma:
6.3% (98,589)
Number of households with income > $200k:
Krebs:
1.0% (9)
Oklahoma:
6.2% (97,770)
Aggregate household income in Krebs in 2022: $47,463,611
Median family income in Krebs in 2022:
Krebs:
$48,501
Oklahoma:
$75,476
Number of families with income $10k - 20k:
Krebs:
17.8% (101)
State:
4.9% (49,571)
Number of families with income $20k - 30k:
Krebs:
13.0% (73)
Oklahoma:
6.3% (64,367)
Number of families with income $30k - 40k:
Krebs:
9.5% (53)
State:
7.5% (76,467)
Number of families with income $40k - 50k:
Krebs:
9.6% (54)
State:
8.3% (84,578)
Number of families with income $50k - 60k:
Krebs:
10.9% (61)
Oklahoma:
7.8% (79,642)
Number of families with income $60k - 75k:
Krebs:
10.6% (60)
Oklahoma:
10.6% (108,169)
Number of families with income $75k - 100k:
Krebs:
15.9% (90)
State:
14.6% (148,857)
Number of families with income $100k - 125k:
Krebs:
9.3% (52)
Oklahoma:
11.2% (113,480)
Number of families with income $125k - 150k:
Krebs:
0.9% (5)
State:
7.6% (77,253)
Number of families with income $150k - 200k:
Krebs:
0.9% (5)
State:
8.4% (85,947)
Number of families with income > $200k:
Krebs:
1.6% (9)
State:
8.5% (86,531)
Median non-family income in Krebs in 2022:
Krebs:
$28,468
Oklahoma:
$35,419
Change in median non-family income between 2000 and 2022:
Krebs, Oklahoma:
+80.1%
Oklahoma:
+83.2%
Median per capita income in Krebs in 2022:
Krebs:
$23,203
State:
$32,930
Change in median per capita income between 2000 and 2022:
Krebs, Oklahoma:
+77.9%
Oklahoma:
+86.6%
Income statistics for White residents
Median household income in Krebs, OK in 2022:
Krebs:
$44,056
State:
$63,444
Change in median household income between 2000 and 2022:
Krebs, Oklahoma:
+68.9%
State:
+79.3%
Number of households with income < $10k:
Krebs:
2.2% (15)
State:
5.5% (60,994)
Number of households with income $10k - 20k:
Krebs:
23.5% (162)
Oklahoma:
8.2% (91,263)
Number of households with income $20k - 30k:
Krebs:
12.5% (86)
Oklahoma:
8.7% (96,988)
Number of households with income $30k - 40k:
Krebs:
9.4% (65)
State:
8.4% (93,121)
Number of households with income $40k - 50k:
Krebs:
10.2% (70)
State:
8.6% (95,446)
Number of households with income $50k - 60k:
Krebs:
10.3% (71)
Oklahoma:
7.9% (87,723)
Number of households with income $60k - 75k:
Krebs:
8.6% (59)
Oklahoma:
9.9% (109,955)
Number of households with income $75k - 100k:
Krebs:
12.9% (89)
State:
12.9% (143,880)
Number of households with income $100k - 125k:
Krebs:
6.0% (41)
State:
9.7% (107,851)
Number of households with income $125k - 150k:
Krebs:
1.5% (10)
State:
6.3% (69,802)
Number of households with income $150k - 200k:
Krebs:
2.0% (14)
Oklahoma:
6.9% (76,863)
Number of households with income > $200k:
Krebs:
0.9% (6)
State:
7.0% (78,099)
Aggregate household income in Krebs in 2022: $36,055,946
Median family income in Krebs in 2022:
Krebs:
$46,658
Oklahoma:
$82,251
Number of families with income $10k - 20k:
Krebs:
20.3% (88)
State:
4.1% (29,440)
Number of families with income $20k - 30k:
Krebs:
13.9% (60)
State:
5.7% (40,670)
Number of families with income $30k - 40k:
Krebs:
7.7% (33)
State:
6.5% (46,540)
Number of families with income $40k - 50k:
Krebs:
10.1% (44)
State:
7.7% (55,082)
Number of families with income $50k - 60k:
Krebs:
10.4% (45)
State:
7.5% (53,408)
Number of families with income $60k - 75k:
Krebs:
7.7% (33)
State:
10.4% (74,624)
Number of families with income $75k - 100k:
Krebs:
16.9% (73)
Oklahoma:
15.3% (109,679)
Number of families with income $100k - 125k:
Krebs:
9.3% (40)
Oklahoma:
12.0% (86,208)
Number of families with income $125k - 150k:
Krebs:
1.1% (5)
State:
8.3% (59,328)
Number of families with income $150k - 200k:
Krebs:
1.1% (5)
State:
9.4% (67,640)
Number of families with income > $200k:
Krebs:
1.4% (6)
State:
9.7% (69,551)
Median non-family income in Krebs in 2022:
Krebs:
$28,219
State:
$36,941
Change in median non-family income between 2000 and 2022:
Krebs, Oklahoma:
+75.5%
Oklahoma:
+83.5%
Median per capita income in Krebs in 2022:
Krebs:
$24,976
Oklahoma:
$37,390
Change in median per capita income between 2000 and 2022:
Krebs, Oklahoma:
+78.7%
Oklahoma:
+92.4%
Income statistics for Black or African American residents
Median per capita income in Krebs in 2022:
Krebs:
$132,454
Oklahoma:
$24,741
Income statistics for Hispanic or Latino residents
Median household income in Krebs, OK in 2022:
Krebs:
$37,235
Oklahoma:
$52,856
Change in median household income between 2000 and 2022:: -78.8%
Krebs, Oklahoma:
-78.8%
State:
+89.4%
Number of households with income < $10k:
Krebs:
0.0% (0)
State:
6.0% (7,958)
Number of households with income $10k - 20k:
Krebs:
0.0% (0)
Oklahoma:
8.4% (11,153)
Number of households with income $20k - 30k:
Krebs:
0.0% (0)
State:
9.7% (13,003)
Number of households with income $30k - 40k:
Krebs:
84.0% (21)
State:
11.7% (15,624)
Number of households with income $40k - 50k:
Krebs:
0.0% (0)
Oklahoma:
11.0% (14,697)
Number of households with income $50k - 60k:
Krebs:
0.0% (0)
Oklahoma:
9.6% (12,832)
Number of households with income $60k - 75k:
Krebs:
16.0% (4)
State:
12.2% (16,321)
Number of households with income $75k - 100k:
Krebs:
0.0% (0)
Oklahoma:
12.5% (16,668)
Number of households with income $100k - 125k:
Krebs:
0.0% (0)
Oklahoma:
7.5% (9,988)
Number of households with income $125k - 150k:
Krebs:
0.0% (0)
Oklahoma:
4.5% (6,042)
Number of households with income $150k - 200k:
Krebs:
0.0% (0)
State:
3.8% (5,080)
Number of households with income > $200k:
Krebs:
0.0% (0)
Oklahoma:
3.0% (4,063)
Aggregate household income in Krebs in 2022: $1,061,231
Median family income in Krebs in 2022:
Krebs:
$37,221
Oklahoma:
$55,896
Number of families with income $30k - 40k:
Krebs:
83.2% (23)
State:
12.3% (12,391)
Number of families with income $60k - 75k:
Krebs:
16.8% (5)
State:
12.9% (13,025)
Median per capita income in Krebs in 2022:
Krebs:
$14,871
State:
$19,473
Change in median per capita income between 2000 and 2022:
Krebs, Oklahoma:
+18.7%
State:
+97.3%
Income statistics for American Indian and Alaska Native residents
Number of households with income < $10k:
Krebs:
0.0% (0)
State:
8.0% (7,959)
Number of households with income $10k - 20k:
Krebs:
44.4% (12)
State:
11.2% (11,175)
Number of households with income $20k - 30k:
Krebs:
0.0% (0)
State:
9.7% (9,654)
Number of households with income $30k - 40k:
Krebs:
0.0% (0)
State:
9.1% (9,092)
Number of households with income $40k - 50k:
Krebs:
0.0% (0)
Oklahoma:
9.1% (9,020)
Number of households with income $50k - 60k:
Krebs:
14.8% (4)
State:
8.8% (8,714)
Number of households with income $60k - 75k:
Krebs:
40.7% (11)
Oklahoma:
10.7% (10,616)
Number of households with income $75k - 100k:
Krebs:
0.0% (0)
State:
11.5% (11,402)
Number of households with income $100k - 125k:
Krebs:
0.0% (0)
State:
8.8% (8,769)
Number of households with income $125k - 150k:
Krebs:
0.0% (0)
State:
5.0% (4,965)
Number of households with income $150k - 200k:
Krebs:
0.0% (0)
State:
4.5% (4,512)
Number of households with income > $200k:
Krebs:
0.0% (0)
State:
3.6% (3,569)
Aggregate household income in Krebs in 2022: $1,196,251
Median family income in Krebs in 2022:
Krebs:
$60,194
Oklahoma:
$61,590
Number of families with income $10k - 20k:
Krebs:
25.7% (5)
State:
6.3% (4,189)
Number of families with income $50k - 60k:
Krebs:
24.5% (5)
State:
9.9% (6,556)
Number of families with income $60k - 75k:
Krebs:
49.8% (10)
State:
10.8% (7,198)
Median per capita income in Krebs in 2022:
Krebs:
$13,570
Oklahoma:
$25,549
Change in median per capita income between 2000 and 2022:
Krebs, Oklahoma:
+53.2%
Oklahoma:
+118.7%
Income statistics for Multirace residents
Median household income in Krebs, OK in 2022:
Krebs:
$52,769
State:
$53,626
Number of households with income < $10k:
Krebs:
6.6% (13)
State:
6.8% (11,975)
Number of households with income $10k - 20k:
Krebs:
2.5% (5)
Oklahoma:
8.9% (15,797)
Number of households with income $20k - 30k:
Krebs:
12.2% (24)
Oklahoma:
10.2% (18,071)
Number of households with income $30k - 40k:
Krebs:
16.8% (33)
State:
11.0% (19,477)
Number of households with income $40k - 50k:
Krebs:
10.7% (21)
State:
9.3% (16,501)
Number of households with income $50k - 60k:
Krebs:
8.6% (17)
State:
8.9% (15,635)
Number of households with income $60k - 75k:
Krebs:
12.2% (24)
State:
10.9% (19,250)
Number of households with income $75k - 100k:
Krebs:
16.2% (32)
State:
11.5% (20,279)
Number of households with income $100k - 125k:
Krebs:
7.6% (15)
Oklahoma:
8.0% (14,067)
Number of households with income $125k - 150k:
Krebs:
4.6% (9)
State:
4.9% (8,612)
Number of households with income $150k - 200k:
Krebs:
0.0% (0)
Oklahoma:
5.0% (8,897)
Number of households with income > $200k:
Krebs:
2.0% (4)
State:
4.5% (7,970)
Aggregate household income in Krebs in 2022: $12,056,903
Median family income in Krebs in 2022:
Krebs:
$57,097
Oklahoma:
$62,946
Number of families with income $20k - 30k:
Krebs:
12.6% (16)
Oklahoma:
7.7% (9,202)
Number of families with income $30k - 40k:
Krebs:
21.1% (26)
Oklahoma:
10.8% (12,890)
Number of families with income $40k - 50k:
Krebs:
10.5% (13)
Oklahoma:
9.6% (11,468)
Number of families with income $50k - 60k:
Krebs:
9.8% (12)
State:
7.7% (9,220)
Number of families with income $60k - 75k:
Krebs:
14.4% (18)
State:
11.3% (13,582)
Number of families with income $75k - 100k:
Krebs:
15.7% (20)
Oklahoma:
13.1% (15,759)
Number of families with income $100k - 125k:
Krebs:
12.5% (16)
Oklahoma:
10.2% (12,250)
Number of families with income > $200k:
Krebs:
3.4% (4)
State:
5.7% (6,851)
Median non-family income in Krebs in 2022:
Krebs:
$30,847
Oklahoma:
$34,773
Change in median non-family income between 2000 and 2022:
Krebs, Oklahoma:
+54.2%
State:
+103.1%
Median per capita income in Krebs in 2022:
Krebs:
$21,129
State:
$23,085
Change in median per capita income between 2000 and 2022:
Krebs, Oklahoma:
+104.5%
State:
+93.8%
Discuss Krebs, Oklahoma (OK) on our hugely popular Oklahoma forum.