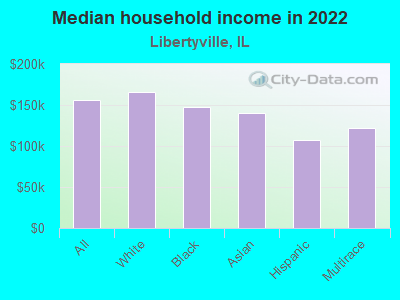
The median household income in Libertyville, IL in 2022 was $156,502, which was 51.0% greater than the median annual income of $76,708 across the entire state of Illinois. Compared to the median income of $88,828 in 2000 this represents an increase of 43.2%. The per capita income in 2022 was $80,203, which means an increase of 49.6% compared to 2000 when it was $40,426.
Whole page based on the data from 2000 / 2022 when the population of Libertyville, Illinois was 20,742 / 20,439
Income statistics for all residents
Median household income in Libertyville, IL in 2022:
Libertyville:
$156,502
State:
$76,708
Change in median household income between 2000 and 2022:
Libertyville, Illinois:
+76.2%
Illinois:
+64.6%
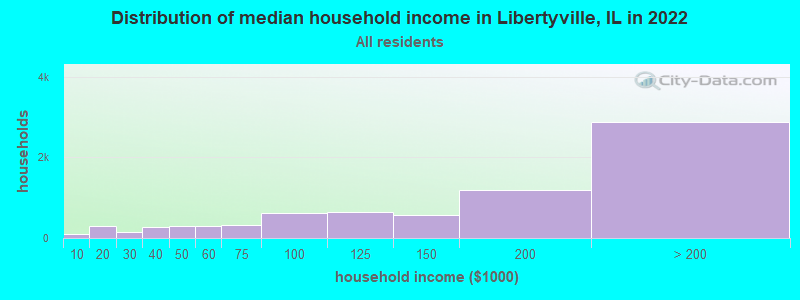
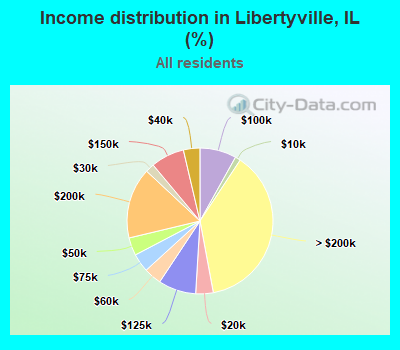
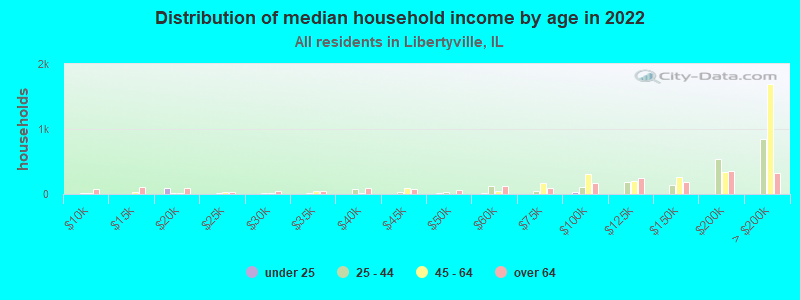
Number of households with income < $10k:
Libertyville:
1.2% (92)
State:
5.9% (296,090)
Number of households with income $10k - 20k:
Libertyville:
3.9% (296)
Illinois:
6.6% (333,259)
Number of households with income $20k - 30k:
Libertyville:
2.0% (149)
State:
6.8% (342,921)
Number of households with income $30k - 40k:
Libertyville:
3.6% (278)
State:
7.0% (355,254)
Number of households with income $40k - 50k:
Libertyville:
3.9% (301)
State:
6.7% (340,678)
Number of households with income $50k - 60k:
Libertyville:
3.9% (298)
State:
6.7% (339,405)
Number of households with income $60k - 75k:
Libertyville:
4.1% (312)
State:
9.2% (465,709)
Number of households with income $75k - 100k:
Libertyville:
8.1% (617)
State:
12.9% (651,353)
Number of households with income $100k - 125k:
Libertyville:
8.4% (638)
Illinois:
10.3% (522,359)
Number of households with income $125k - 150k:
Libertyville:
7.4% (567)
Illinois:
7.3% (367,136)
Number of households with income $150k - 200k:
Libertyville:
15.7% (1,197)
State:
9.0% (455,249)
Number of households with income > $200k:
Libertyville:
37.8% (2,880)
State:
11.6% (586,947)
Aggregate household income in Libertyville in 2022: $1,621,839,557
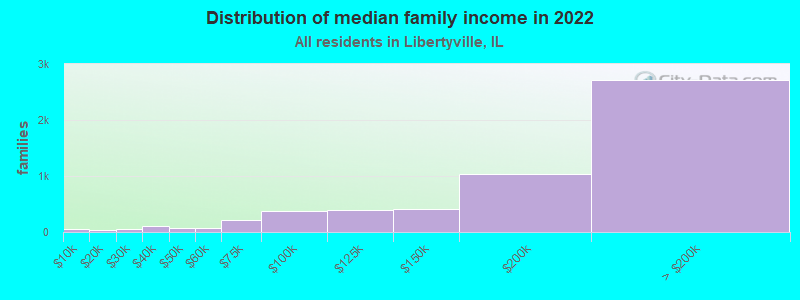
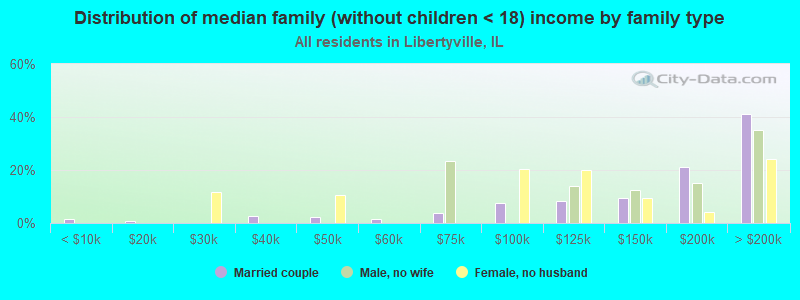
Median family income in Libertyville in 2022:
Libertyville:
$195,635
State:
$96,948
Number of families with income < $10k:
Libertyville:
1.0% (53)
State:
3.4% (105,875)
Number of families with income $10k - 20k:
Libertyville:
0.5% (29)
State:
3.3% (105,017)
Number of families with income $20k - 30k:
Libertyville:
1.0% (55)
State:
4.7% (146,403)
Number of families with income $30k - 40k:
Libertyville:
2.0% (108)
State:
5.3% (167,069)
Number of families with income $40k - 50k:
Libertyville:
1.4% (78)
Illinois:
5.8% (181,164)
Number of families with income $50k - 60k:
Libertyville:
1.3% (71)
State:
6.1% (191,561)
Number of families with income $60k - 75k:
Libertyville:
3.8% (208)
Illinois:
9.0% (282,985)
Number of families with income $75k - 100k:
Libertyville:
6.8% (375)
State:
13.8% (432,725)
Number of families with income $100k - 125k:
Libertyville:
7.2% (395)
Illinois:
11.9% (373,296)
Number of families with income $125k - 150k:
Libertyville:
7.3% (402)
State:
8.9% (279,791)
Number of families with income $150k - 200k:
Libertyville:
18.7% (1,028)
State:
11.9% (372,004)
Number of families with income > $200k:
Libertyville:
49.1% (2,706)
Illinois:
15.9% (500,033)
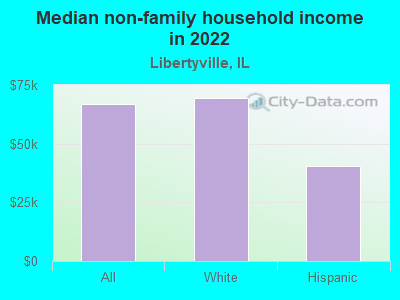
Median non-family income in Libertyville in 2022:
Libertyville:
$67,045
State:
$46,533
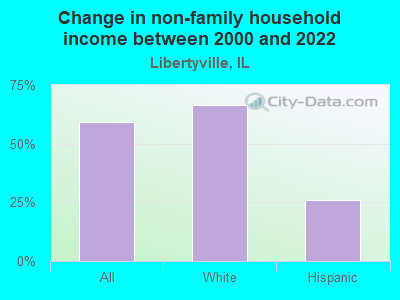
Change in median non-family income between 2000 and 2022:
Libertyville, Illinois:
+59.4%
State:
+64.0%
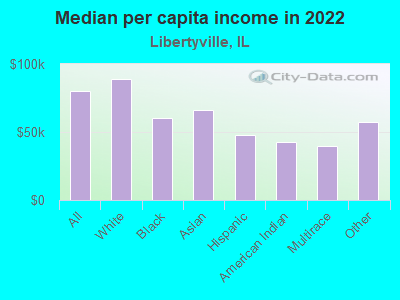
Median per capita income in Libertyville in 2022:
Libertyville:
$80,203
Illinois:
$43,317
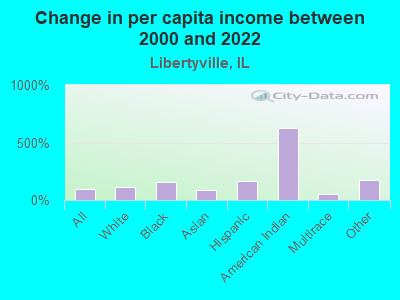
Change in median per capita income between 2000 and 2022:
Libertyville, Illinois:
+98.4%
Illinois:
+87.5%
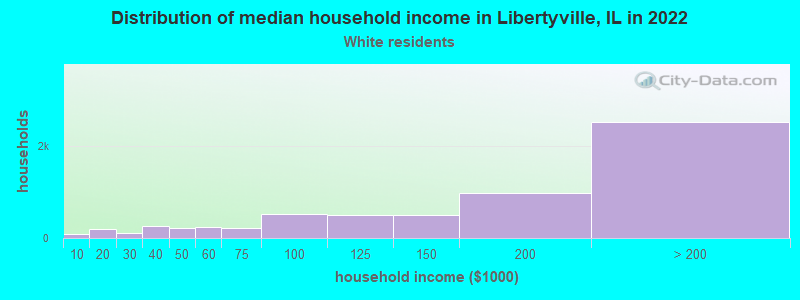
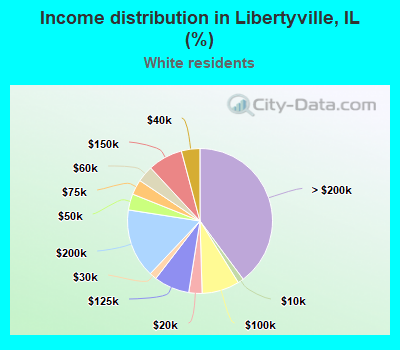
Income statistics for White residents
Median household income in Libertyville, IL in 2022:
Libertyville:
$165,658
Illinois:
$83,346
Change in median household income between 2000 and 2022:
Libertyville, Illinois:
+86.8%
State:
+67.5%
Number of households with income < $10k:
Libertyville:
1.3% (82)
State:
4.5% (149,895)
Number of households with income $10k - 20k:
Libertyville:
3.0% (187)
State:
5.5% (184,529)
Number of households with income $20k - 30k:
Libertyville:
1.6% (102)
State:
6.1% (205,767)
Number of households with income $30k - 40k:
Libertyville:
4.1% (261)
State:
6.7% (225,572)
Number of households with income $40k - 50k:
Libertyville:
3.6% (227)
State:
6.5% (216,965)
Number of households with income $50k - 60k:
Libertyville:
3.7% (232)
State:
6.6% (222,841)
Number of households with income $60k - 75k:
Libertyville:
3.4% (214)
State:
9.3% (312,758)
Number of households with income $75k - 100k:
Libertyville:
8.4% (531)
Illinois:
12.9% (433,180)
Number of households with income $100k - 125k:
Libertyville:
7.9% (502)
Illinois:
10.7% (360,753)
Number of households with income $125k - 150k:
Libertyville:
7.8% (492)
Illinois:
7.9% (266,532)
Number of households with income $150k - 200k:
Libertyville:
15.4% (975)
State:
10.0% (337,357)
Number of households with income > $200k:
Libertyville:
39.9% (2,521)
State:
13.3% (446,069)
Aggregate household income in Libertyville in 2022: $1,411,839,229
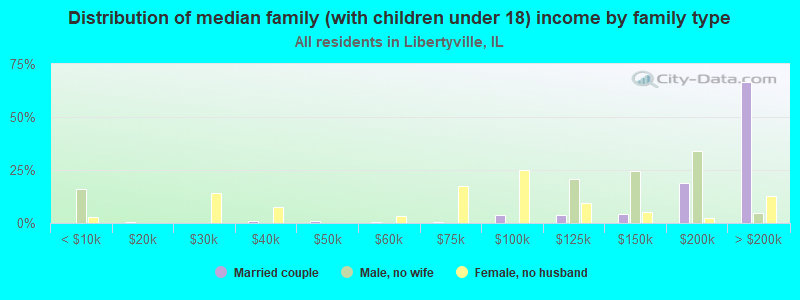
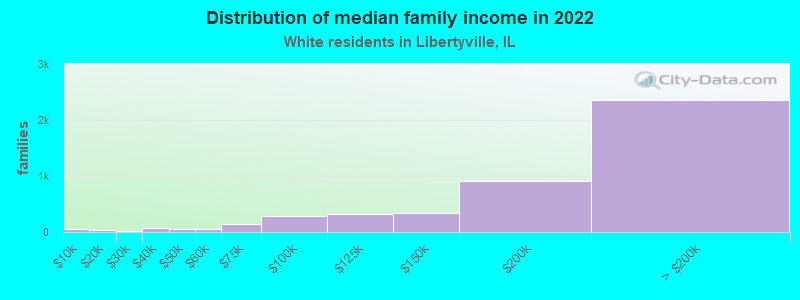
Median family income in Libertyville in 2022:
Libertyville:
$202,326
Illinois:
$107,938
Number of families with income < $10k:
Libertyville:
1.1% (53)
State:
2.2% (45,983)
Number of families with income $10k - 20k:
Libertyville:
0.7% (34)
Illinois:
2.5% (50,574)
Number of families with income $20k - 30k:
Libertyville:
0.5% (24)
State:
3.5% (70,927)
Number of families with income $30k - 40k:
Libertyville:
1.7% (78)
Illinois:
4.4% (90,563)
Number of families with income $40k - 50k:
Libertyville:
1.1% (50)
State:
5.0% (102,597)
Number of families with income $50k - 60k:
Libertyville:
1.3% (62)
State:
5.8% (119,129)
Number of families with income $60k - 75k:
Libertyville:
3.0% (142)
Illinois:
8.8% (179,665)
Number of families with income $75k - 100k:
Libertyville:
6.3% (292)
State:
13.5% (276,887)
Number of families with income $100k - 125k:
Libertyville:
6.9% (323)
State:
12.5% (256,099)
Number of families with income $125k - 150k:
Libertyville:
7.3% (342)
State:
9.8% (199,855)
Number of families with income $150k - 200k:
Libertyville:
19.6% (915)
Illinois:
13.4% (274,569)
Number of families with income > $200k:
Libertyville:
50.4% (2,357)
State:
18.6% (381,354)
Median non-family income in Libertyville in 2022:
Libertyville:
$69,557
State:
$50,934
Change in median non-family income between 2000 and 2022:
Libertyville, Illinois:
+66.5%
Illinois:
+70.7%
Median per capita income in Libertyville in 2022:
Libertyville:
$89,255
State:
$50,738
Change in median per capita income between 2000 and 2022:
Libertyville, Illinois:
+117.1%
State:
+95.5%
Income statistics for Black or African American residents
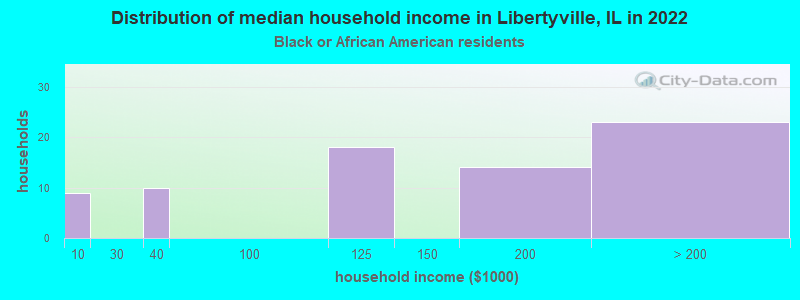
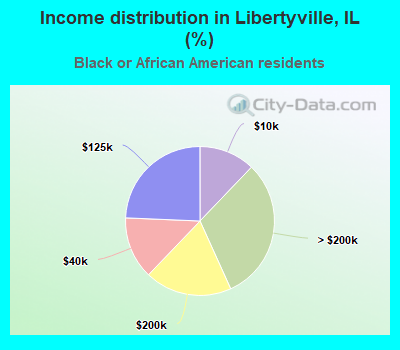
Median household income in Libertyville, IL in 2022:
Libertyville:
$147,551
Illinois:
$45,019
Number of households with income < $10k:
Libertyville:
12.2% (9)
Illinois:
13.3% (92,224)
Number of households with income $10k - 20k:
Libertyville:
0.0% (0)
State:
13.5% (93,732)
Number of households with income $20k - 30k:
Libertyville:
0.0% (0)
Illinois:
9.9% (68,453)
Number of households with income $30k - 40k:
Libertyville:
13.5% (10)
State:
8.5% (59,072)
Number of households with income $40k - 50k:
Libertyville:
0.0% (0)
Illinois:
7.9% (55,033)
Number of households with income $50k - 60k:
Libertyville:
0.0% (0)
Illinois:
7.2% (49,556)
Number of households with income $60k - 75k:
Libertyville:
0.0% (0)
State:
7.8% (53,726)
Number of households with income $75k - 100k:
Libertyville:
0.0% (0)
State:
11.6% (80,439)
Number of households with income $100k - 125k:
Libertyville:
24.3% (18)
State:
7.5% (52,244)
Number of households with income $125k - 150k:
Libertyville:
0.0% (0)
State:
3.9% (27,058)
Number of households with income $150k - 200k:
Libertyville:
18.9% (14)
State:
4.6% (32,057)
Number of households with income > $200k:
Libertyville:
31.1% (23)
State:
4.1% (28,731)
Aggregate household income in Libertyville in 2022: $14,046,655
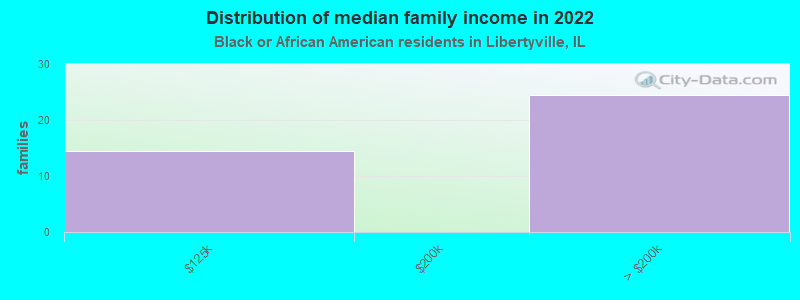
Median family income in Libertyville in 2022:
Libertyville:
$253,821
State:
$60,661
Number of families with income $100k - 125k:
Libertyville:
37.1% (14)
Illinois:
9.3% (34,471)
Number of families with income > $200k:
Libertyville:
62.9% (24)
State:
6.3% (23,371)
Median per capita income in Libertyville in 2022:
Libertyville:
$59,978
State:
$28,045
Income statistics for Asian residents
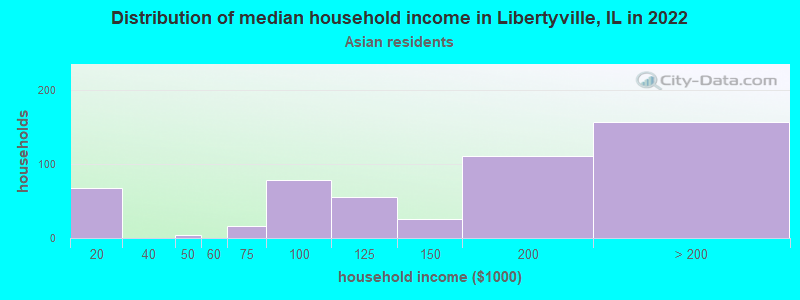
Median household income in Libertyville, IL in 2022:
Libertyville:
$140,025
State:
$104,287
Change in median household income between 2000 and 2022:
Libertyville, Illinois:
+56.4%
Illinois:
+81.9%
Number of households with income < $10k:
Libertyville:
0.0% (0)
State:
5.3% (14,653)
Number of households with income $10k - 20k:
Libertyville:
13.0% (67)
State:
4.5% (12,283)
Number of households with income $20k - 30k:
Libertyville:
0.0% (0)
Illinois:
4.8% (13,135)
Number of households with income $30k - 40k:
Libertyville:
0.0% (0)
State:
5.0% (13,655)
Number of households with income $40k - 50k:
Libertyville:
0.8% (4)
State:
4.5% (12,357)
Number of households with income $50k - 60k:
Libertyville:
0.0% (0)
State:
4.9% (13,568)
Number of households with income $60k - 75k:
Libertyville:
3.1% (16)
Illinois:
7.1% (19,606)
Number of households with income $75k - 100k:
Libertyville:
15.2% (78)
Illinois:
12.1% (33,349)
Number of households with income $100k - 125k:
Libertyville:
10.7% (55)
State:
9.7% (26,669)
Number of households with income $125k - 150k:
Libertyville:
5.1% (26)
State:
7.3% (20,172)
Number of households with income $150k - 200k:
Libertyville:
21.6% (111)
Illinois:
11.5% (31,711)
Number of households with income > $200k:
Libertyville:
30.5% (157)
State:
23.1% (63,411)
Aggregate household income in Libertyville in 2022: $82,784,086
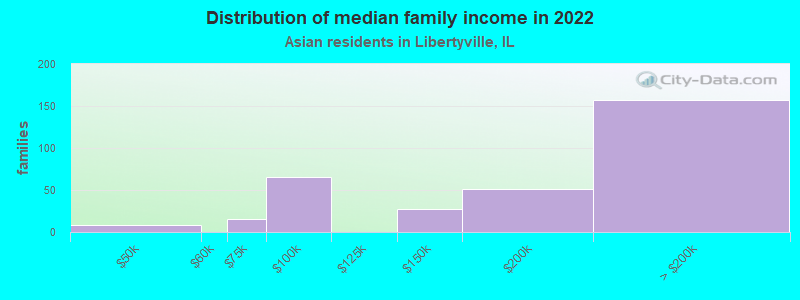
Median family income in Libertyville in 2022:
Libertyville:
$194,847
Illinois:
$124,630
Number of families with income $40k - 50k:
Libertyville:
2.5% (8)
State:
3.9% (7,584)
Number of families with income $60k - 75k:
Libertyville:
4.9% (16)
State:
7.0% (13,773)
Number of families with income $75k - 100k:
Libertyville:
20.4% (66)
Illinois:
12.3% (24,156)
Number of families with income $125k - 150k:
Libertyville:
8.3% (27)
State:
8.0% (15,639)
Number of families with income $150k - 200k:
Libertyville:
15.6% (51)
State:
13.9% (27,222)
Number of families with income > $200k:
Libertyville:
48.2% (157)
State:
28.0% (54,999)
Median per capita income in Libertyville in 2022:
Libertyville:
$65,956
State:
$52,977
Change in median per capita income between 2000 and 2022:
Libertyville, Illinois:
+85.8%
Illinois:
+119.5%
Income statistics for Hispanic or Latino residents
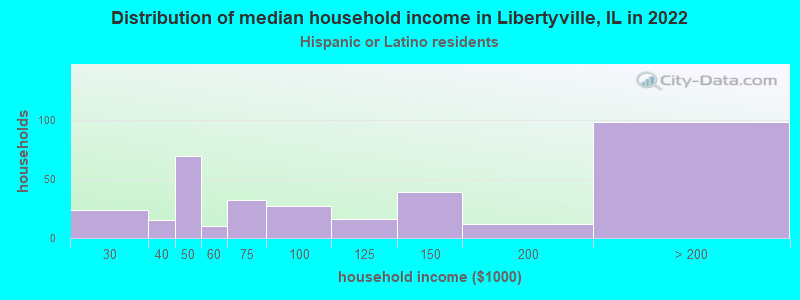
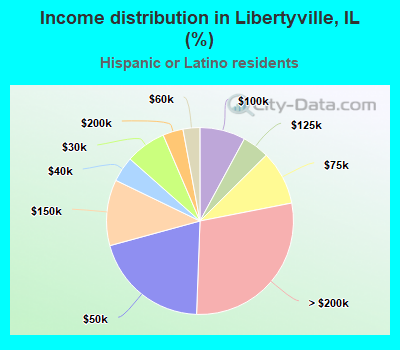
Median household income in Libertyville, IL in 2022:
Libertyville:
$107,334
Illinois:
$72,139
Change in median household income between 2000 and 2022:
Libertyville, Illinois:
+34.2%
State:
+75.7%
Number of households with income < $10k:
Libertyville:
0.0% (0)
State:
4.9% (33,145)
Number of households with income $10k - 20k:
Libertyville:
0.0% (0)
Illinois:
5.4% (36,345)
Number of households with income $20k - 30k:
Libertyville:
7.0% (24)
State:
7.5% (50,677)
Number of households with income $30k - 40k:
Libertyville:
4.4% (15)
State:
7.7% (52,008)
Number of households with income $40k - 50k:
Libertyville:
20.2% (69)
State:
8.1% (54,702)
Number of households with income $50k - 60k:
Libertyville:
2.9% (10)
State:
7.5% (51,062)
Number of households with income $60k - 75k:
Libertyville:
9.4% (32)
Illinois:
11.3% (76,576)
Number of households with income $75k - 100k:
Libertyville:
7.9% (27)
State:
15.5% (105,152)
Number of households with income $100k - 125k:
Libertyville:
4.7% (16)
State:
11.5% (77,760)
Number of households with income $125k - 150k:
Libertyville:
11.4% (39)
Illinois:
7.3% (49,310)
Number of households with income $150k - 200k:
Libertyville:
3.5% (12)
State:
7.6% (51,233)
Number of households with income > $200k:
Libertyville:
28.7% (98)
State:
5.9% (40,028)
Aggregate household income in Libertyville in 2022: $55,673,404
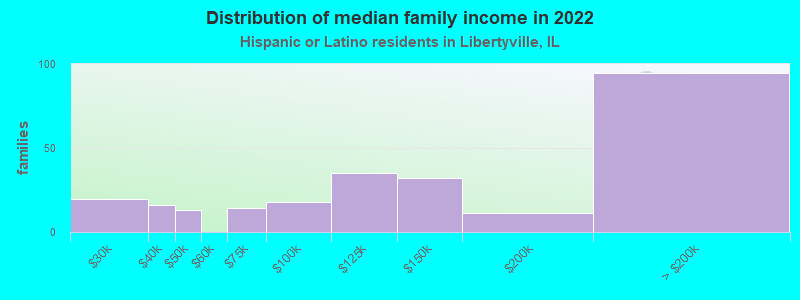
Median family income in Libertyville in 2022:
Libertyville:
$126,778
State:
$76,467
Number of families with income $20k - 30k:
Libertyville:
7.7% (20)
State:
6.8% (34,467)
Number of families with income $30k - 40k:
Libertyville:
6.4% (16)
Illinois:
7.5% (37,976)
Number of families with income $40k - 50k:
Libertyville:
5.2% (13)
Illinois:
7.7% (38,858)
Number of families with income $60k - 75k:
Libertyville:
5.5% (14)
State:
11.5% (58,164)
Number of families with income $75k - 100k:
Libertyville:
7.1% (18)
Illinois:
16.0% (81,055)
Number of families with income $100k - 125k:
Libertyville:
13.9% (35)
State:
12.1% (61,491)
Number of families with income $125k - 150k:
Libertyville:
12.6% (32)
State:
8.0% (40,271)
Number of families with income $150k - 200k:
Libertyville:
4.4% (11)
State:
8.6% (43,536)
Number of families with income > $200k:
Libertyville:
37.1% (94)
State:
6.6% (33,240)
Median non-family income in Libertyville in 2022:
Libertyville:
$40,357
State:
$45,965
Change in median non-family income between 2000 and 2022:
Libertyville, Illinois:
+26.0%
State:
+75.9%
Median per capita income in Libertyville in 2022:
Libertyville:
$47,955
Illinois:
$26,551
Income statistics for American Indian and Alaska Native residents
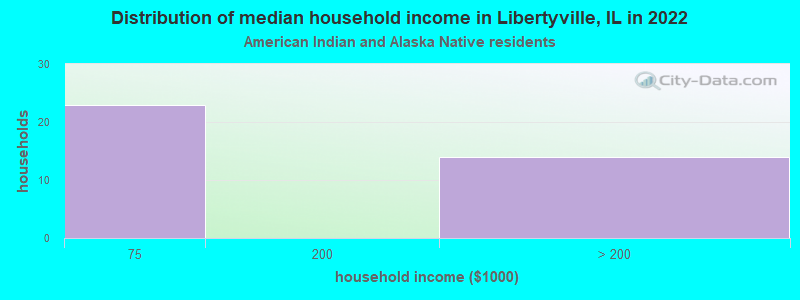
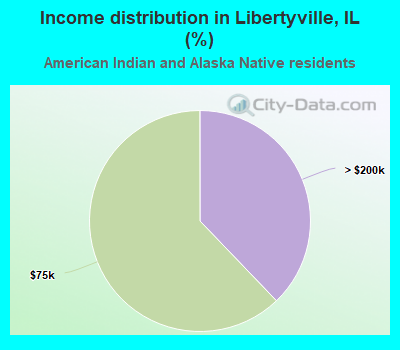
Number of households with income < $10k:
Libertyville:
0.0% (0)
State:
3.2% (935)
Number of households with income $10k - 20k:
Libertyville:
0.0% (0)
Illinois:
7.1% (2,053)
Number of households with income $20k - 30k:
Libertyville:
0.0% (0)
Illinois:
10.1% (2,939)
Number of households with income $30k - 40k:
Libertyville:
0.0% (0)
Illinois:
7.7% (2,246)
Number of households with income $40k - 50k:
Libertyville:
0.0% (0)
Illinois:
7.9% (2,300)
Number of households with income $50k - 60k:
Libertyville:
0.0% (0)
Illinois:
8.5% (2,460)
Number of households with income $60k - 75k:
Libertyville:
62.2% (23)
Illinois:
10.7% (3,095)
Number of households with income $75k - 100k:
Libertyville:
0.0% (0)
Illinois:
15.3% (4,451)
Number of households with income $100k - 125k:
Libertyville:
0.0% (0)
State:
11.7% (3,386)
Number of households with income $125k - 150k:
Libertyville:
0.0% (0)
State:
7.8% (2,269)
Number of households with income $150k - 200k:
Libertyville:
0.0% (0)
State:
5.8% (1,673)
Number of households with income > $200k:
Libertyville:
37.8% (14)
Illinois:
4.1% (1,198)
Aggregate household income in Libertyville in 2022: $5,159,908
Median per capita income in Libertyville in 2022:
Libertyville:
$42,756
State:
$26,979
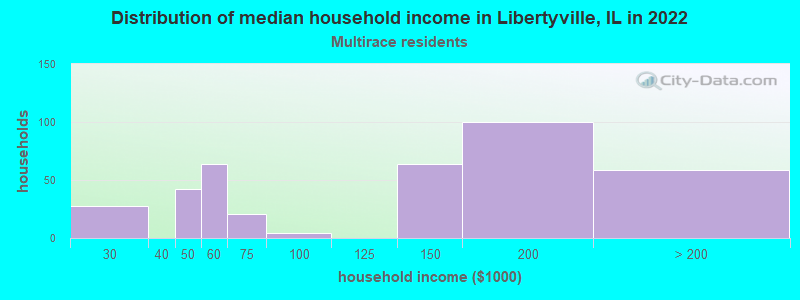
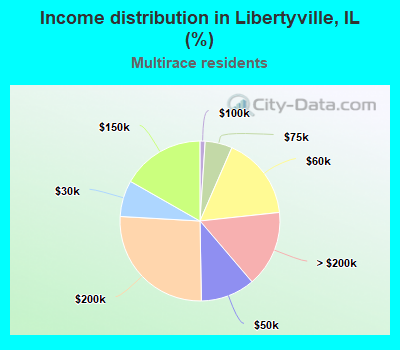
Income statistics for Multirace residents
Median household income in Libertyville, IL in 2022:
Libertyville:
$122,006
State:
$71,185
Change in median household income between 2000 and 2022:: -21.6%
Libertyville, Illinois:
-21.6%
State:
+81.4%
Number of households with income < $10k:
Libertyville:
0.0% (0)
State:
5.3% (21,595)
Number of households with income $10k - 20k:
Libertyville:
0.0% (0)
State:
6.5% (26,720)
Number of households with income $20k - 30k:
Libertyville:
7.3% (28)
Illinois:
8.0% (32,573)
Number of households with income $30k - 40k:
Libertyville:
0.0% (0)
State:
8.4% (34,383)
Number of households with income $40k - 50k:
Libertyville:
11.0% (42)
Illinois:
7.4% (30,234)
Number of households with income $50k - 60k:
Libertyville:
16.8% (64)
State:
6.9% (28,432)
Number of households with income $60k - 75k:
Libertyville:
5.5% (21)
State:
10.2% (41,780)
Number of households with income $75k - 100k:
Libertyville:
1.0% (4)
State:
13.0% (53,426)
Number of households with income $100k - 125k:
Libertyville:
0.0% (0)
Illinois:
10.5% (43,126)
Number of households with income $125k - 150k:
Libertyville:
16.8% (64)
State:
7.6% (31,153)
Number of households with income $150k - 200k:
Libertyville:
26.2% (100)
State:
7.6% (30,946)
Number of households with income > $200k:
Libertyville:
15.4% (59)
State:
8.6% (35,208)
Aggregate household income in Libertyville in 2022: $49,360,873
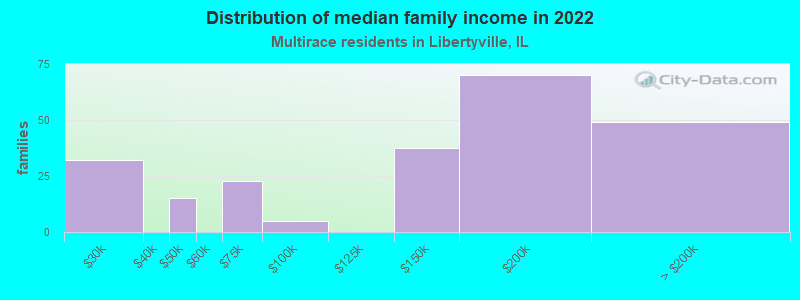
Median family income in Libertyville in 2022:
Libertyville:
$148,145
Illinois:
$84,400
Number of families with income $20k - 30k:
Libertyville:
13.9% (32)
State:
6.3% (17,559)
Number of families with income $40k - 50k:
Libertyville:
6.5% (15)
State:
7.1% (19,595)
Number of families with income $60k - 75k:
Libertyville:
9.8% (23)
Illinois:
9.3% (25,936)
Number of families with income $75k - 100k:
Libertyville:
2.1% (5)
State:
13.6% (37,857)
Number of families with income $125k - 150k:
Libertyville:
16.3% (38)
State:
9.0% (25,085)
Number of families with income $150k - 200k:
Libertyville:
30.2% (70)
State:
9.5% (26,306)
Number of families with income > $200k:
Libertyville:
21.2% (49)
State:
10.4% (28,926)
Median per capita income in Libertyville in 2022:
Libertyville:
$39,952
Illinois:
$29,285
Change in median per capita income between 2000 and 2022:
Libertyville, Illinois:
+48.1%
State:
+112.9%
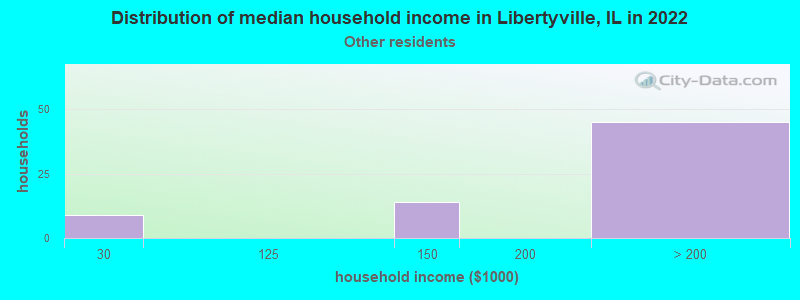
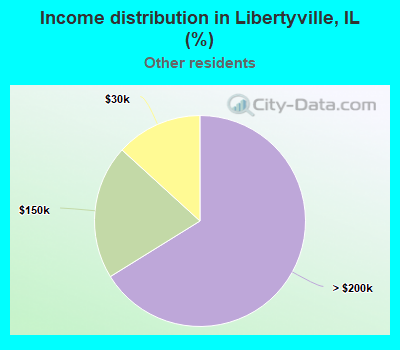
Income statistics for other residents
Number of households with income < $10k:
Libertyville:
0.0% (0)
Illinois:
5.7% (16,383)
Number of households with income $10k - 20k:
Libertyville:
0.0% (0)
State:
4.8% (13,886)
Number of households with income $20k - 30k:
Libertyville:
13.2% (9)
State:
7.0% (20,054)
Number of households with income $30k - 40k:
Libertyville:
0.0% (0)
Illinois:
7.0% (20,038)
Number of households with income $40k - 50k:
Libertyville:
0.0% (0)
Illinois:
8.3% (23,759)
Number of households with income $50k - 60k:
Libertyville:
0.0% (0)
State:
7.8% (22,410)
Number of households with income $60k - 75k:
Libertyville:
0.0% (0)
Illinois:
12.0% (34,448)
Number of households with income $75k - 100k:
Libertyville:
0.0% (0)
State:
16.2% (46,508)
Number of households with income $100k - 125k:
Libertyville:
0.0% (0)
State:
12.5% (35,952)
Number of households with income $125k - 150k:
Libertyville:
20.6% (14)
State:
6.9% (19,732)
Number of households with income $150k - 200k:
Libertyville:
0.0% (0)
State:
7.5% (21,422)
Number of households with income > $200k:
Libertyville:
66.2% (45)
State:
4.3% (12,194)
Aggregate household income in Libertyville in 2022: $17,342,692
Median family income in Libertyville in 2022:
Libertyville:
$242,271
State:
$74,069
Number of families with income $100k - 125k:
Libertyville:
25.8% (18)
State:
12.3% (27,638)
Number of families with income $125k - 150k:
Libertyville:
13.4% (10)
State:
7.3% (16,287)
Number of families with income > $200k:
Libertyville:
60.8% (43)
Illinois:
4.6% (10,400)
Median per capita income in Libertyville in 2022:
Libertyville:
$57,459
State:
$25,392
Discuss Libertyville, Illinois (IL) on our hugely popular Illinois forum.