The median household income in Lynbrook, NY in 2022 was $138,532, which was 42.6% greater than the median annual income of $79,557 across the entire state of New York. Compared to the median income of $62,373 in 2000 this represents an increase of 55.0%. The per capita income in 2022 was $60,652, which means an increase of 55.1% compared to 2000 when it was $27,211.
Whole page based on the data from 2000 / 2022 when the population of Lynbrook, New York was 19,911 / 20,220
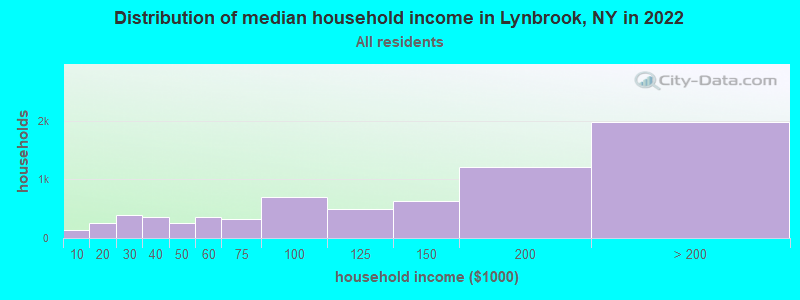
Income statistics for all residents
Median household income in Lynbrook, NY in 2022:
Lynbrook:
$138,533
State:
$79,557
Change in median household income between 2000 and 2022:
Lynbrook, New York:
+122.1%
State:
+83.3%
Number of households with income < $10k:
Lynbrook:
1.9% (137)
New York:
6.8% (527,598)
Number of households with income $10k - 20k:
Lynbrook:
3.5% (248)
State:
7.4% (574,940)
Number of households with income $20k - 30k:
Lynbrook:
5.4% (384)
State:
6.7% (517,718)
Number of households with income $30k - 40k:
Lynbrook:
5.1% (357)
New York:
6.5% (506,674)
Number of households with income $40k - 50k:
Lynbrook:
3.7% (260)
State:
6.1% (470,439)
Number of households with income $50k - 60k:
Lynbrook:
5.0% (355)
State:
5.8% (454,042)
Number of households with income $60k - 75k:
Lynbrook:
4.6% (325)
State:
8.5% (657,508)
Number of households with income $75k - 100k:
Lynbrook:
9.9% (700)
State:
11.6% (899,824)
Number of households with income $100k - 125k:
Lynbrook:
7.0% (491)
New York:
9.3% (723,825)
Number of households with income $125k - 150k:
Lynbrook:
8.9% (629)
State:
7.1% (552,420)
Number of households with income $150k - 200k:
Lynbrook:
17.0% (1,203)
State:
9.4% (727,051)
Number of households with income > $200k:
Lynbrook:
28.0% (1,975)
New York:
15.0% (1,162,269)
Aggregate household income in Lynbrook in 2022: $1,213,816,025
Median family income in Lynbrook in 2022:
Lynbrook:
$162,961
State:
$99,066
Number of families with income < $10k:
Lynbrook:
1.3% (66)
State:
4.2% (197,409)
Number of families with income $10k - 20k:
Lynbrook:
1.9% (101)
State:
4.3% (205,373)
Number of families with income $20k - 30k:
Lynbrook:
3.3% (169)
State:
5.1% (241,229)
Number of families with income $30k - 40k:
Lynbrook:
1.6% (81)
State:
5.5% (259,233)
Number of families with income $40k - 50k:
Lynbrook:
2.8% (142)
New York:
5.5% (259,113)
Number of families with income $50k - 60k:
Lynbrook:
5.4% (277)
State:
5.4% (255,320)
Number of families with income $60k - 75k:
Lynbrook:
3.0% (152)
State:
8.2% (388,624)
Number of families with income $75k - 100k:
Lynbrook:
9.9% (509)
State:
12.3% (583,110)
Number of families with income $100k - 125k:
Lynbrook:
5.8% (297)
State:
10.6% (500,579)
Number of families with income $125k - 150k:
Lynbrook:
10.4% (538)
State:
8.5% (400,594)
Number of families with income $150k - 200k:
Lynbrook:
19.1% (986)
State:
11.6% (551,650)
Number of families with income > $200k:
Lynbrook:
35.7% (1,841)
State:
18.9% (895,998)
Median non-family income in Lynbrook in 2022:
Lynbrook:
$57,632
State:
$50,181
Change in median non-family income between 2000 and 2022:
Lynbrook, New York:
+86.2%
State:
+85.4%
Median per capita income in Lynbrook in 2022:
Lynbrook:
$60,652
New York:
$47,421
Change in median per capita income between 2000 and 2022:
Lynbrook, New York:
+122.9%
State:
+102.7%
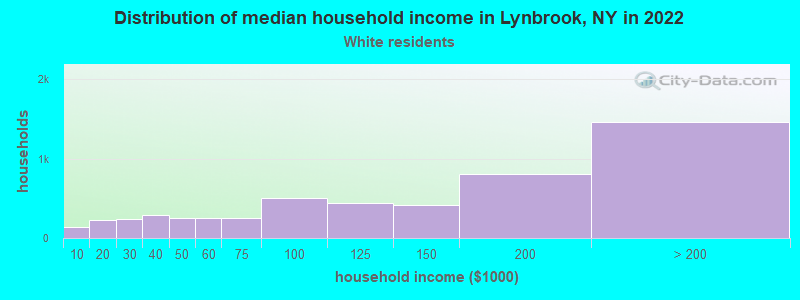
Income statistics for White residents
Median household income in Lynbrook, NY in 2022:
Lynbrook:
$127,807
State:
$89,408
Change in median household income between 2000 and 2022:
Lynbrook, New York:
+104.7%
State:
+85.5%
Number of households with income < $10k:
Lynbrook:
2.6% (139)
New York:
4.8% (225,550)
Number of households with income $10k - 20k:
Lynbrook:
4.4% (232)
New York:
6.1% (289,425)
Number of households with income $20k - 30k:
Lynbrook:
4.4% (234)
New York:
5.9% (280,254)
Number of households with income $30k - 40k:
Lynbrook:
5.5% (288)
State:
6.1% (288,263)
Number of households with income $40k - 50k:
Lynbrook:
4.8% (251)
New York:
5.9% (278,079)
Number of households with income $50k - 60k:
Lynbrook:
4.7% (247)
State:
5.7% (267,554)
Number of households with income $60k - 75k:
Lynbrook:
4.8% (255)
State:
8.4% (398,344)
Number of households with income $75k - 100k:
Lynbrook:
9.5% (502)
New York:
11.8% (554,841)
Number of households with income $100k - 125k:
Lynbrook:
8.4% (442)
State:
10.0% (469,794)
Number of households with income $125k - 150k:
Lynbrook:
7.9% (417)
New York:
7.6% (360,467)
Number of households with income $150k - 200k:
Lynbrook:
15.2% (802)
New York:
10.1% (477,078)
Number of households with income > $200k:
Lynbrook:
27.7% (1,461)
State:
17.6% (829,233)
Aggregate household income in Lynbrook in 2022: $875,452,430
Median family income in Lynbrook in 2022:
Lynbrook:
$168,882
State:
$115,170
Number of families with income < $10k:
Lynbrook:
1.5% (52)
State:
2.5% (68,851)
Number of families with income $10k - 20k:
Lynbrook:
2.9% (103)
State:
3.0% (83,127)
Number of families with income $20k - 30k:
Lynbrook:
2.2% (80)
State:
3.5% (97,578)
Number of families with income $30k - 40k:
Lynbrook:
1.5% (52)
New York:
4.1% (114,108)
Number of families with income $40k - 50k:
Lynbrook:
3.5% (126)
New York:
4.7% (130,902)
Number of families with income $50k - 60k:
Lynbrook:
5.4% (194)
State:
4.9% (135,118)
Number of families with income $60k - 75k:
Lynbrook:
2.9% (106)
State:
7.8% (216,254)
Number of families with income $75k - 100k:
Lynbrook:
7.8% (279)
State:
12.4% (342,382)
Number of families with income $100k - 125k:
Lynbrook:
7.6% (272)
State:
11.4% (314,917)
Number of families with income $125k - 150k:
Lynbrook:
9.5% (340)
State:
9.4% (260,489)
Number of families with income $150k - 200k:
Lynbrook:
18.2% (653)
State:
13.2% (365,586)
Number of families with income > $200k:
Lynbrook:
37.1% (1,334)
State:
23.2% (642,319)
Median non-family income in Lynbrook in 2022:
Lynbrook:
$59,654
State:
$54,783
Change in median non-family income between 2000 and 2022:
Lynbrook, New York:
+91.7%
State:
+87.9%
Median per capita income in Lynbrook in 2022:
Lynbrook:
$70,444
State:
$57,640
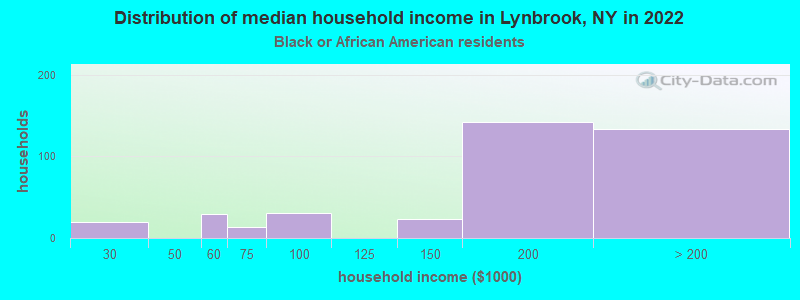
Income statistics for Black or African American residents
Median household income in Lynbrook, NY in 2022:
Lynbrook:
$199,414
State:
$57,898
Number of households with income < $10k:
Lynbrook:
0.0% (0)
State:
12.0% (128,500)
Number of households with income $10k - 20k:
Lynbrook:
0.0% (0)
New York:
10.0% (107,541)
Number of households with income $20k - 30k:
Lynbrook:
5.1% (20)
New York:
8.4% (90,192)
Number of households with income $30k - 40k:
Lynbrook:
0.0% (0)
State:
7.4% (79,579)
Number of households with income $40k - 50k:
Lynbrook:
0.0% (0)
New York:
6.8% (72,491)
Number of households with income $50k - 60k:
Lynbrook:
7.4% (29)
State:
6.7% (71,309)
Number of households with income $60k - 75k:
Lynbrook:
3.3% (13)
New York:
8.9% (95,050)
Number of households with income $75k - 100k:
Lynbrook:
7.9% (31)
New York:
11.5% (123,569)
Number of households with income $100k - 125k:
Lynbrook:
0.0% (0)
State:
8.1% (86,632)
Number of households with income $125k - 150k:
Lynbrook:
5.9% (23)
State:
6.0% (64,788)
Number of households with income $150k - 200k:
Lynbrook:
36.3% (142)
State:
7.2% (76,644)
Number of households with income > $200k:
Lynbrook:
34.0% (133)
State:
7.0% (75,062)
Aggregate household income in Lynbrook in 2022: $94,441,784
Median family income in Lynbrook in 2022:
Lynbrook:
$201,732
New York:
$72,528
Number of families with income $50k - 60k:
Lynbrook:
8.1% (27)
State:
6.3% (39,748)
Number of families with income $75k - 100k:
Lynbrook:
11.0% (37)
New York:
12.6% (78,986)
Number of families with income $125k - 150k:
Lynbrook:
6.7% (22)
New York:
7.5% (47,050)
Number of families with income $150k - 200k:
Lynbrook:
34.9% (116)
New York:
9.4% (59,260)
Number of families with income > $200k:
Lynbrook:
39.3% (131)
State:
9.3% (58,575)
Median per capita income in Lynbrook in 2022:
Lynbrook:
$70,412
State:
$31,947
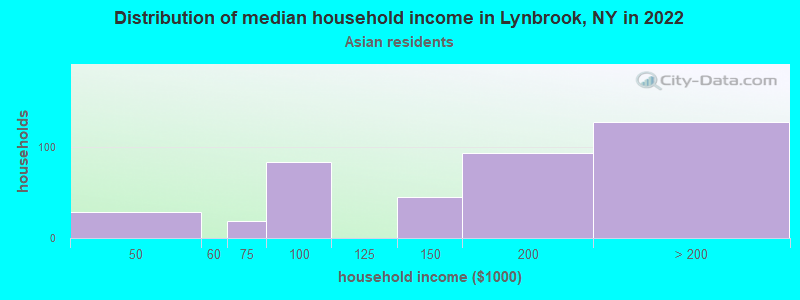
Income statistics for Asian residents
Median household income in Lynbrook, NY in 2022:
Lynbrook:
$165,694
New York:
$89,947
Number of households with income < $10k:
Lynbrook:
0.0% (0)
State:
6.9% (42,537)
Number of households with income $10k - 20k:
Lynbrook:
0.0% (0)
State:
7.3% (44,745)
Number of households with income $20k - 30k:
Lynbrook:
0.0% (0)
State:
6.2% (38,249)
Number of households with income $30k - 40k:
Lynbrook:
0.0% (0)
State:
5.5% (33,993)
Number of households with income $40k - 50k:
Lynbrook:
7.3% (29)
State:
4.8% (29,795)
Number of households with income $50k - 60k:
Lynbrook:
0.0% (0)
State:
5.2% (32,100)
Number of households with income $60k - 75k:
Lynbrook:
4.8% (19)
State:
7.3% (44,615)
Number of households with income $75k - 100k:
Lynbrook:
21.1% (84)
New York:
10.8% (66,687)
Number of households with income $100k - 125k:
Lynbrook:
0.0% (0)
New York:
8.2% (50,233)
Number of households with income $125k - 150k:
Lynbrook:
11.3% (45)
New York:
7.2% (44,299)
Number of households with income $150k - 200k:
Lynbrook:
23.6% (94)
State:
10.4% (63,837)
Number of households with income > $200k:
Lynbrook:
32.1% (128)
New York:
20.1% (123,891)
Aggregate household income in Lynbrook in 2022: $71,634,608
Median family income in Lynbrook in 2022:
Lynbrook:
$170,404
New York:
$98,136
Number of families with income $40k - 50k:
Lynbrook:
5.7% (22)
State:
5.2% (22,750)
Number of families with income $60k - 75k:
Lynbrook:
4.8% (19)
State:
7.6% (33,120)
Number of families with income $75k - 100k:
Lynbrook:
19.8% (77)
State:
10.7% (46,726)
Number of families with income $125k - 150k:
Lynbrook:
11.0% (43)
New York:
7.3% (31,893)
Number of families with income $150k - 200k:
Lynbrook:
25.1% (98)
State:
11.0% (48,177)
Number of families with income > $200k:
Lynbrook:
33.5% (130)
State:
22.2% (97,322)
Median per capita income in Lynbrook in 2022:
Lynbrook:
$34,724
New York:
$46,726
Change in median per capita income between 2000 and 2022:
Lynbrook, New York:
+75.1%
State:
+126.6%
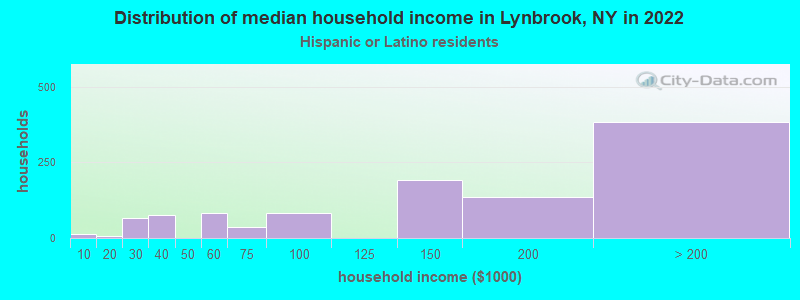
Income statistics for Hispanic or Latino residents
Median household income in Lynbrook, NY in 2022:
Lynbrook:
$155,847
New York:
$60,468
Number of households with income < $10k:
Lynbrook:
1.1% (12)
New York:
9.9% (127,185)
Number of households with income $10k - 20k:
Lynbrook:
0.6% (6)
State:
10.7% (136,699)
Number of households with income $20k - 30k:
Lynbrook:
6.1% (65)
State:
8.1% (102,991)
Number of households with income $30k - 40k:
Lynbrook:
7.1% (76)
New York:
7.8% (100,149)
Number of households with income $40k - 50k:
Lynbrook:
0.0% (0)
State:
6.9% (87,760)
Number of households with income $50k - 60k:
Lynbrook:
7.6% (82)
New York:
6.3% (80,968)
Number of households with income $60k - 75k:
Lynbrook:
3.4% (37)
State:
8.7% (110,631)
Number of households with income $75k - 100k:
Lynbrook:
7.6% (82)
State:
11.2% (142,787)
Number of households with income $100k - 125k:
Lynbrook:
0.0% (0)
State:
8.2% (104,850)
Number of households with income $125k - 150k:
Lynbrook:
18.0% (193)
State:
6.3% (80,274)
Number of households with income $150k - 200k:
Lynbrook:
12.7% (136)
State:
7.4% (95,117)
Number of households with income > $200k:
Lynbrook:
35.8% (384)
New York:
8.6% (109,514)
Aggregate household income in Lynbrook in 2022: $234,563,772
Median family income in Lynbrook in 2022:
Lynbrook:
$160,686
New York:
$68,770
Number of families with income $10k - 20k:
Lynbrook:
0.9% (8)
New York:
7.0% (59,058)
Number of families with income $20k - 30k:
Lynbrook:
4.7% (41)
State:
8.0% (68,048)
Number of families with income $30k - 40k:
Lynbrook:
4.0% (35)
New York:
8.4% (70,668)
Number of families with income $40k - 50k:
Lynbrook:
1.2% (11)
State:
7.4% (62,941)
Number of families with income $50k - 60k:
Lynbrook:
6.1% (53)
State:
6.6% (55,592)
Number of families with income $60k - 75k:
Lynbrook:
3.6% (31)
State:
9.3% (78,564)
Number of families with income $75k - 100k:
Lynbrook:
12.8% (112)
State:
12.6% (106,685)
Number of families with income $100k - 125k:
Lynbrook:
0.3% (3)
New York:
9.4% (79,139)
Number of families with income $125k - 150k:
Lynbrook:
15.4% (134)
New York:
6.9% (58,255)
Number of families with income $150k - 200k:
Lynbrook:
8.8% (76)
State:
8.3% (69,877)
Number of families with income > $200k:
Lynbrook:
42.1% (367)
New York:
9.3% (78,555)
Median per capita income in Lynbrook in 2022:
Lynbrook:
$56,612
State:
$29,761
Income statistics for American Indian and Alaska Native residents
Number of households with income < $10k:
Lynbrook:
0.0% (0)
State:
8.6% (3,559)
Number of households with income $10k - 20k:
Lynbrook:
0.0% (0)
State:
5.9% (2,455)
Number of households with income $20k - 30k:
Lynbrook:
0.0% (0)
State:
8.2% (3,393)
Number of households with income $30k - 40k:
Lynbrook:
0.0% (0)
New York:
11.9% (4,918)
Number of households with income $40k - 50k:
Lynbrook:
0.0% (0)
State:
6.5% (2,682)
Number of households with income $50k - 60k:
Lynbrook:
0.0% (0)
State:
6.1% (2,516)
Number of households with income $60k - 75k:
Lynbrook:
0.0% (0)
State:
10.0% (4,125)
Number of households with income $75k - 100k:
Lynbrook:
100.0% (42)
State:
13.3% (5,517)
Number of households with income $100k - 125k:
Lynbrook:
0.0% (0)
State:
8.4% (3,463)
Number of households with income $125k - 150k:
Lynbrook:
0.0% (0)
State:
7.0% (2,887)
Number of households with income $150k - 200k:
Lynbrook:
0.0% (0)
State:
9.9% (4,106)
Number of households with income > $200k:
Lynbrook:
0.0% (0)
State:
4.2% (1,744)
Aggregate household income in Lynbrook in 2022: $635,161
Median per capita income in Lynbrook in 2022:
Lynbrook:
$28,598
State:
$25,837
Change in median per capita income between 2000 and 2022:: -10.6%
Lynbrook, New York:
-10.6%
State:
+99.6%
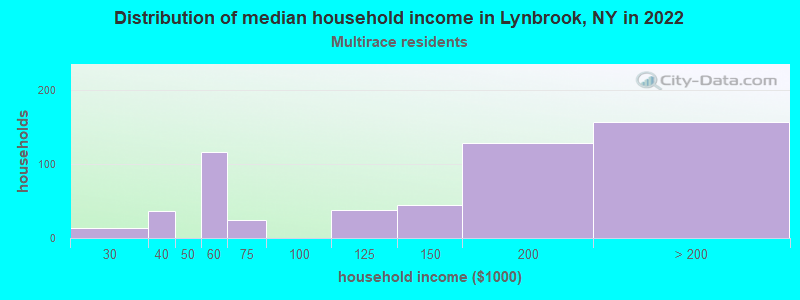
Income statistics for Multirace residents
Median household income in Lynbrook, NY in 2022:
Lynbrook:
$160,114
State:
$73,557
Number of households with income < $10k:
Lynbrook:
0.0% (0)
State:
8.9% (57,924)
Number of households with income $10k - 20k:
Lynbrook:
0.0% (0)
State:
8.7% (56,590)
Number of households with income $20k - 30k:
Lynbrook:
2.3% (13)
State:
7.1% (46,287)
Number of households with income $30k - 40k:
Lynbrook:
6.5% (36)
State:
6.9% (45,132)
Number of households with income $40k - 50k:
Lynbrook:
0.0% (0)
State:
5.8% (37,946)
Number of households with income $50k - 60k:
Lynbrook:
20.8% (116)
New York:
5.6% (36,410)
Number of households with income $60k - 75k:
Lynbrook:
4.3% (24)
State:
7.8% (50,819)
Number of households with income $75k - 100k:
Lynbrook:
0.0% (0)
State:
11.7% (76,024)
Number of households with income $100k - 125k:
Lynbrook:
6.8% (38)
New York:
9.3% (60,635)
Number of households with income $125k - 150k:
Lynbrook:
7.9% (44)
State:
6.2% (40,533)
Number of households with income $150k - 200k:
Lynbrook:
23.2% (129)
State:
8.6% (56,409)
Number of households with income > $200k:
Lynbrook:
28.2% (157)
New York:
13.4% (87,442)
Aggregate household income in Lynbrook in 2022: $110,704,031
Median family income in Lynbrook in 2022:
Lynbrook:
$157,453
State:
$85,788
Number of families with income $20k - 30k:
Lynbrook:
2.5% (11)
State:
6.6% (26,534)
Number of families with income $30k - 40k:
Lynbrook:
6.3% (28)
New York:
6.5% (26,239)
Number of families with income $50k - 60k:
Lynbrook:
13.0% (58)
State:
5.5% (22,002)
Number of families with income $60k - 75k:
Lynbrook:
5.5% (24)
New York:
7.6% (30,653)
Number of families with income $75k - 100k:
Lynbrook:
5.6% (25)
New York:
12.9% (51,995)
Number of families with income $100k - 125k:
Lynbrook:
1.8% (8)
New York:
10.7% (43,036)
Number of families with income $125k - 150k:
Lynbrook:
9.8% (43)
State:
7.1% (28,583)
Number of families with income $150k - 200k:
Lynbrook:
22.6% (100)
State:
9.4% (37,771)
Number of families with income > $200k:
Lynbrook:
32.9% (145)
State:
15.7% (62,951)
Median per capita income in Lynbrook in 2022:
Lynbrook:
$46,014
State:
$36,931
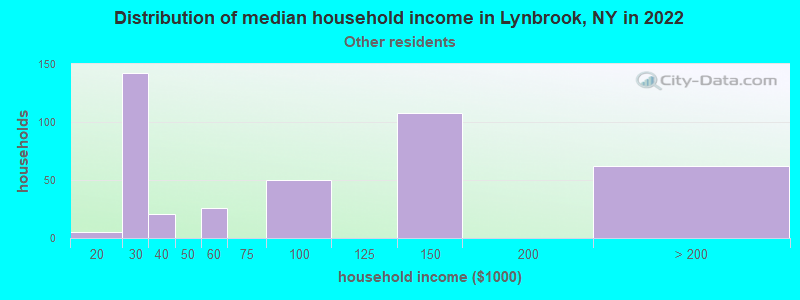
Income statistics for other residents
Median household income in Lynbrook, NY in 2022:
Lynbrook:
$83,143
State:
$56,210
Number of households with income < $10k:
Lynbrook:
0.0% (0)
State:
10.3% (69,252)
Number of households with income $10k - 20k:
Lynbrook:
1.2% (5)
State:
11.0% (73,890)
Number of households with income $20k - 30k:
Lynbrook:
34.3% (142)
State:
8.8% (59,096)
Number of households with income $30k - 40k:
Lynbrook:
5.1% (21)
State:
8.1% (54,418)
Number of households with income $40k - 50k:
Lynbrook:
0.0% (0)
State:
7.3% (49,042)
Number of households with income $50k - 60k:
Lynbrook:
6.3% (26)
State:
6.5% (43,945)
Number of households with income $60k - 75k:
Lynbrook:
0.0% (0)
New York:
9.5% (64,087)
Number of households with income $75k - 100k:
Lynbrook:
12.1% (50)
New York:
10.9% (73,094)
Number of households with income $100k - 125k:
Lynbrook:
0.0% (0)
New York:
7.9% (53,055)
Number of households with income $125k - 150k:
Lynbrook:
26.1% (108)
State:
5.9% (39,446)
Number of households with income $150k - 200k:
Lynbrook:
0.0% (0)
State:
7.2% (48,653)
Number of households with income > $200k:
Lynbrook:
15.0% (62)
State:
6.6% (44,703)
Aggregate household income in Lynbrook in 2022: $38,590,805
Median family income in Lynbrook in 2022:
Lynbrook:
$107,434
State:
$63,465
Number of families with income $10k - 20k:
Lynbrook:
1.2% (4)
State:
7.4% (34,598)
Number of families with income $20k - 30k:
Lynbrook:
27.3% (95)
State:
9.2% (43,198)
Number of families with income $50k - 60k:
Lynbrook:
7.8% (27)
New York:
7.1% (33,324)
Number of families with income $75k - 100k:
Lynbrook:
15.8% (55)
New York:
12.5% (58,659)
Number of families with income $125k - 150k:
Lynbrook:
28.7% (100)
State:
6.5% (30,363)
Number of families with income > $200k:
Lynbrook:
19.2% (67)
New York:
7.2% (33,950)
Median per capita income in Lynbrook in 2022:
Lynbrook:
$29,115
State:
$26,975
Change in median per capita income between 2000 and 2022:
Lynbrook, New York:
+111.7%
State:
+144.6%
Discuss Lynbrook, New York (NY) on our hugely popular New York forum.