The median household income in Lynden, WA in 2022 was $87,995, which was 3.8% less than the median annual income of $91,306 across the entire state of Washington. Compared to the median income of $42,767 in 2000 this represents an increase of 51.4%. The per capita income in 2022 was $43,245, which means an increase of 52.3% compared to 2000 when it was $20,639.
Whole page based on the data from 2000 / 2022 when the population of Lynden, Washington was 9,020 / 16,011
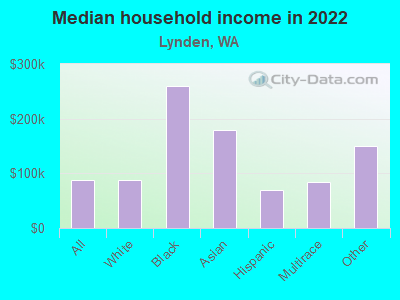
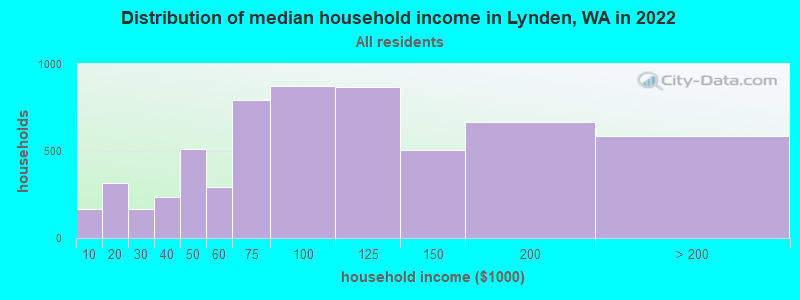
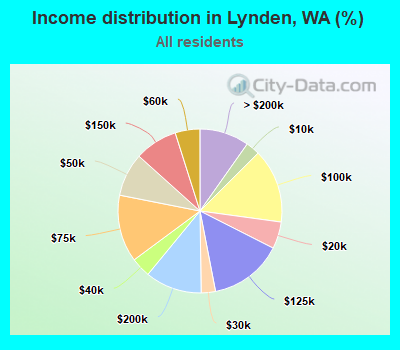
Income statistics for all residents
Median household income in Lynden, WA in 2022:
Lynden:
$87,996
State:
$91,306
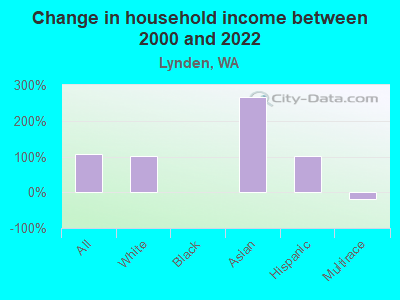
Change in median household income between 2000 and 2022:
Lynden, Washington:
+105.8%
State:
+99.5%
Number of households with income < $10k:
Lynden:
2.8% (165)
State:
4.5% (139,331)
Number of households with income $10k - 20k:
Lynden:
5.3% (318)
Washington:
5.0% (154,508)
Number of households with income $20k - 30k:
Lynden:
2.8% (168)
Washington:
5.4% (166,555)
Number of households with income $30k - 40k:
Lynden:
3.9% (233)
Washington:
5.5% (170,324)
Number of households with income $40k - 50k:
Lynden:
8.5% (510)
Washington:
6.0% (183,941)
Number of households with income $50k - 60k:
Lynden:
4.9% (291)
Washington:
6.1% (187,395)
Number of households with income $60k - 75k:
Lynden:
13.3% (792)
State:
8.7% (266,771)
Number of households with income $75k - 100k:
Lynden:
14.6% (873)
State:
13.1% (404,672)
Number of households with income $100k - 125k:
Lynden:
14.5% (865)
Washington:
11.0% (337,911)
Number of households with income $125k - 150k:
Lynden:
8.5% (506)
State:
8.0% (244,934)
Number of households with income $150k - 200k:
Lynden:
11.2% (667)
State:
10.5% (323,812)
Number of households with income > $200k:
Lynden:
9.8% (584)
Washington:
16.2% (499,799)
Aggregate household income in Lynden in 2022: $686,927,458
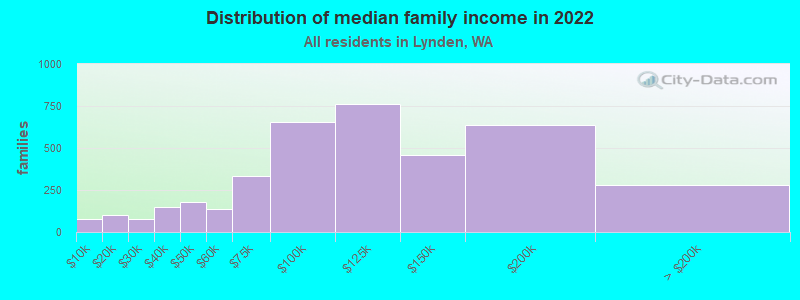
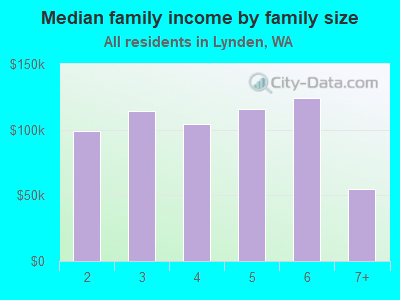
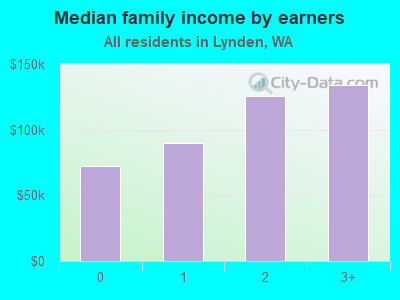
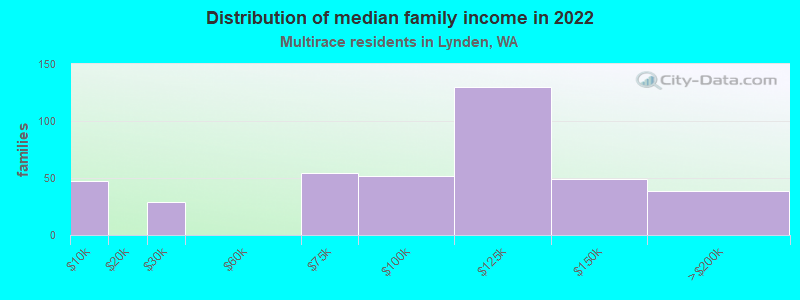
Median family income in Lynden in 2022:
Lynden:
$112,712
Washington:
$109,192
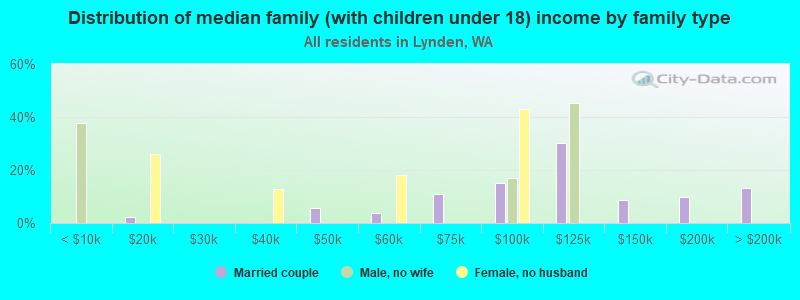
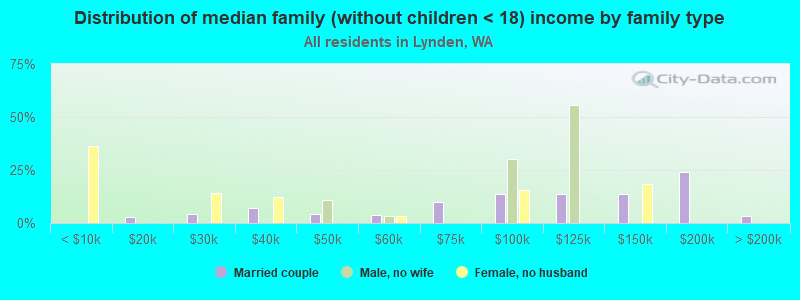
Number of families with income < $10k:
Lynden:
2.0% (76)
State:
2.9% (55,953)
Number of families with income $10k - 20k:
Lynden:
2.6% (100)
Washington:
2.6% (50,138)
Number of families with income $20k - 30k:
Lynden:
2.0% (75)
Washington:
3.2% (61,974)
Number of families with income $30k - 40k:
Lynden:
3.9% (149)
Washington:
4.1% (80,240)
Number of families with income $40k - 50k:
Lynden:
4.7% (180)
State:
4.9% (94,310)
Number of families with income $50k - 60k:
Lynden:
3.5% (134)
Washington:
5.3% (101,674)
Number of families with income $60k - 75k:
Lynden:
8.6% (332)
Washington:
8.2% (158,348)
Number of families with income $75k - 100k:
Lynden:
17.1% (655)
State:
13.8% (267,812)
Number of families with income $100k - 125k:
Lynden:
19.9% (764)
State:
12.4% (240,213)
Number of families with income $125k - 150k:
Lynden:
11.9% (456)
State:
9.3% (180,011)
Number of families with income $150k - 200k:
Lynden:
16.6% (638)
State:
13.0% (250,874)
Number of families with income > $200k:
Lynden:
7.3% (282)
State:
20.4% (393,898)
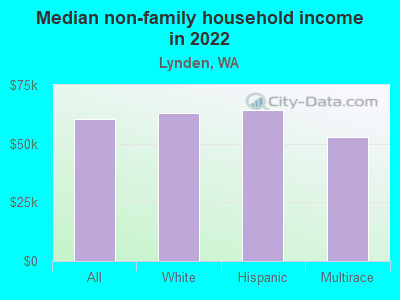
Median non-family income in Lynden in 2022:
Lynden:
$60,568
State:
$57,299
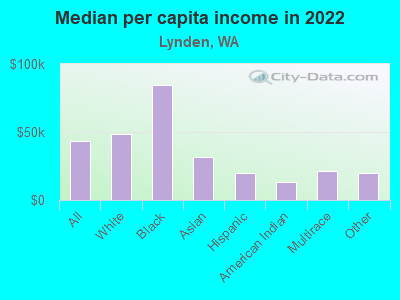
Median per capita income in Lynden in 2022:
Lynden:
$43,246
Washington:
$50,764
Change in median per capita income between 2000 and 2022:
Lynden, Washington:
+109.5%
State:
+121.0%
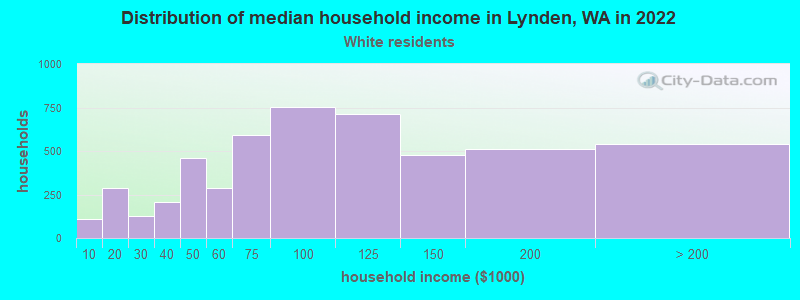
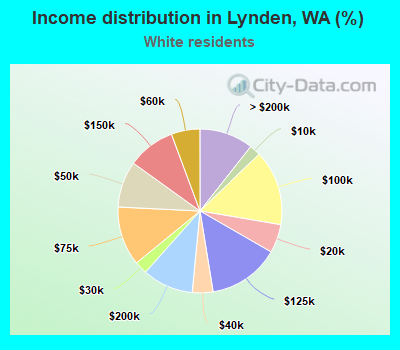
Income statistics for White residents
Median household income in Lynden, WA in 2022:
Lynden:
$87,153
State:
$91,916
Change in median household income between 2000 and 2022:
Lynden, Washington:
+102.4%
State:
+95.4%
Number of households with income < $10k:
Lynden:
2.2% (110)
Washington:
4.3% (95,850)
Number of households with income $10k - 20k:
Lynden:
5.6% (285)
Washington:
4.8% (106,421)
Number of households with income $20k - 30k:
Lynden:
2.5% (127)
State:
5.5% (122,860)
Number of households with income $30k - 40k:
Lynden:
4.1% (207)
State:
5.4% (119,627)
Number of households with income $40k - 50k:
Lynden:
9.1% (462)
Washington:
5.9% (132,276)
Number of households with income $50k - 60k:
Lynden:
5.7% (286)
Washington:
6.1% (136,212)
Number of households with income $60k - 75k:
Lynden:
11.7% (591)
State:
8.8% (196,086)
Number of households with income $75k - 100k:
Lynden:
14.9% (753)
State:
13.4% (299,192)
Number of households with income $100k - 125k:
Lynden:
14.1% (714)
State:
11.3% (252,209)
Number of households with income $125k - 150k:
Lynden:
9.4% (477)
State:
7.9% (175,962)
Number of households with income $150k - 200k:
Lynden:
10.1% (509)
State:
10.7% (239,156)
Number of households with income > $200k:
Lynden:
10.6% (538)
Washington:
16.1% (359,917)
Aggregate household income in Lynden in 2022: $593,020,868
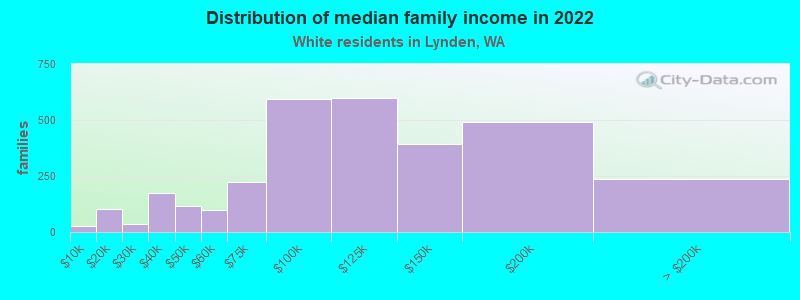
Median family income in Lynden in 2022:
Lynden:
$114,169
State:
$112,511
Number of families with income < $10k:
Lynden:
0.9% (27)
Washington:
2.4% (33,676)
Number of families with income $10k - 20k:
Lynden:
3.4% (104)
State:
2.0% (28,228)
Number of families with income $20k - 30k:
Lynden:
1.1% (35)
Washington:
2.9% (39,288)
Number of families with income $30k - 40k:
Lynden:
5.6% (173)
Washington:
3.6% (50,190)
Number of families with income $40k - 50k:
Lynden:
3.7% (114)
Washington:
4.6% (63,009)
Number of families with income $50k - 60k:
Lynden:
3.2% (99)
Washington:
5.0% (69,270)
Number of families with income $60k - 75k:
Lynden:
7.2% (223)
State:
8.2% (112,369)
Number of families with income $75k - 100k:
Lynden:
19.2% (593)
State:
14.1% (194,214)
Number of families with income $100k - 125k:
Lynden:
19.3% (596)
Washington:
13.2% (182,184)
Number of families with income $125k - 150k:
Lynden:
12.8% (394)
Washington:
9.5% (130,928)
Number of families with income $150k - 200k:
Lynden:
15.9% (490)
State:
13.7% (188,621)
Number of families with income > $200k:
Lynden:
7.7% (237)
Washington:
20.8% (285,982)
Median non-family income in Lynden in 2022:
Lynden:
$63,049
State:
$56,103
Median per capita income in Lynden in 2022:
Lynden:
$48,713
State:
$55,212
Change in median per capita income between 2000 and 2022:
Lynden, Washington:
+128.0%
State:
+123.8%
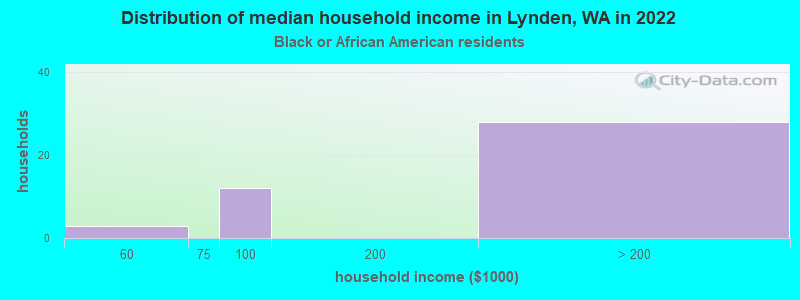
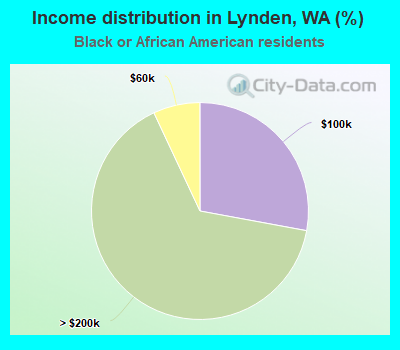
Income statistics for Black or African American residents
Median household income in Lynden, WA in 2022:
Lynden:
$259,060
State:
$68,202
Number of households with income < $10k:
Lynden:
0.0% (0)
State:
7.2% (8,014)
Number of households with income $10k - 20k:
Lynden:
0.0% (0)
State:
8.0% (8,904)
Number of households with income $20k - 30k:
Lynden:
0.0% (0)
State:
7.4% (8,207)
Number of households with income $30k - 40k:
Lynden:
0.0% (0)
State:
5.6% (6,220)
Number of households with income $40k - 50k:
Lynden:
0.0% (0)
State:
9.5% (10,585)
Number of households with income $50k - 60k:
Lynden:
7.0% (3)
State:
7.3% (8,078)
Number of households with income $60k - 75k:
Lynden:
0.0% (0)
State:
8.7% (9,704)
Number of households with income $75k - 100k:
Lynden:
27.9% (12)
State:
12.9% (14,315)
Number of households with income $100k - 125k:
Lynden:
0.0% (0)
Washington:
7.7% (8,592)
Number of households with income $125k - 150k:
Lynden:
0.0% (0)
State:
8.9% (9,840)
Number of households with income $150k - 200k:
Lynden:
0.0% (0)
Washington:
7.6% (8,434)
Number of households with income > $200k:
Lynden:
65.1% (28)
State:
9.1% (10,075)
Aggregate household income in Lynden in 2022: $13,842,353
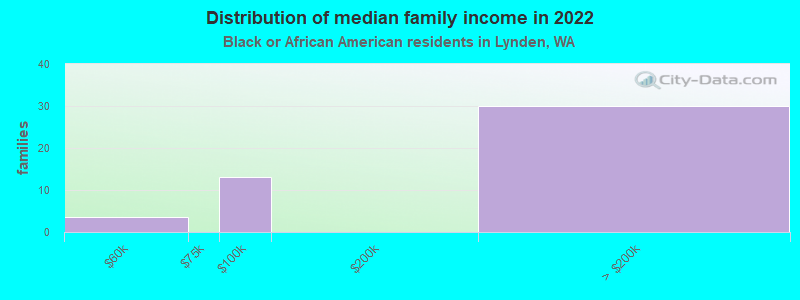
Median family income in Lynden in 2022:
Lynden:
$257,572
State:
$82,165
Number of families with income $50k - 60k:
Lynden:
7.5% (4)
State:
7.0% (4,687)
Number of families with income $75k - 100k:
Lynden:
28.2% (13)
Washington:
14.8% (9,876)
Number of families with income > $200k:
Lynden:
64.2% (30)
Washington:
12.0% (8,041)
Median per capita income in Lynden in 2022:
Lynden:
$84,662
State:
$38,209
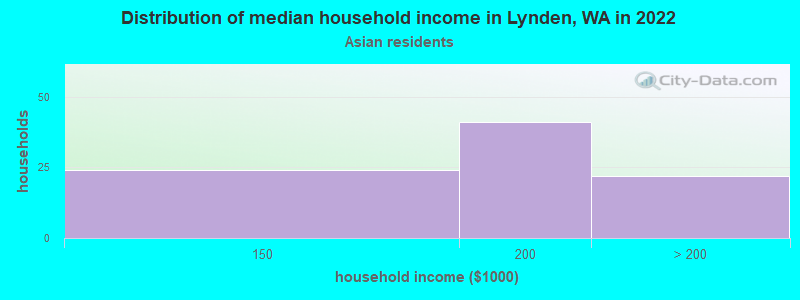
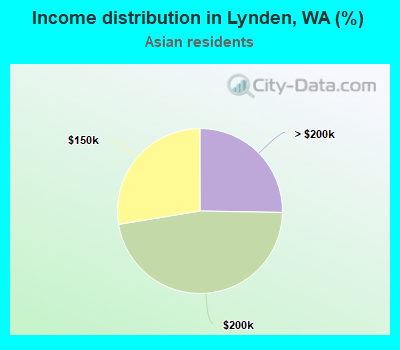
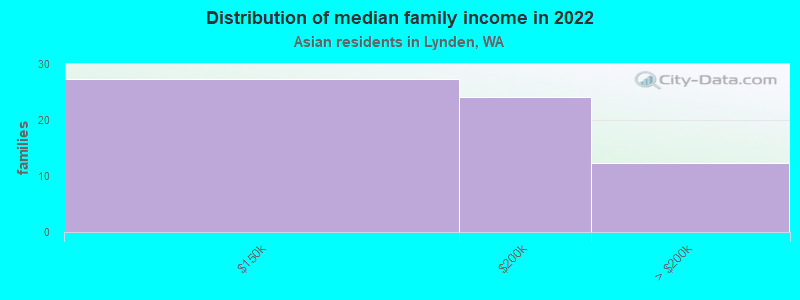
Income statistics for Asian residents
Median household income in Lynden, WA in 2022:
Lynden:
$179,346
State:
$125,692
Number of households with income < $10k:
Lynden:
0.0% (0)
Washington:
4.9% (14,099)
Number of households with income $10k - 20k:
Lynden:
0.0% (0)
State:
3.5% (9,873)
Number of households with income $20k - 30k:
Lynden:
0.0% (0)
State:
2.9% (8,352)
Number of households with income $30k - 40k:
Lynden:
0.0% (0)
State:
4.0% (11,415)
Number of households with income $40k - 50k:
Lynden:
0.0% (0)
Washington:
4.0% (11,421)
Number of households with income $50k - 60k:
Lynden:
0.0% (0)
Washington:
4.2% (12,100)
Number of households with income $60k - 75k:
Lynden:
0.0% (0)
State:
6.3% (17,903)
Number of households with income $75k - 100k:
Lynden:
0.0% (0)
State:
10.4% (29,663)
Number of households with income $100k - 125k:
Lynden:
0.0% (0)
State:
9.4% (26,839)
Number of households with income $125k - 150k:
Lynden:
27.6% (24)
State:
8.5% (24,200)
Number of households with income $150k - 200k:
Lynden:
47.1% (41)
State:
12.6% (35,976)
Number of households with income > $200k:
Lynden:
25.3% (22)
State:
29.2% (83,109)
Aggregate household income in Lynden in 2022: $16,060,268
Median family income in Lynden in 2022:
Lynden:
$210,492
Washington:
$143,595
Number of families with income $125k - 150k:
Lynden:
42.9% (27)
State:
8.4% (15,602)
Number of families with income $150k - 200k:
Lynden:
37.7% (24)
State:
13.3% (24,789)
Number of families with income > $200k:
Lynden:
19.5% (12)
State:
34.4% (64,250)
Median per capita income in Lynden in 2022:
Lynden:
$31,351
State:
$67,666
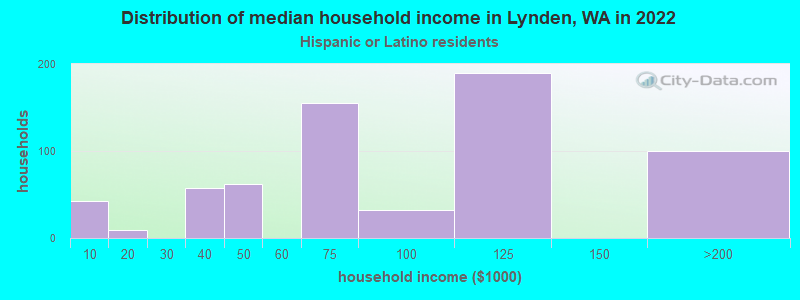
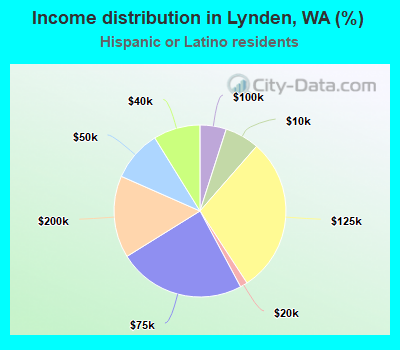
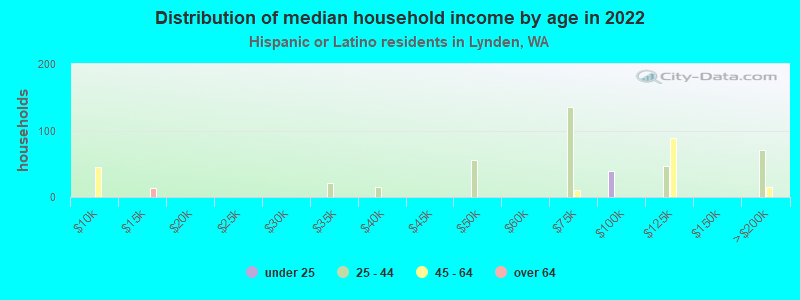
Income statistics for Hispanic or Latino residents
Median household income in Lynden, WA in 2022:
Lynden:
$69,877
Washington:
$74,770
Change in median household income between 2000 and 2022:
Lynden, Washington:
+101.3%
Washington:
+128.3%
Number of households with income < $10k:
Lynden:
6.5% (42)
Washington:
4.9% (14,456)
Number of households with income $10k - 20k:
Lynden:
1.4% (9)
State:
5.3% (15,449)
Number of households with income $20k - 30k:
Lynden:
0.0% (0)
Washington:
6.8% (20,016)
Number of households with income $30k - 40k:
Lynden:
8.8% (57)
Washington:
7.7% (22,548)
Number of households with income $40k - 50k:
Lynden:
9.6% (62)
State:
7.3% (21,450)
Number of households with income $50k - 60k:
Lynden:
0.0% (0)
State:
7.7% (22,744)
Number of households with income $60k - 75k:
Lynden:
24.0% (155)
State:
10.5% (30,737)
Number of households with income $75k - 100k:
Lynden:
4.9% (32)
State:
14.9% (43,843)
Number of households with income $100k - 125k:
Lynden:
29.4% (190)
Washington:
11.1% (32,554)
Number of households with income $125k - 150k:
Lynden:
0.0% (0)
State:
7.4% (21,624)
Number of households with income $150k - 200k:
Lynden:
15.5% (100)
Washington:
7.3% (21,360)
Number of households with income > $200k:
Lynden:
0.0% (0)
State:
9.2% (27,055)
Aggregate household income in Lynden in 2022: $46,795,268
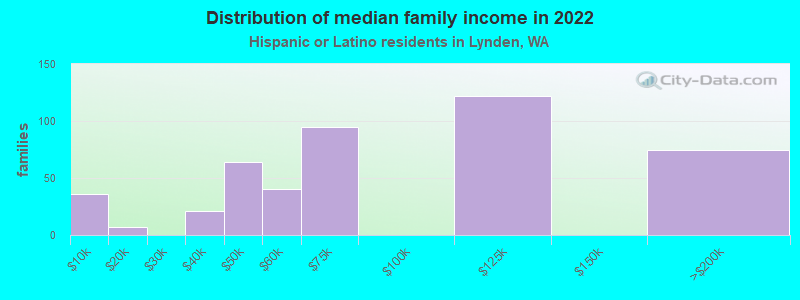
Median family income in Lynden in 2022:
Lynden:
$82,822
Washington:
$76,866
Number of families with income < $10k:
Lynden:
7.8% (36)
Washington:
4.4% (9,443)
Number of families with income $10k - 20k:
Lynden:
1.4% (7)
Washington:
3.5% (7,524)
Number of families with income $30k - 40k:
Lynden:
4.6% (21)
State:
8.3% (17,803)
Number of families with income $40k - 50k:
Lynden:
13.8% (64)
State:
7.7% (16,361)
Number of families with income $50k - 60k:
Lynden:
8.7% (40)
State:
7.9% (16,852)
Number of families with income $60k - 75k:
Lynden:
20.7% (95)
State:
11.4% (24,342)
Number of families with income $100k - 125k:
Lynden:
26.6% (122)
State:
11.4% (24,331)
Number of families with income $150k - 200k:
Lynden:
16.3% (75)
State:
8.2% (17,551)
Median non-family income in Lynden in 2022:
Lynden:
$64,267
State:
$54,173
Median per capita income in Lynden in 2022:
Lynden:
$19,666
State:
$28,252
Change in median per capita income between 2000 and 2022:
Lynden, Washington:
+129.8%
State:
+150.2%
Income statistics for American Indian and Alaska Native residents
Aggregate household income in Lynden in 2022: $1,347,969
Median per capita income in Lynden in 2022:
Lynden:
$13,116
Washington:
$27,053
Change in median per capita income between 2000 and 2022:: -58.5%
Lynden, Washington:
-58.5%
Washington:
+98.6%
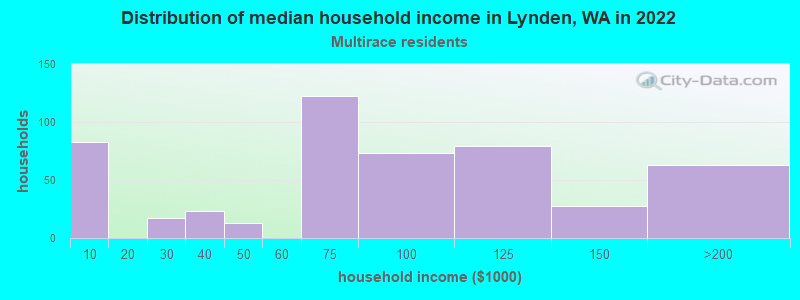
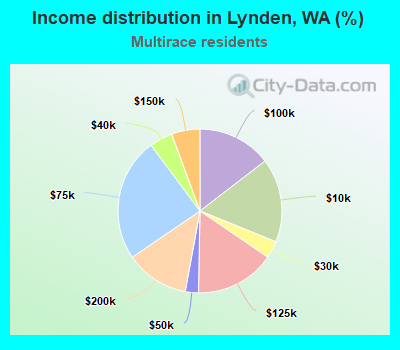
Income statistics for Multirace residents
Median household income in Lynden, WA in 2022:
Lynden:
$83,995
State:
$84,303
Change in median household income between 2000 and 2022:: -17.9%
Lynden, Washington:
-17.9%
Washington:
+125.7%
Number of households with income < $10k:
Lynden:
16.6% (83)
State:
4.3% (12,040)
Number of households with income $10k - 20k:
Lynden:
0.0% (0)
Washington:
6.6% (18,437)
Number of households with income $20k - 30k:
Lynden:
3.4% (17)
Washington:
5.2% (14,559)
Number of households with income $30k - 40k:
Lynden:
4.6% (23)
State:
6.7% (18,491)
Number of households with income $40k - 50k:
Lynden:
2.6% (13)
State:
6.3% (17,459)
Number of households with income $50k - 60k:
Lynden:
0.0% (0)
State:
6.9% (19,086)
Number of households with income $60k - 75k:
Lynden:
24.4% (122)
Washington:
9.1% (25,310)
Number of households with income $75k - 100k:
Lynden:
14.6% (73)
Washington:
13.5% (37,493)
Number of households with income $100k - 125k:
Lynden:
15.8% (79)
State:
10.7% (29,626)
Number of households with income $125k - 150k:
Lynden:
5.6% (28)
State:
8.6% (23,899)
Number of households with income $150k - 200k:
Lynden:
12.6% (63)
Washington:
10.2% (28,214)
Number of households with income > $200k:
Lynden:
0.0% (0)
State:
11.9% (32,947)
Aggregate household income in Lynden in 2022: $39,309,515
Median family income in Lynden in 2022:
Lynden:
$101,400
Washington:
$95,629
Number of families with income < $10k:
Lynden:
11.8% (47)
Washington:
3.5% (6,121)
Number of families with income $20k - 30k:
Lynden:
7.3% (29)
State:
4.4% (7,775)
Number of families with income $60k - 75k:
Lynden:
13.4% (54)
State:
9.7% (17,113)
Number of families with income $75k - 100k:
Lynden:
13.0% (52)
State:
13.6% (23,984)
Number of families with income $100k - 125k:
Lynden:
32.5% (130)
State:
10.4% (18,288)
Number of families with income $125k - 150k:
Lynden:
12.2% (49)
State:
10.5% (18,481)
Number of families with income $150k - 200k:
Lynden:
9.8% (39)
State:
11.9% (20,852)
Median non-family income in Lynden in 2022:
Lynden:
$52,991
State:
$56,573
Median per capita income in Lynden in 2022:
Lynden:
$21,110
State:
$32,496
Change in median per capita income between 2000 and 2022:
Lynden, Washington:
+92.6%
State:
+156.8%
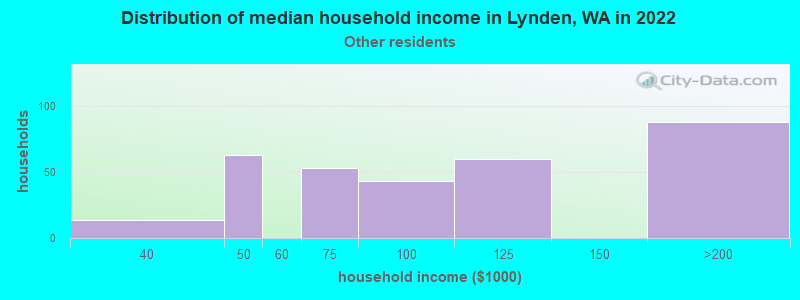
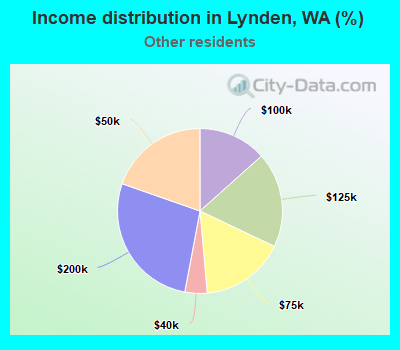
Income statistics for other residents
Median household income in Lynden, WA in 2022:
Lynden:
$149,350
Washington:
$69,545
Number of households with income < $10k:
Lynden:
0.0% (0)
Washington:
5.3% (6,540)
Number of households with income $10k - 20k:
Lynden:
0.0% (0)
State:
6.0% (7,385)
Number of households with income $20k - 30k:
Lynden:
0.0% (0)
State:
7.5% (9,289)
Number of households with income $30k - 40k:
Lynden:
4.4% (14)
State:
8.9% (11,015)
Number of households with income $40k - 50k:
Lynden:
19.6% (63)
Washington:
7.6% (9,399)
Number of households with income $50k - 60k:
Lynden:
0.0% (0)
State:
7.2% (8,867)
Number of households with income $60k - 75k:
Lynden:
16.5% (53)
State:
10.5% (13,032)
Number of households with income $75k - 100k:
Lynden:
13.4% (43)
State:
14.6% (18,007)
Number of households with income $100k - 125k:
Lynden:
18.7% (60)
State:
12.2% (15,128)
Number of households with income $125k - 150k:
Lynden:
0.0% (0)
State:
5.6% (6,950)
Number of households with income $150k - 200k:
Lynden:
27.4% (88)
State:
7.1% (8,749)
Number of households with income > $200k:
Lynden:
0.0% (0)
State:
7.5% (9,208)
Aggregate household income in Lynden in 2022: $21,204,388
Median per capita income in Lynden in 2022:
Lynden:
$19,518
State:
$27,542
Discuss Lynden, Washington (WA) on our hugely popular Washington forum.