The median household income in Lynn, MA in 2022 was $62,374, which was 51.5% less than the median annual income of $94,488 across the entire state of Massachusetts. Compared to the median income of $37,364 in 2000 this represents an increase of 40.1%. The per capita income in 2022 was $29,999, which means an increase of 41.7% compared to 2000 when it was $17,492.
Whole page based on the data from 2000 / 2022 when the population of Lynn, Massachusetts was 89,050 / 100,892
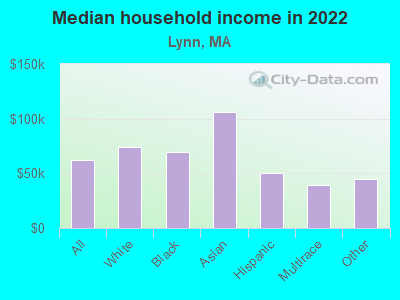
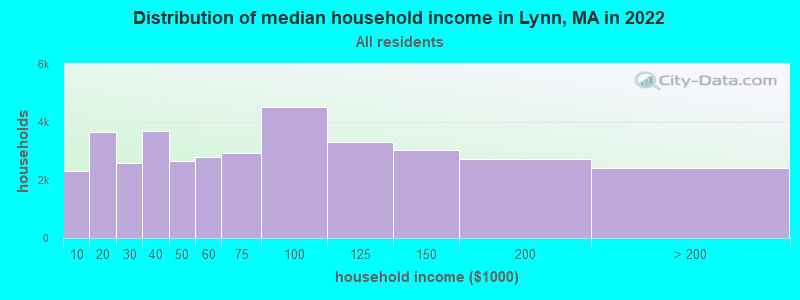
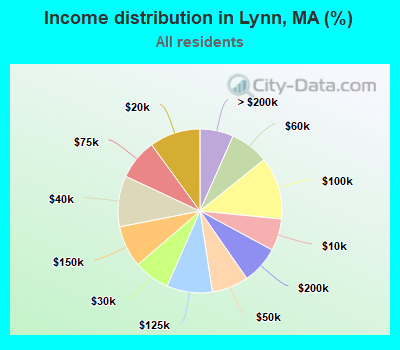
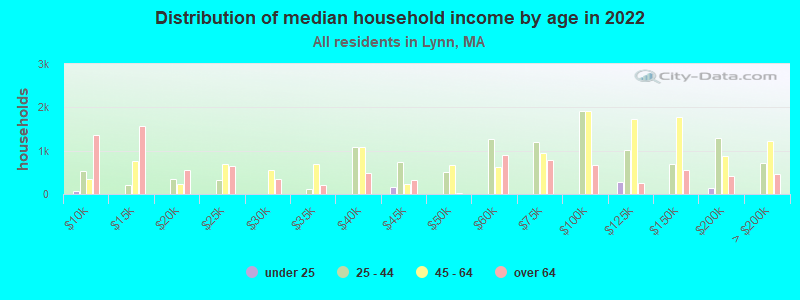
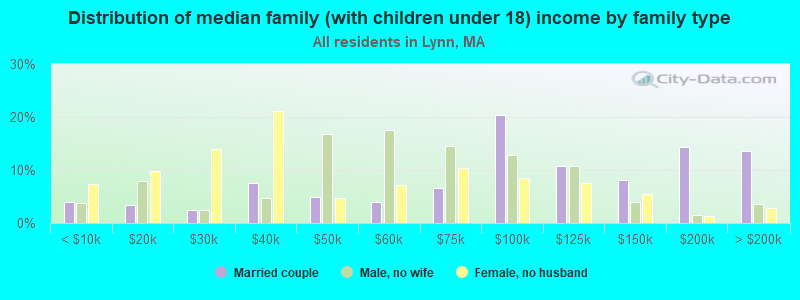
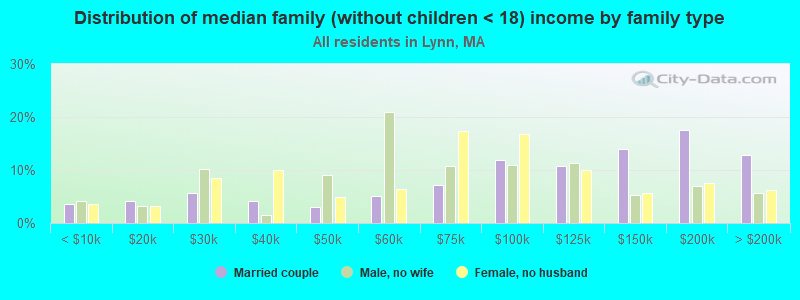
Income statistics for all residents
Median household income in Lynn, MA in 2022:
Lynn:
$62,374
Massachusetts:
$94,488
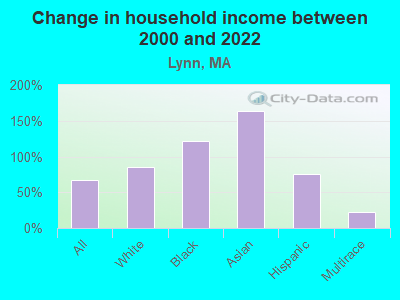
Change in median household income between 2000 and 2022:
Lynn, Massachusetts:
+66.9%
State:
+87.1%
Number of households with income < $10k:
Lynn:
6.3% (2,310)
State:
5.2% (146,170)
Number of households with income $10k - 20k:
Lynn:
10.0% (3,668)
State:
6.4% (180,001)
Number of households with income $20k - 30k:
Lynn:
7.1% (2,588)
State:
5.6% (156,667)
Number of households with income $30k - 40k:
Lynn:
10.0% (3,676)
State:
5.6% (157,168)
Number of households with income $40k - 50k:
Lynn:
7.2% (2,648)
Massachusetts:
5.4% (151,455)
Number of households with income $50k - 60k:
Lynn:
7.6% (2,789)
Massachusetts:
5.1% (142,726)
Number of households with income $60k - 75k:
Lynn:
8.0% (2,930)
State:
7.6% (212,203)
Number of households with income $75k - 100k:
Lynn:
12.3% (4,515)
Massachusetts:
11.3% (317,064)
Number of households with income $100k - 125k:
Lynn:
9.0% (3,295)
Massachusetts:
9.7% (270,603)
Number of households with income $125k - 150k:
Lynn:
8.3% (3,019)
State:
8.0% (223,140)
Number of households with income $150k - 200k:
Lynn:
7.5% (2,730)
State:
11.0% (308,695)
Number of households with income > $200k:
Lynn:
6.6% (2,419)
State:
19.0% (531,884)
Aggregate household income in Lynn in 2022: $2,981,246,000
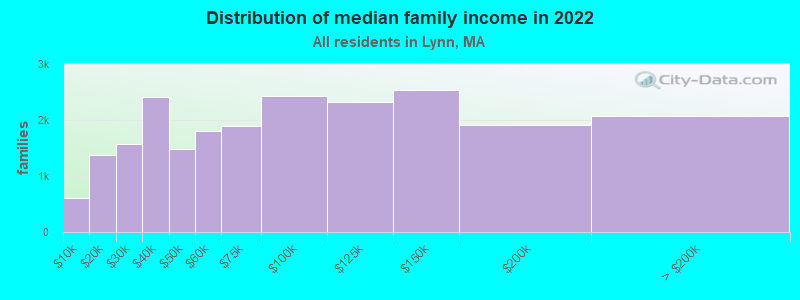
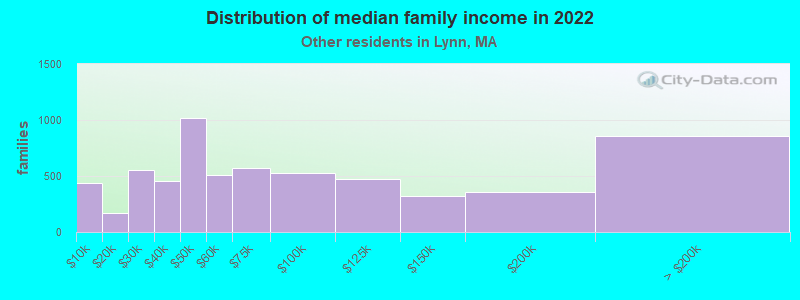
Median family income in Lynn in 2022:
Lynn:
$76,454
State:
$120,263
Number of families with income < $10k:
Lynn:
2.7% (606)
Massachusetts:
2.9% (49,671)
Number of families with income $10k - 20k:
Lynn:
6.1% (1,370)
Massachusetts:
2.9% (50,542)
Number of families with income $20k - 30k:
Lynn:
7.0% (1,574)
State:
3.9% (66,398)
Number of families with income $30k - 40k:
Lynn:
10.7% (2,405)
State:
4.5% (78,234)
Number of families with income $40k - 50k:
Lynn:
6.6% (1,476)
Massachusetts:
4.5% (77,656)
Number of families with income $50k - 60k:
Lynn:
8.0% (1,797)
Massachusetts:
4.5% (77,928)
Number of families with income $60k - 75k:
Lynn:
8.4% (1,884)
State:
7.0% (120,295)
Number of families with income $75k - 100k:
Lynn:
10.8% (2,427)
State:
11.1% (192,172)
Number of families with income $100k - 125k:
Lynn:
10.4% (2,325)
State:
10.6% (182,105)
Number of families with income $125k - 150k:
Lynn:
11.4% (2,544)
Massachusetts:
9.3% (159,566)
Number of families with income $150k - 200k:
Lynn:
8.5% (1,903)
State:
13.4% (231,410)
Number of families with income > $200k:
Lynn:
9.3% (2,077)
State:
25.4% (438,378)
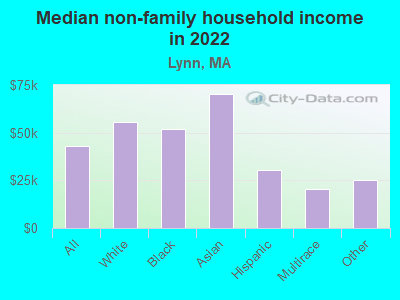
Median non-family income in Lynn in 2022:
Lynn:
$42,910
State:
$55,979
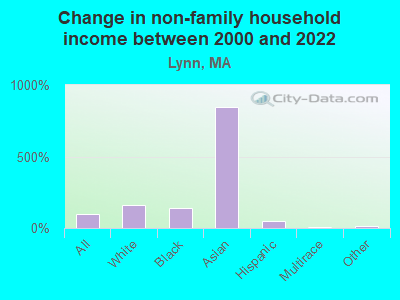
Change in median non-family income between 2000 and 2022:
Lynn, Massachusetts:
+98.7%
Massachusetts:
+88.0%
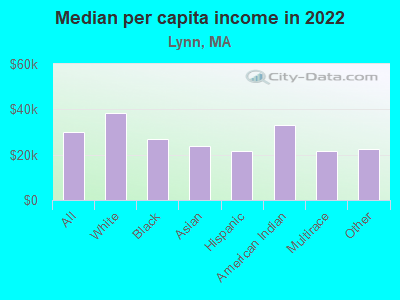
Median per capita income in Lynn in 2022:
Lynn:
$29,999
State:
$54,025
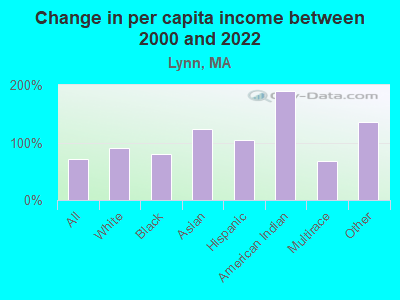
Change in median per capita income between 2000 and 2022:
Lynn, Massachusetts:
+71.5%
State:
+108.2%
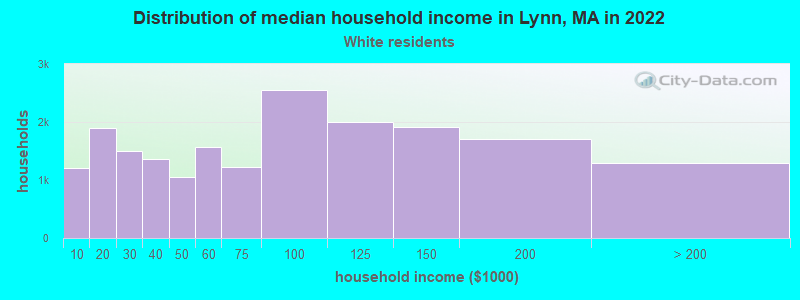
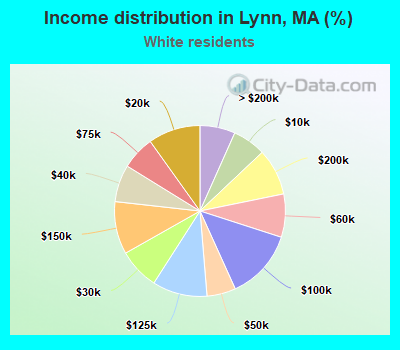
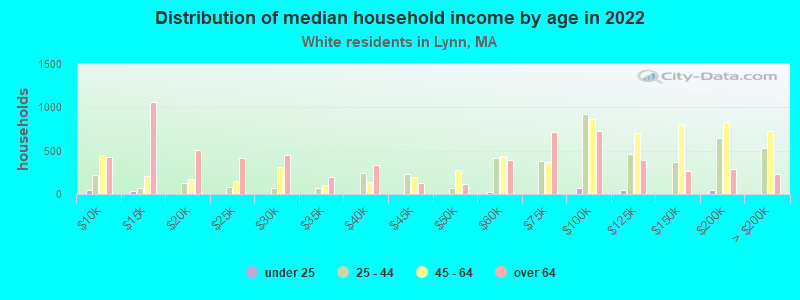
Income statistics for White residents
Median household income in Lynn, MA in 2022:
Lynn:
$74,082
Massachusetts:
$101,391
Change in median household income between 2000 and 2022:
Lynn, Massachusetts:
+85.1%
Massachusetts:
+93.3%
Number of households with income < $10k:
Lynn:
6.3% (1,211)
State:
4.4% (91,120)
Number of households with income $10k - 20k:
Lynn:
9.9% (1,904)
State:
5.9% (122,055)
Number of households with income $20k - 30k:
Lynn:
7.7% (1,492)
Massachusetts:
5.1% (105,311)
Number of households with income $30k - 40k:
Lynn:
7.0% (1,358)
Massachusetts:
5.3% (110,239)
Number of households with income $40k - 50k:
Lynn:
5.4% (1,050)
State:
5.0% (104,636)
Number of households with income $50k - 60k:
Lynn:
8.2% (1,577)
State:
4.8% (99,486)
Number of households with income $60k - 75k:
Lynn:
6.3% (1,217)
State:
7.5% (155,124)
Number of households with income $75k - 100k:
Lynn:
13.3% (2,559)
State:
11.4% (236,252)
Number of households with income $100k - 125k:
Lynn:
10.4% (2,002)
State:
9.9% (204,731)
Number of households with income $125k - 150k:
Lynn:
10.0% (1,921)
State:
8.5% (175,324)
Number of households with income $150k - 200k:
Lynn:
8.8% (1,703)
State:
11.7% (242,980)
Number of households with income > $200k:
Lynn:
6.7% (1,289)
State:
20.5% (425,966)
Aggregate household income in Lynn in 2022: $1,679,246,400
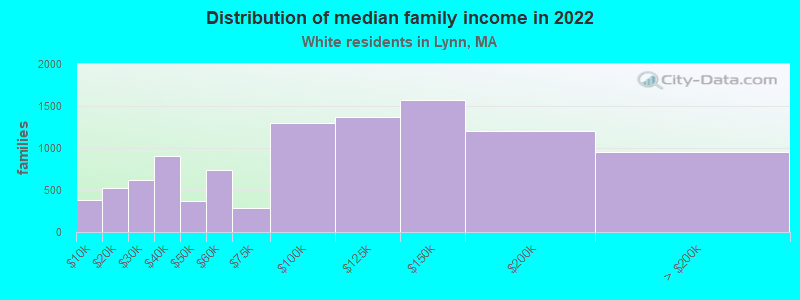
Median family income in Lynn in 2022:
Lynn:
$96,304
Massachusetts:
$133,153
Number of families with income < $10k:
Lynn:
3.7% (379)
State:
2.0% (25,038)
Number of families with income $10k - 20k:
Lynn:
5.1% (521)
State:
2.1% (26,403)
Number of families with income $20k - 30k:
Lynn:
6.1% (625)
State:
2.6% (32,525)
Number of families with income $30k - 40k:
Lynn:
8.9% (908)
State:
3.9% (48,079)
Number of families with income $40k - 50k:
Lynn:
3.6% (366)
State:
3.8% (46,908)
Number of families with income $50k - 60k:
Lynn:
7.3% (743)
State:
3.8% (46,476)
Number of families with income $60k - 75k:
Lynn:
2.8% (290)
Massachusetts:
6.4% (79,040)
Number of families with income $75k - 100k:
Lynn:
12.7% (1,296)
Massachusetts:
11.1% (137,395)
Number of families with income $100k - 125k:
Lynn:
13.4% (1,366)
State:
11.1% (136,771)
Number of families with income $125k - 150k:
Lynn:
15.4% (1,572)
State:
10.0% (123,709)
Number of families with income $150k - 200k:
Lynn:
11.7% (1,199)
State:
14.7% (181,602)
Number of families with income > $200k:
Lynn:
9.3% (947)
Massachusetts:
28.5% (351,887)
Median non-family income in Lynn in 2022:
Lynn:
$55,636
State:
$59,323
Median per capita income in Lynn in 2022:
Lynn:
$38,437
Massachusetts:
$60,804
Change in median per capita income between 2000 and 2022:
Lynn, Massachusetts:
+91.3%
Massachusetts:
+118.7%
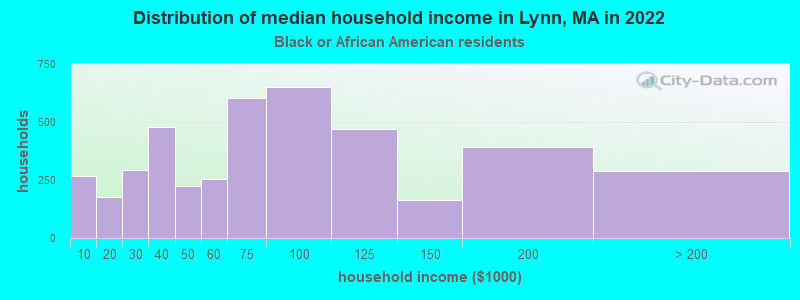
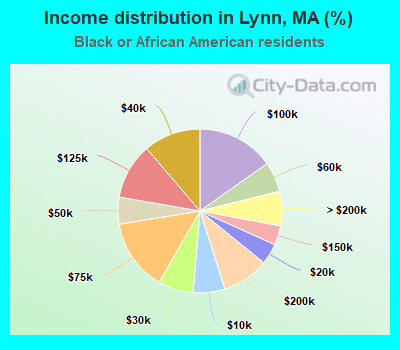
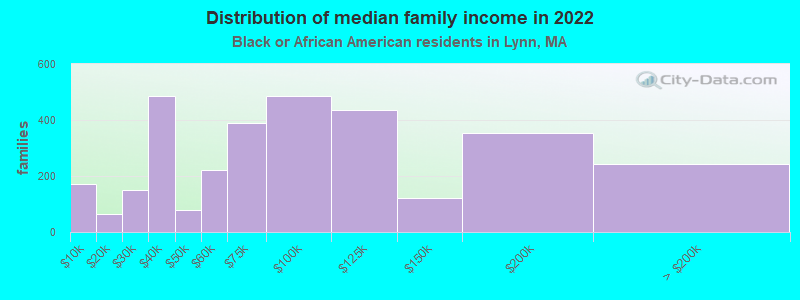
Income statistics for Black or African American residents
Median household income in Lynn, MA in 2022:
Lynn:
$69,603
State:
$63,189
Change in median household income between 2000 and 2022:
Lynn, Massachusetts:
+120.7%
State:
+87.4%
Number of households with income < $10k:
Lynn:
6.3% (268)
State:
9.1% (15,797)
Number of households with income $10k - 20k:
Lynn:
4.1% (175)
State:
9.4% (16,267)
Number of households with income $20k - 30k:
Lynn:
6.9% (295)
Massachusetts:
7.8% (13,520)
Number of households with income $30k - 40k:
Lynn:
11.2% (479)
Massachusetts:
8.3% (14,412)
Number of households with income $40k - 50k:
Lynn:
5.3% (226)
Massachusetts:
7.9% (13,790)
Number of households with income $50k - 60k:
Lynn:
5.9% (253)
State:
5.8% (10,041)
Number of households with income $60k - 75k:
Lynn:
14.1% (602)
State:
8.5% (14,822)
Number of households with income $75k - 100k:
Lynn:
15.2% (649)
State:
11.0% (19,122)
Number of households with income $100k - 125k:
Lynn:
11.0% (470)
State:
8.4% (14,575)
Number of households with income $125k - 150k:
Lynn:
3.8% (163)
State:
6.0% (10,429)
Number of households with income $150k - 200k:
Lynn:
9.2% (393)
Massachusetts:
7.2% (12,539)
Number of households with income > $200k:
Lynn:
6.8% (288)
State:
10.5% (18,185)
Aggregate household income in Lynn in 2022: $300,428,700
Median family income in Lynn in 2022:
Lynn:
$71,313
Massachusetts:
$79,815
Number of families with income < $10k:
Lynn:
5.4% (173)
Massachusetts:
6.3% (6,915)
Number of families with income $10k - 20k:
Lynn:
2.0% (64)
Massachusetts:
6.8% (7,412)
Number of families with income $20k - 30k:
Lynn:
4.7% (150)
Massachusetts:
6.6% (7,274)
Number of families with income $30k - 40k:
Lynn:
15.1% (484)
State:
6.4% (7,002)
Number of families with income $40k - 50k:
Lynn:
2.5% (79)
State:
7.9% (8,656)
Number of families with income $50k - 60k:
Lynn:
6.9% (220)
Massachusetts:
6.4% (6,986)
Number of families with income $60k - 75k:
Lynn:
12.2% (391)
Massachusetts:
7.9% (8,699)
Number of families with income $75k - 100k:
Lynn:
15.2% (486)
State:
11.5% (12,654)
Number of families with income $100k - 125k:
Lynn:
13.5% (434)
State:
10.4% (11,452)
Number of families with income $125k - 150k:
Lynn:
3.8% (122)
State:
7.5% (8,277)
Number of families with income $150k - 200k:
Lynn:
11.1% (355)
State:
9.3% (10,230)
Number of families with income > $200k:
Lynn:
7.6% (244)
State:
12.9% (14,108)
Median non-family income in Lynn in 2022:
Lynn:
$51,906
State:
$38,934
Change in median non-family income between 2000 and 2022:
Lynn, Massachusetts:
+136.9%
Massachusetts:
+69.2%
Median per capita income in Lynn in 2022:
Lynn:
$26,765
State:
$33,524
Change in median per capita income between 2000 and 2022:
Lynn, Massachusetts:
+80.1%
State:
+109.4%
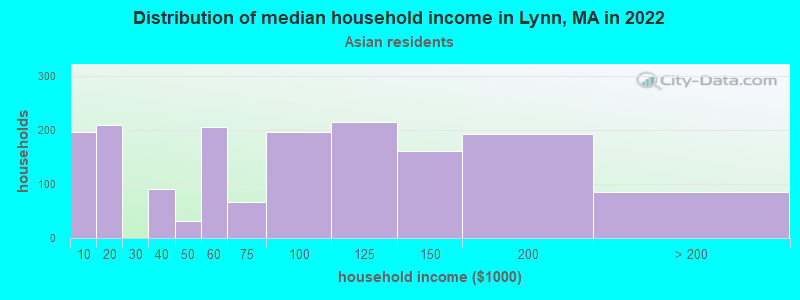
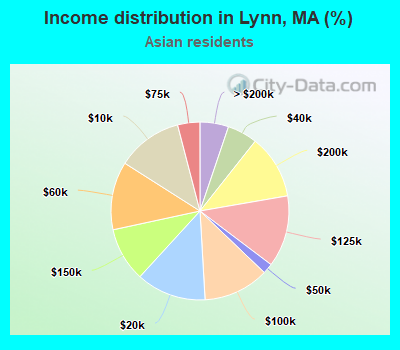
Income statistics for Asian residents
Median household income in Lynn, MA in 2022:
Lynn:
$105,713
State:
$117,855
Number of households with income < $10k:
Lynn:
11.9% (197)
Massachusetts:
6.8% (11,982)
Number of households with income $10k - 20k:
Lynn:
12.7% (210)
State:
4.8% (8,376)
Number of households with income $20k - 30k:
Lynn:
0.0% (0)
Massachusetts:
3.7% (6,558)
Number of households with income $30k - 40k:
Lynn:
5.4% (90)
State:
3.3% (5,748)
Number of households with income $40k - 50k:
Lynn:
1.9% (31)
Massachusetts:
4.1% (7,192)
Number of households with income $50k - 60k:
Lynn:
12.4% (205)
State:
5.0% (8,734)
Number of households with income $60k - 75k:
Lynn:
4.1% (67)
State:
5.8% (10,203)
Number of households with income $75k - 100k:
Lynn:
11.9% (197)
Massachusetts:
8.6% (15,154)
Number of households with income $100k - 125k:
Lynn:
13.0% (215)
State:
10.8% (18,942)
Number of households with income $125k - 150k:
Lynn:
9.8% (162)
State:
8.0% (14,037)
Number of households with income $150k - 200k:
Lynn:
11.6% (192)
Massachusetts:
12.5% (21,856)
Number of households with income > $200k:
Lynn:
5.2% (86)
State:
26.6% (46,694)
Aggregate household income in Lynn in 2022: $208,279,400
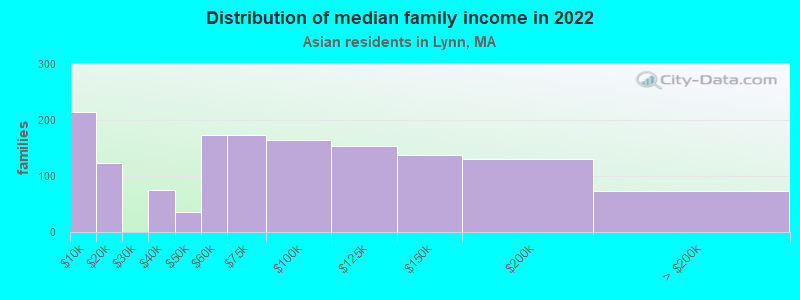
Median family income in Lynn in 2022:
Lynn:
$107,346
Massachusetts:
$140,113
Number of families with income < $10k:
Lynn:
14.8% (215)
State:
3.2% (3,752)
Number of families with income $10k - 20k:
Lynn:
8.5% (124)
Massachusetts:
3.5% (4,118)
Number of families with income $30k - 40k:
Lynn:
5.1% (75)
State:
2.8% (3,234)
Number of families with income $40k - 50k:
Lynn:
2.5% (36)
State:
3.9% (4,621)
Number of families with income $50k - 60k:
Lynn:
11.9% (174)
Massachusetts:
3.9% (4,606)
Number of families with income $60k - 75k:
Lynn:
12.0% (174)
State:
6.1% (7,105)
Number of families with income $75k - 100k:
Lynn:
11.3% (164)
State:
8.5% (10,022)
Number of families with income $100k - 125k:
Lynn:
10.6% (154)
State:
10.0% (11,697)
Number of families with income $125k - 150k:
Lynn:
9.4% (137)
Massachusetts:
8.6% (10,071)
Number of families with income $150k - 200k:
Lynn:
9.0% (130)
Massachusetts:
13.2% (15,478)
Number of families with income > $200k:
Lynn:
5.0% (73)
State:
34.0% (39,856)
Median non-family income in Lynn in 2022:
Lynn:
$70,500
State:
$71,440
Median per capita income in Lynn in 2022:
Lynn:
$23,979
State:
$58,900
Change in median per capita income between 2000 and 2022:
Lynn, Massachusetts:
+122.8%
State:
+174.6%
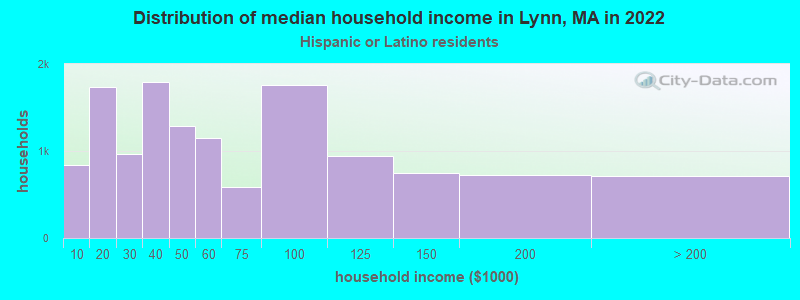
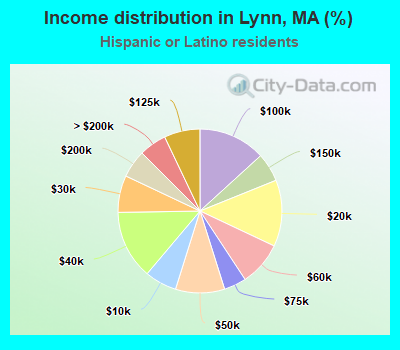
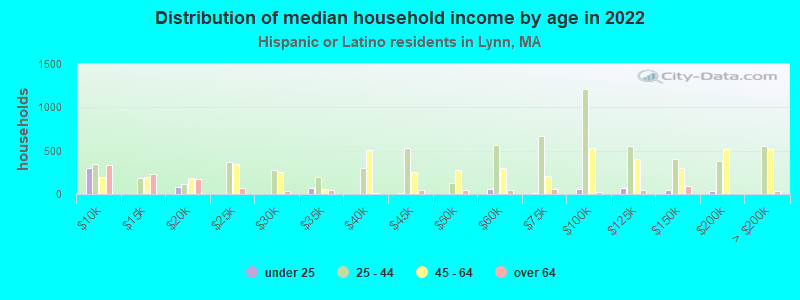
Income statistics for Hispanic or Latino residents
Median household income in Lynn, MA in 2022:
Lynn:
$49,978
Massachusetts:
$61,523
Change in median household income between 2000 and 2022:
Lynn, Massachusetts:
+76.4%
State:
+125.4%
Number of households with income < $10k:
Lynn:
6.3% (837)
State:
8.8% (25,307)
Number of households with income $10k - 20k:
Lynn:
13.1% (1,738)
State:
10.0% (28,653)
Number of households with income $20k - 30k:
Lynn:
7.3% (967)
State:
8.8% (25,189)
Number of households with income $30k - 40k:
Lynn:
13.6% (1,798)
State:
7.2% (20,822)
Number of households with income $40k - 50k:
Lynn:
9.7% (1,284)
Massachusetts:
7.2% (20,817)
Number of households with income $50k - 60k:
Lynn:
8.7% (1,155)
State:
6.5% (18,748)
Number of households with income $60k - 75k:
Lynn:
4.4% (583)
State:
8.8% (25,390)
Number of households with income $75k - 100k:
Lynn:
13.2% (1,753)
Massachusetts:
12.0% (34,488)
Number of households with income $100k - 125k:
Lynn:
7.1% (937)
State:
8.6% (24,599)
Number of households with income $125k - 150k:
Lynn:
5.7% (750)
State:
6.2% (17,743)
Number of households with income $150k - 200k:
Lynn:
5.5% (725)
Massachusetts:
7.3% (21,017)
Number of households with income > $200k:
Lynn:
5.4% (718)
State:
8.6% (24,606)
Aggregate household income in Lynn in 2022: $932,651,400
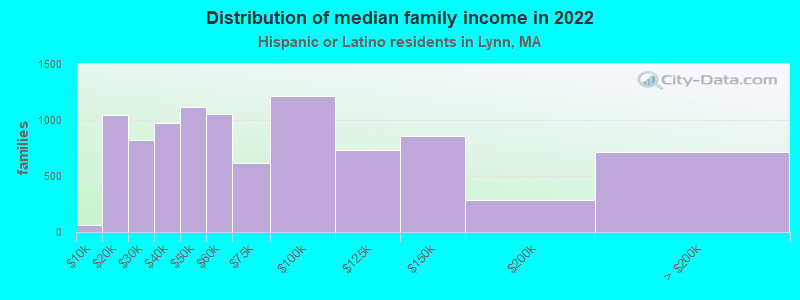
Median family income in Lynn in 2022:
Lynn:
$54,541
State:
$66,072
Number of families with income < $10k:
Lynn:
0.7% (62)
State:
6.2% (12,456)
Number of families with income $10k - 20k:
Lynn:
11.0% (1,043)
State:
6.0% (12,071)
Number of families with income $20k - 30k:
Lynn:
8.6% (820)
Massachusetts:
10.1% (20,376)
Number of families with income $30k - 40k:
Lynn:
10.2% (969)
State:
8.2% (16,470)
Number of families with income $40k - 50k:
Lynn:
11.8% (1,120)
Massachusetts:
7.4% (14,829)
Number of families with income $50k - 60k:
Lynn:
11.1% (1,055)
State:
7.3% (14,643)
Number of families with income $60k - 75k:
Lynn:
6.5% (617)
State:
10.6% (21,252)
Number of families with income $75k - 100k:
Lynn:
12.8% (1,211)
State:
12.0% (24,088)
Number of families with income $100k - 125k:
Lynn:
7.7% (731)
Massachusetts:
8.9% (17,954)
Number of families with income $125k - 150k:
Lynn:
9.0% (854)
State:
6.9% (13,837)
Number of families with income $150k - 200k:
Lynn:
3.0% (283)
State:
7.3% (14,683)
Number of families with income > $200k:
Lynn:
7.6% (718)
Massachusetts:
9.3% (18,741)
Median non-family income in Lynn in 2022:
Lynn:
$30,504
State:
$37,563
Change in median non-family income between 2000 and 2022:
Lynn, Massachusetts:
+46.4%
State:
+115.0%
Median per capita income in Lynn in 2022:
Lynn:
$21,413
Massachusetts:
$28,993
Change in median per capita income between 2000 and 2022:
Lynn, Massachusetts:
+105.0%
Massachusetts:
+142.4%
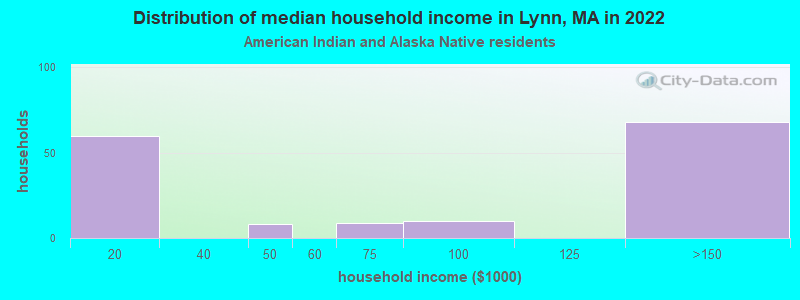
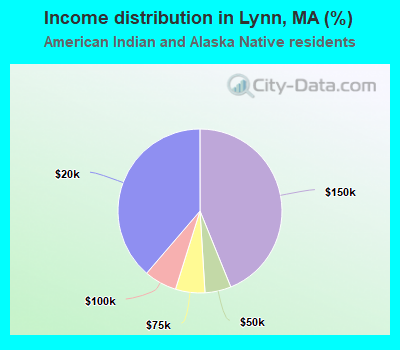
Income statistics for American Indian and Alaska Native residents
Number of households with income < $10k:
Lynn:
0.0% (0)
State:
6.6% (451)
Number of households with income $10k - 20k:
Lynn:
38.7% (60)
State:
7.0% (476)
Number of households with income $20k - 30k:
Lynn:
0.0% (0)
State:
2.8% (192)
Number of households with income $30k - 40k:
Lynn:
0.0% (0)
State:
3.2% (218)
Number of households with income $40k - 50k:
Lynn:
5.2% (8)
State:
2.9% (199)
Number of households with income $50k - 60k:
Lynn:
0.0% (0)
Massachusetts:
9.9% (677)
Number of households with income $60k - 75k:
Lynn:
5.8% (9)
Massachusetts:
11.5% (781)
Number of households with income $75k - 100k:
Lynn:
6.5% (10)
State:
9.2% (629)
Number of households with income $100k - 125k:
Lynn:
0.0% (0)
Massachusetts:
6.0% (406)
Number of households with income $125k - 150k:
Lynn:
43.9% (68)
Massachusetts:
13.5% (921)
Number of households with income $150k - 200k:
Lynn:
0.0% (0)
State:
12.6% (859)
Number of households with income > $200k:
Lynn:
0.0% (0)
Massachusetts:
14.7% (1,003)
Aggregate household income in Lynn in 2022: $18,107,624
Median per capita income in Lynn in 2022:
Lynn:
$32,895
State:
$39,434
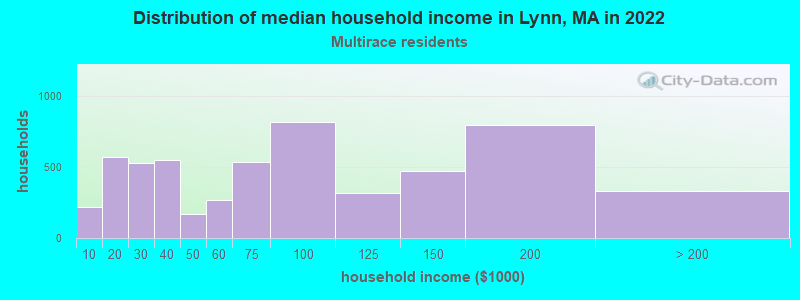
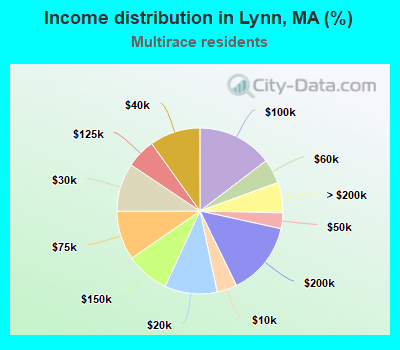
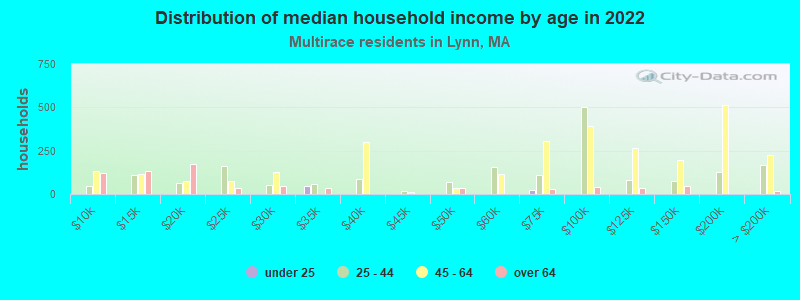
Income statistics for Multirace residents
Median household income in Lynn, MA in 2022:
Lynn:
$39,652
State:
$71,552
Change in median household income between 2000 and 2022:
Lynn, Massachusetts:
+22.6%
Massachusetts:
+109.0%
Number of households with income < $10k:
Lynn:
3.9% (218)
State:
6.6% (15,127)
Number of households with income $10k - 20k:
Lynn:
10.2% (569)
State:
9.2% (21,158)
Number of households with income $20k - 30k:
Lynn:
9.4% (525)
Massachusetts:
7.8% (18,016)
Number of households with income $30k - 40k:
Lynn:
9.9% (550)
Massachusetts:
7.9% (18,260)
Number of households with income $40k - 50k:
Lynn:
3.1% (171)
State:
5.6% (13,027)
Number of households with income $50k - 60k:
Lynn:
4.8% (267)
Massachusetts:
5.6% (12,909)
Number of households with income $60k - 75k:
Lynn:
9.5% (531)
State:
9.0% (20,800)
Number of households with income $75k - 100k:
Lynn:
14.7% (815)
State:
12.1% (27,875)
Number of households with income $100k - 125k:
Lynn:
5.7% (319)
Massachusetts:
8.1% (18,754)
Number of households with income $125k - 150k:
Lynn:
8.5% (472)
Massachusetts:
6.8% (15,621)
Number of households with income $150k - 200k:
Lynn:
14.3% (796)
State:
9.4% (21,618)
Number of households with income > $200k:
Lynn:
5.9% (329)
State:
12.0% (27,592)
Aggregate household income in Lynn in 2022: $304,839,300
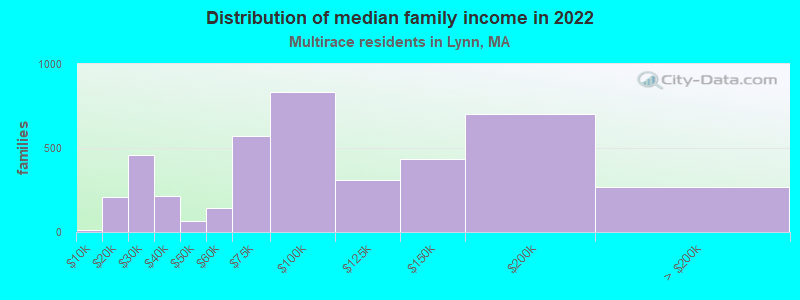
Median family income in Lynn in 2022:
Lynn:
$62,177
State:
$78,380
Number of families with income < $10k:
Lynn:
0.2% (10)
Massachusetts:
4.5% (7,017)
Number of families with income $10k - 20k:
Lynn:
4.9% (206)
State:
4.9% (7,678)
Number of families with income $20k - 30k:
Lynn:
10.8% (456)
Massachusetts:
8.5% (13,245)
Number of families with income $30k - 40k:
Lynn:
5.0% (212)
State:
8.2% (12,705)
Number of families with income $40k - 50k:
Lynn:
1.5% (63)
State:
5.3% (8,255)
Number of families with income $50k - 60k:
Lynn:
3.4% (142)
State:
6.7% (10,445)
Number of families with income $60k - 75k:
Lynn:
13.5% (569)
State:
10.3% (16,064)
Number of families with income $75k - 100k:
Lynn:
19.9% (835)
State:
12.1% (18,758)
Number of families with income $100k - 125k:
Lynn:
7.3% (309)
State:
7.9% (12,321)
Number of families with income $125k - 150k:
Lynn:
10.3% (433)
Massachusetts:
7.2% (11,128)
Number of families with income $150k - 200k:
Lynn:
16.7% (703)
State:
10.3% (15,978)
Number of families with income > $200k:
Lynn:
6.3% (265)
State:
14.0% (21,838)
Median non-family income in Lynn in 2022:
Lynn:
$20,447
State:
$42,253
Change in median non-family income between 2000 and 2022:
Lynn, Massachusetts:
+9.8%
State:
+93.7%
Median per capita income in Lynn in 2022:
Lynn:
$21,577
Massachusetts:
$34,029
Change in median per capita income between 2000 and 2022:
Lynn, Massachusetts:
+66.9%
State:
+132.1%
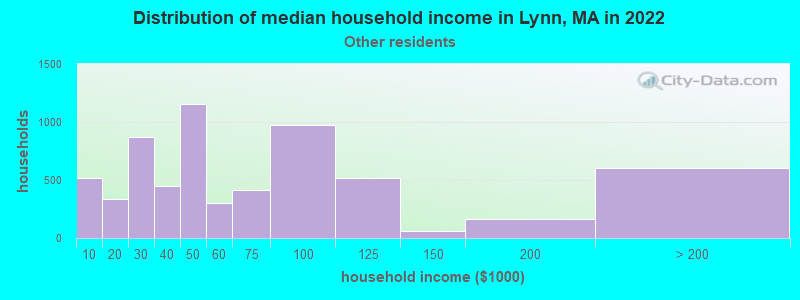
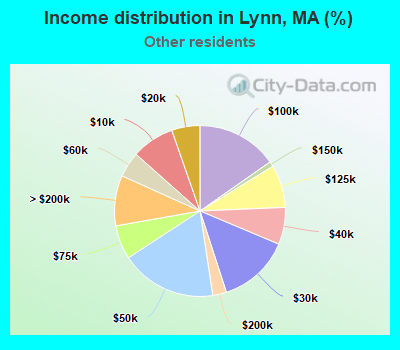
Income statistics for other residents
Median household income in Lynn, MA in 2022:
Lynn:
$44,607
State:
$61,039
Number of households with income < $10k:
Lynn:
8.1% (516)
Massachusetts:
8.4% (11,559)
Number of households with income $10k - 20k:
Lynn:
5.3% (340)
State:
8.4% (11,499)
Number of households with income $20k - 30k:
Lynn:
13.6% (869)
State:
9.5% (13,070)
Number of households with income $30k - 40k:
Lynn:
7.0% (447)
Massachusetts:
6.0% (8,291)
Number of households with income $40k - 50k:
Lynn:
18.2% (1,157)
State:
9.2% (12,611)
Number of households with income $50k - 60k:
Lynn:
4.8% (306)
Massachusetts:
7.9% (10,879)
Number of households with income $60k - 75k:
Lynn:
6.4% (410)
State:
7.5% (10,239)
Number of households with income $75k - 100k:
Lynn:
15.3% (974)
Massachusetts:
13.1% (18,032)
Number of households with income $100k - 125k:
Lynn:
8.1% (515)
State:
9.6% (13,141)
Number of households with income $125k - 150k:
Lynn:
1.0% (61)
Massachusetts:
5.0% (6,808)
Number of households with income $150k - 200k:
Lynn:
2.6% (167)
State:
6.4% (8,843)
Number of households with income > $200k:
Lynn:
9.5% (607)
State:
9.0% (12,396)
Aggregate household income in Lynn in 2022: $463,657,300
Median family income in Lynn in 2022:
Lynn:
$44,350
Massachusetts:
$66,840
Number of families with income < $10k:
Lynn:
7.0% (434)
State:
6.7% (6,769)
Number of families with income $10k - 20k:
Lynn:
2.7% (166)
State:
4.7% (4,798)
Number of families with income $20k - 30k:
Lynn:
8.9% (556)
Massachusetts:
10.4% (10,595)
Number of families with income $30k - 40k:
Lynn:
7.3% (453)
Massachusetts:
7.0% (7,154)
Number of families with income $40k - 50k:
Lynn:
16.3% (1,018)
State:
8.9% (9,052)
Number of families with income $50k - 60k:
Lynn:
8.1% (505)
State:
8.7% (8,850)
Number of families with income $60k - 75k:
Lynn:
9.2% (571)
Massachusetts:
8.5% (8,683)
Number of families with income $75k - 100k:
Lynn:
8.4% (523)
Massachusetts:
12.8% (12,997)
Number of families with income $100k - 125k:
Lynn:
7.6% (475)
State:
9.3% (9,480)
Number of families with income $125k - 150k:
Lynn:
5.2% (324)
State:
5.3% (5,373)
Number of families with income $150k - 200k:
Lynn:
5.7% (355)
State:
7.5% (7,659)
Number of families with income > $200k:
Lynn:
13.8% (860)
Massachusetts:
10.0% (10,188)
Median non-family income in Lynn in 2022:
Lynn:
$25,379
State:
$36,127
Change in median non-family income between 2000 and 2022:
Lynn, Massachusetts:
+13.4%
State:
+123.4%
Median per capita income in Lynn in 2022:
Lynn:
$22,332
Massachusetts:
$30,797
Change in median per capita income between 2000 and 2022: