The median household income in Lyons, IL in 2022 was $58,130, which was 32.0% less than the median annual income of $76,708 across the entire state of Illinois. Compared to the median income of $44,306 in 2000 this represents an increase of 23.8%. The per capita income in 2022 was $32,858, which means an increase of 38.6% compared to 2000 when it was $20,172.
Whole page based on the data from 2000 / 2022 when the population of Lyons, Illinois was 10,255 / 10,450
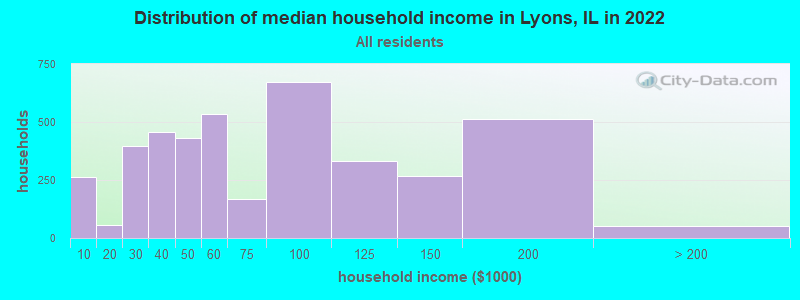
Income statistics for all residents
Median household income in Lyons, IL in 2022:
Lyons:
$58,131
Illinois:
$76,708
Change in median household income between 2000 and 2022:
Lyons, Illinois:
+31.2%
Illinois:
+64.6%
Number of households with income < $10k:
Lyons:
6.3% (262)
Illinois:
5.9% (296,090)
Number of households with income $10k - 20k:
Lyons:
1.4% (56)
State:
6.6% (333,259)
Number of households with income $20k - 30k:
Lyons:
9.5% (395)
State:
6.8% (342,921)
Number of households with income $30k - 40k:
Lyons:
11.0% (456)
State:
7.0% (355,254)
Number of households with income $40k - 50k:
Lyons:
10.5% (433)
State:
6.7% (340,678)
Number of households with income $50k - 60k:
Lyons:
12.9% (536)
State:
6.7% (339,405)
Number of households with income $60k - 75k:
Lyons:
4.1% (168)
State:
9.2% (465,709)
Number of households with income $75k - 100k:
Lyons:
16.3% (674)
State:
12.9% (651,353)
Number of households with income $100k - 125k:
Lyons:
8.0% (330)
State:
10.3% (522,359)
Number of households with income $125k - 150k:
Lyons:
6.5% (269)
Illinois:
7.3% (367,136)
Number of households with income $150k - 200k:
Lyons:
12.4% (513)
Illinois:
9.0% (455,249)
Number of households with income > $200k:
Lyons:
1.2% (51)
Illinois:
11.6% (586,947)
Aggregate household income in Lyons in 2022: $336,334,446
Median family income in Lyons in 2022:
Lyons:
$84,915
State:
$96,948
Number of families with income < $10k:
Lyons:
5.1% (123)
State:
3.4% (105,875)
Number of families with income $10k - 20k:
Lyons:
1.0% (25)
State:
3.3% (105,017)
Number of families with income $20k - 30k:
Lyons:
3.2% (78)
State:
4.7% (146,403)
Number of families with income $30k - 40k:
Lyons:
11.4% (276)
State:
5.3% (167,069)
Number of families with income $40k - 50k:
Lyons:
11.7% (284)
State:
5.8% (181,164)
Number of families with income $50k - 60k:
Lyons:
9.1% (221)
State:
6.1% (191,561)
Number of families with income $60k - 75k:
Lyons:
3.2% (79)
State:
9.0% (282,985)
Number of families with income $75k - 100k:
Lyons:
17.7% (429)
Illinois:
13.8% (432,725)
Number of families with income $100k - 125k:
Lyons:
7.4% (179)
Illinois:
11.9% (373,296)
Number of families with income $125k - 150k:
Lyons:
10.6% (259)
Illinois:
8.9% (279,791)
Number of families with income $150k - 200k:
Lyons:
18.6% (452)
State:
11.9% (372,004)
Number of families with income > $200k:
Lyons:
1.1% (26)
State:
15.9% (500,033)
Median non-family income in Lyons in 2022:
Lyons:
$46,839
State:
$46,533
Change in median non-family income between 2000 and 2022:
Lyons, Illinois:
+47.3%
State:
+64.0%
Median per capita income in Lyons in 2022:
Lyons:
$32,859
State:
$43,317
Change in median per capita income between 2000 and 2022:
Lyons, Illinois:
+62.9%
Illinois:
+87.5%
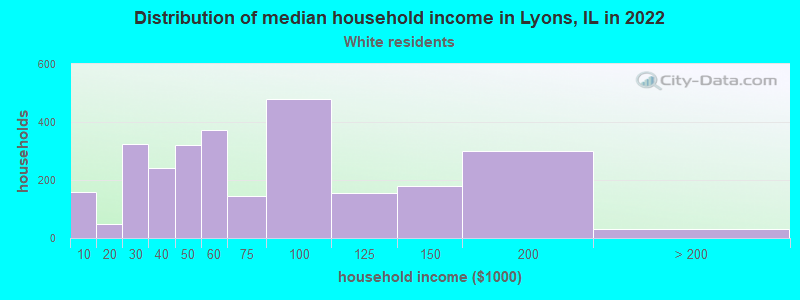
Income statistics for White residents
Median household income in Lyons, IL in 2022:
Lyons:
$56,815
State:
$83,346
Change in median household income between 2000 and 2022:
Lyons, Illinois:
+26.8%
State:
+67.5%
Number of households with income < $10k:
Lyons:
5.8% (159)
Illinois:
4.5% (149,895)
Number of households with income $10k - 20k:
Lyons:
1.8% (49)
State:
5.5% (184,529)
Number of households with income $20k - 30k:
Lyons:
11.8% (325)
State:
6.1% (205,767)
Number of households with income $30k - 40k:
Lyons:
8.7% (241)
Illinois:
6.7% (225,572)
Number of households with income $40k - 50k:
Lyons:
11.6% (320)
Illinois:
6.5% (216,965)
Number of households with income $50k - 60k:
Lyons:
13.5% (373)
State:
6.6% (222,841)
Number of households with income $60k - 75k:
Lyons:
5.3% (146)
Illinois:
9.3% (312,758)
Number of households with income $75k - 100k:
Lyons:
17.4% (480)
State:
12.9% (433,180)
Number of households with income $100k - 125k:
Lyons:
5.6% (154)
Illinois:
10.7% (360,753)
Number of households with income $125k - 150k:
Lyons:
6.5% (178)
Illinois:
7.9% (266,532)
Number of households with income $150k - 200k:
Lyons:
10.9% (300)
State:
10.0% (337,357)
Number of households with income > $200k:
Lyons:
1.2% (32)
State:
13.3% (446,069)
Aggregate household income in Lyons in 2022: $230,138,725
Median family income in Lyons in 2022:
Lyons:
$79,442
State:
$107,938
Number of families with income < $10k:
Lyons:
4.3% (59)
State:
2.2% (45,983)
Number of families with income $10k - 20k:
Lyons:
1.5% (21)
State:
2.5% (50,574)
Number of families with income $20k - 30k:
Lyons:
3.6% (49)
State:
3.5% (70,927)
Number of families with income $30k - 40k:
Lyons:
11.6% (160)
State:
4.4% (90,563)
Number of families with income $40k - 50k:
Lyons:
12.7% (176)
Illinois:
5.0% (102,597)
Number of families with income $50k - 60k:
Lyons:
10.3% (142)
State:
5.8% (119,129)
Number of families with income $60k - 75k:
Lyons:
4.0% (56)
State:
8.8% (179,665)
Number of families with income $75k - 100k:
Lyons:
17.8% (245)
State:
13.5% (276,887)
Number of families with income $100k - 125k:
Lyons:
3.9% (53)
Illinois:
12.5% (256,099)
Number of families with income $125k - 150k:
Lyons:
11.8% (163)
State:
9.8% (199,855)
Number of families with income $150k - 200k:
Lyons:
17.9% (246)
State:
13.4% (274,569)
Number of families with income > $200k:
Lyons:
0.6% (8)
Illinois:
18.6% (381,354)
Median non-family income in Lyons in 2022:
Lyons:
$50,141
State:
$50,934
Change in median non-family income between 2000 and 2022:
Lyons, Illinois:
+55.2%
State:
+70.7%
Median per capita income in Lyons in 2022:
Lyons:
$37,222
State:
$50,738
Change in median per capita income between 2000 and 2022:
Lyons, Illinois:
+78.3%
Illinois:
+95.5%
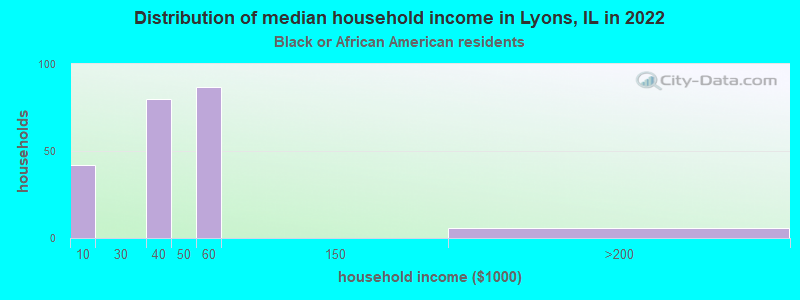
Income statistics for Black or African American residents
Median household income in Lyons, IL in 2022:
Lyons:
$37,676
Illinois:
$45,019
Change in median household income between 2000 and 2022:
Lyons, Illinois:
+76.0%
State:
+42.0%
Number of households with income < $10k:
Lyons:
19.5% (42)
State:
13.3% (92,224)
Number of households with income $10k - 20k:
Lyons:
0.0% (0)
Illinois:
13.5% (93,732)
Number of households with income $20k - 30k:
Lyons:
0.0% (0)
State:
9.9% (68,453)
Number of households with income $30k - 40k:
Lyons:
37.2% (80)
Illinois:
8.5% (59,072)
Number of households with income $40k - 50k:
Lyons:
0.0% (0)
State:
7.9% (55,033)
Number of households with income $50k - 60k:
Lyons:
40.5% (87)
State:
7.2% (49,556)
Number of households with income $60k - 75k:
Lyons:
0.0% (0)
Illinois:
7.8% (53,726)
Number of households with income $75k - 100k:
Lyons:
0.0% (0)
State:
11.6% (80,439)
Number of households with income $100k - 125k:
Lyons:
0.0% (0)
State:
7.5% (52,244)
Number of households with income $125k - 150k:
Lyons:
0.0% (0)
State:
3.9% (27,058)
Number of households with income $150k - 200k:
Lyons:
2.8% (6)
State:
4.6% (32,057)
Number of households with income > $200k:
Lyons:
0.0% (0)
Illinois:
4.1% (28,731)
Aggregate household income in Lyons in 2022: $8,989,445
Median per capita income in Lyons in 2022:
Lyons:
$28,923
Illinois:
$28,045
Change in median per capita income between 2000 and 2022:
Lyons, Illinois:
+16.2%
State:
+90.2%
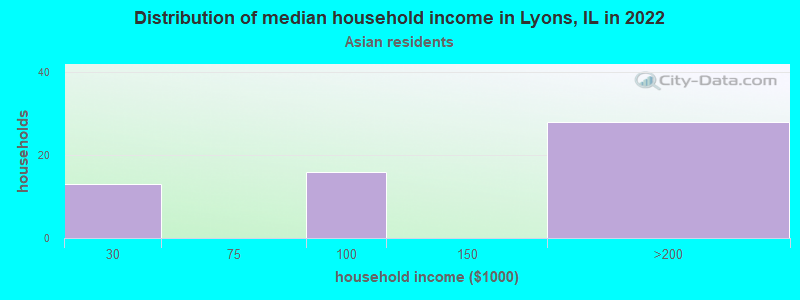
Income statistics for Asian residents
Number of households with income < $10k:
Lyons:
0.0% (0)
State:
5.3% (14,653)
Number of households with income $10k - 20k:
Lyons:
0.0% (0)
Illinois:
4.5% (12,283)
Number of households with income $20k - 30k:
Lyons:
22.8% (13)
State:
4.8% (13,135)
Number of households with income $30k - 40k:
Lyons:
0.0% (0)
State:
5.0% (13,655)
Number of households with income $40k - 50k:
Lyons:
0.0% (0)
State:
4.5% (12,357)
Number of households with income $50k - 60k:
Lyons:
0.0% (0)
State:
4.9% (13,568)
Number of households with income $60k - 75k:
Lyons:
0.0% (0)
Illinois:
7.1% (19,606)
Number of households with income $75k - 100k:
Lyons:
28.1% (16)
State:
12.1% (33,349)
Number of households with income $100k - 125k:
Lyons:
0.0% (0)
State:
9.7% (26,669)
Number of households with income $125k - 150k:
Lyons:
0.0% (0)
Illinois:
7.3% (20,172)
Number of households with income $150k - 200k:
Lyons:
49.1% (28)
State:
11.5% (31,711)
Number of households with income > $200k:
Lyons:
0.0% (0)
State:
23.1% (63,411)
Aggregate household income in Lyons in 2022: $6,620,998
Median per capita income in Lyons in 2022:
Lyons:
$20,426
State:
$52,977
Change in median per capita income between 2000 and 2022:
Lyons, Illinois:
+3.6%
State:
+119.5%
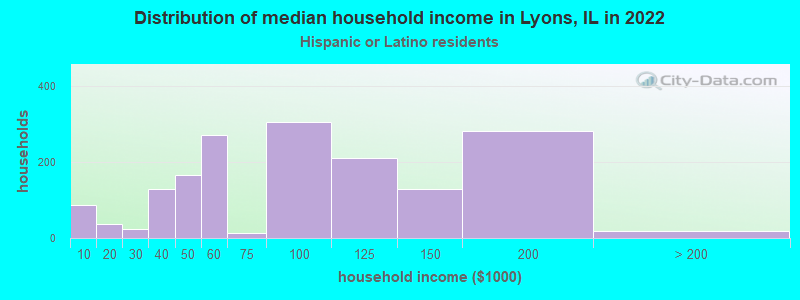
Income statistics for Hispanic or Latino residents
Median household income in Lyons, IL in 2022:
Lyons:
$84,114
Illinois:
$72,139
Change in median household income between 2000 and 2022:
Lyons, Illinois:
+83.9%
Illinois:
+75.7%
Number of households with income < $10k:
Lyons:
5.1% (86)
State:
4.9% (33,145)
Number of households with income $10k - 20k:
Lyons:
2.3% (38)
Illinois:
5.4% (36,345)
Number of households with income $20k - 30k:
Lyons:
1.4% (24)
State:
7.5% (50,677)
Number of households with income $30k - 40k:
Lyons:
7.7% (129)
State:
7.7% (52,008)
Number of households with income $40k - 50k:
Lyons:
9.9% (165)
State:
8.1% (54,702)
Number of households with income $50k - 60k:
Lyons:
16.2% (270)
State:
7.5% (51,062)
Number of households with income $60k - 75k:
Lyons:
0.7% (12)
State:
11.3% (76,576)
Number of households with income $75k - 100k:
Lyons:
18.3% (305)
State:
15.5% (105,152)
Number of households with income $100k - 125k:
Lyons:
12.6% (210)
Illinois:
11.5% (77,760)
Number of households with income $125k - 150k:
Lyons:
7.8% (130)
State:
7.3% (49,310)
Number of households with income $150k - 200k:
Lyons:
16.9% (282)
Illinois:
7.6% (51,233)
Number of households with income > $200k:
Lyons:
1.1% (19)
Illinois:
5.9% (40,028)
Aggregate household income in Lyons in 2022: $143,623,360
Median family income in Lyons in 2022:
Lyons:
$100,438
Illinois:
$76,467
Number of families with income < $10k:
Lyons:
7.0% (90)
Illinois:
3.8% (19,330)
Number of families with income $10k - 20k:
Lyons:
2.3% (29)
Illinois:
3.8% (19,314)
Number of families with income $20k - 30k:
Lyons:
2.5% (32)
Illinois:
6.8% (34,467)
Number of families with income $30k - 40k:
Lyons:
9.4% (121)
Illinois:
7.5% (37,976)
Number of families with income $40k - 50k:
Lyons:
9.6% (124)
State:
7.7% (38,858)
Number of families with income $50k - 60k:
Lyons:
6.2% (80)
State:
7.6% (38,606)
Number of families with income $75k - 100k:
Lyons:
17.0% (218)
State:
16.0% (81,055)
Number of families with income $100k - 125k:
Lyons:
13.2% (169)
Illinois:
12.1% (61,491)
Number of families with income $125k - 150k:
Lyons:
9.8% (125)
State:
8.0% (40,271)
Number of families with income $150k - 200k:
Lyons:
21.6% (278)
State:
8.6% (43,536)
Number of families with income > $200k:
Lyons:
1.5% (19)
State:
6.6% (33,240)
Median non-family income in Lyons in 2022:
Lyons:
$54,709
State:
$45,965
Change in median non-family income between 2000 and 2022:
Lyons, Illinois:
+71.6%
State:
+75.9%
Median per capita income in Lyons in 2022:
Lyons:
$26,518
Illinois:
$26,551
Change in median per capita income between 2000 and 2022:
Lyons, Illinois:
+72.1%
State:
+111.0%
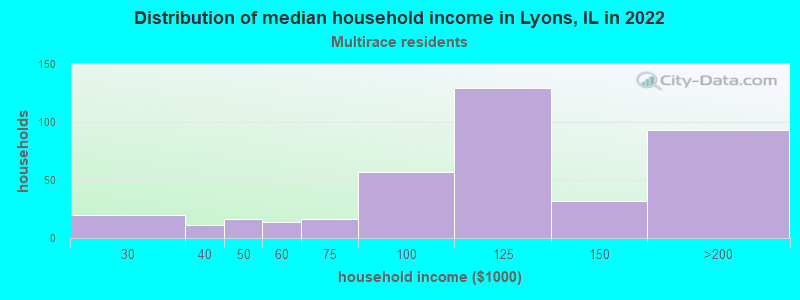
Income statistics for Multirace residents
Median household income in Lyons, IL in 2022:
Lyons:
$99,718
Illinois:
$71,185
Change in median household income between 2000 and 2022:
Lyons, Illinois:
+128.7%
State:
+81.4%
Number of households with income < $10k:
Lyons:
0.0% (0)
State:
5.3% (21,595)
Number of households with income $10k - 20k:
Lyons:
0.0% (0)
State:
6.5% (26,720)
Number of households with income $20k - 30k:
Lyons:
5.2% (20)
Illinois:
8.0% (32,573)
Number of households with income $30k - 40k:
Lyons:
2.8% (11)
State:
8.4% (34,383)
Number of households with income $40k - 50k:
Lyons:
4.1% (16)
State:
7.4% (30,234)
Number of households with income $50k - 60k:
Lyons:
3.6% (14)
State:
6.9% (28,432)
Number of households with income $60k - 75k:
Lyons:
4.1% (16)
Illinois:
10.2% (41,780)
Number of households with income $75k - 100k:
Lyons:
14.7% (57)
State:
13.0% (53,426)
Number of households with income $100k - 125k:
Lyons:
33.2% (129)
State:
10.5% (43,126)
Number of households with income $125k - 150k:
Lyons:
8.2% (32)
Illinois:
7.6% (31,153)
Number of households with income $150k - 200k:
Lyons:
24.0% (93)
State:
7.6% (30,946)
Number of households with income > $200k:
Lyons:
0.0% (0)
State:
8.6% (35,208)
Aggregate household income in Lyons in 2022: $42,319,274
Median family income in Lyons in 2022:
Lyons:
$103,836
State:
$84,400
Number of families with income $20k - 30k:
Lyons:
5.5% (18)
State:
6.3% (17,559)
Number of families with income $40k - 50k:
Lyons:
4.9% (16)
Illinois:
7.1% (19,595)
Number of families with income $50k - 60k:
Lyons:
4.5% (15)
State:
6.9% (19,177)
Number of families with income $60k - 75k:
Lyons:
4.4% (14)
Illinois:
9.3% (25,936)
Number of families with income $75k - 100k:
Lyons:
16.6% (55)
State:
13.6% (37,857)
Number of families with income $100k - 125k:
Lyons:
24.6% (81)
State:
12.2% (33,852)
Number of families with income $125k - 150k:
Lyons:
9.9% (33)
Illinois:
9.0% (25,085)
Number of families with income $150k - 200k:
Lyons:
29.6% (98)
Illinois:
9.5% (26,306)
Median per capita income in Lyons in 2022:
Lyons:
$42,631
State:
$29,285
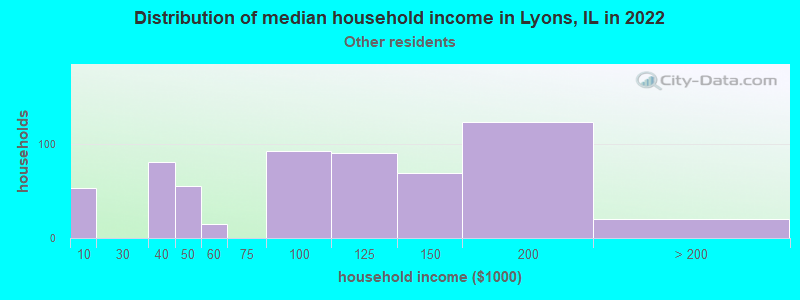
Income statistics for other residents
Median household income in Lyons, IL in 2022:
Lyons:
$101,595
Illinois:
$71,711
Number of households with income < $10k:
Lyons:
8.9% (53)
State:
5.7% (16,383)
Number of households with income $10k - 20k:
Lyons:
0.0% (0)
State:
4.8% (13,886)
Number of households with income $20k - 30k:
Lyons:
0.0% (0)
State:
7.0% (20,054)
Number of households with income $30k - 40k:
Lyons:
13.5% (81)
State:
7.0% (20,038)
Number of households with income $40k - 50k:
Lyons:
9.2% (55)
State:
8.3% (23,759)
Number of households with income $50k - 60k:
Lyons:
2.5% (15)
State:
7.8% (22,410)
Number of households with income $60k - 75k:
Lyons:
0.0% (0)
State:
12.0% (34,448)
Number of households with income $75k - 100k:
Lyons:
15.4% (92)
State:
16.2% (46,508)
Number of households with income $100k - 125k:
Lyons:
15.1% (90)
Illinois:
12.5% (35,952)
Number of households with income $125k - 150k:
Lyons:
11.5% (69)
State:
6.9% (19,732)
Number of households with income $150k - 200k:
Lyons:
20.6% (123)
Illinois:
7.5% (21,422)
Number of households with income > $200k:
Lyons:
3.3% (20)
State:
4.3% (12,194)
Aggregate household income in Lyons in 2022: $55,255,971
Median family income in Lyons in 2022:
Lyons:
$111,914
Illinois:
$74,069
Number of families with income < $10k:
Lyons:
8.0% (44)
Illinois:
4.1% (9,256)
Number of families with income $30k - 40k:
Lyons:
9.9% (54)
State:
7.6% (17,087)
Number of families with income $40k - 50k:
Lyons:
8.4% (46)
State:
8.1% (18,155)
Number of families with income $50k - 60k:
Lyons:
2.6% (14)
State:
7.4% (16,614)
Number of families with income $75k - 100k:
Lyons:
17.8% (96)
State:
17.2% (38,560)
Number of families with income $100k - 125k:
Lyons:
15.0% (81)
State:
12.3% (27,638)
Number of families with income $125k - 150k:
Lyons:
12.9% (70)
State:
7.3% (16,287)
Number of families with income $150k - 200k:
Lyons:
21.8% (118)
Illinois:
7.7% (17,122)
Number of families with income > $200k:
Lyons:
3.6% (19)
State:
4.6% (10,400)
Median per capita income in Lyons in 2022:
Lyons:
$25,147
State:
$25,392
Change in median per capita income between 2000 and 2022:
Lyons, Illinois:
+47.3%
State:
+117.4%
Discuss Lyons, Illinois (IL) on our hugely popular Illinois forum.