The median household income in North Bellmore, NY in 2022 was $171,408, which was 53.6% greater than the median annual income of $79,557 across the entire state of New York. Compared to the median income of $72,325 in 2000 this represents an increase of 57.8%. The per capita income in 2022 was $68,064, which means an increase of 60.1% compared to 2000 when it was $27,174.
Whole page based on the data from 2000 / 2022 when the population of North Bellmore, New York was 20,079 / 20,988
Income statistics for all residents
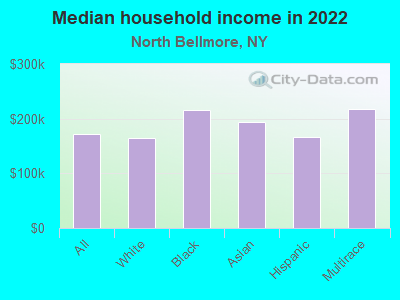
Median household income in North Bellmore, NY in 2022:
North Bellmore:
$171,409
State:
$79,557
Change in median household income between 2000 and 2022:
North Bellmore, New York:
+137.0%
State:
+83.3%
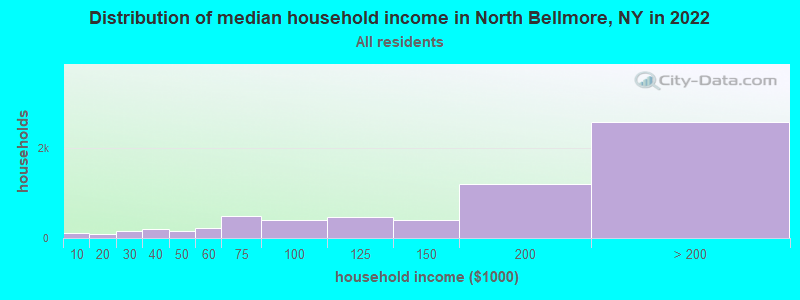
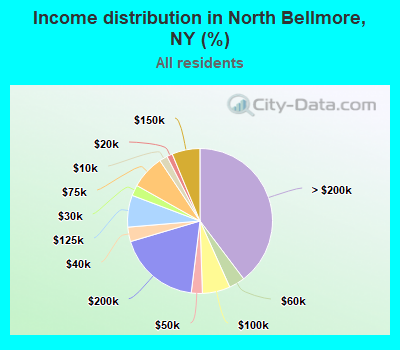
Number of households with income < $10k:
North Bellmore:
1.8% (119)
State:
6.8% (527,598)
Number of households with income $10k - 20k:
North Bellmore:
1.3% (82)
State:
7.4% (574,940)
Number of households with income $20k - 30k:
North Bellmore:
2.4% (157)
State:
6.7% (517,718)
Number of households with income $30k - 40k:
North Bellmore:
3.2% (210)
State:
6.5% (506,674)
Number of households with income $40k - 50k:
North Bellmore:
2.5% (161)
New York:
6.1% (470,439)
Number of households with income $50k - 60k:
North Bellmore:
3.6% (232)
New York:
5.8% (454,042)
Number of households with income $60k - 75k:
North Bellmore:
7.5% (491)
State:
8.5% (657,508)
Number of households with income $75k - 100k:
North Bellmore:
6.2% (404)
New York:
11.6% (899,824)
Number of households with income $100k - 125k:
North Bellmore:
7.1% (463)
State:
9.3% (723,825)
Number of households with income $125k - 150k:
North Bellmore:
6.2% (407)
State:
7.1% (552,420)
Number of households with income $150k - 200k:
North Bellmore:
18.5% (1,206)
State:
9.4% (727,051)
Number of households with income > $200k:
North Bellmore:
39.7% (2,591)
New York:
15.0% (1,162,269)
Aggregate household income in North Bellmore in 2022: $1,413,370,437
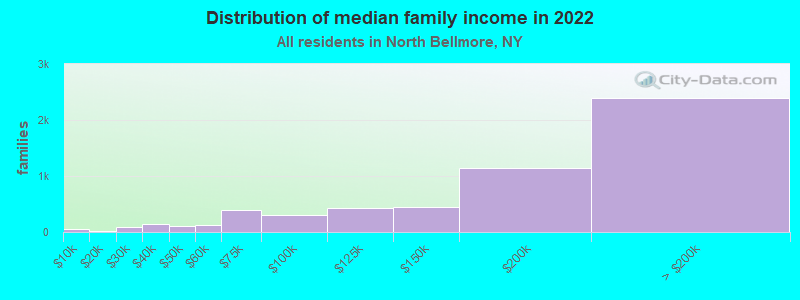
Median family income in North Bellmore in 2022:
North Bellmore:
$184,439
New York:
$99,066
Number of families with income < $10k:
North Bellmore:
1.1% (61)
State:
4.2% (197,409)
Number of families with income $10k - 20k:
North Bellmore:
0.4% (23)
State:
4.3% (205,373)
Number of families with income $20k - 30k:
North Bellmore:
1.5% (83)
New York:
5.1% (241,229)
Number of families with income $30k - 40k:
North Bellmore:
2.5% (143)
State:
5.5% (259,233)
Number of families with income $40k - 50k:
North Bellmore:
1.9% (105)
New York:
5.5% (259,113)
Number of families with income $50k - 60k:
North Bellmore:
2.2% (123)
State:
5.4% (255,320)
Number of families with income $60k - 75k:
North Bellmore:
6.8% (385)
State:
8.2% (388,624)
Number of families with income $75k - 100k:
North Bellmore:
5.3% (301)
State:
12.3% (583,110)
Number of families with income $100k - 125k:
North Bellmore:
7.6% (426)
State:
10.6% (500,579)
Number of families with income $125k - 150k:
North Bellmore:
8.0% (451)
New York:
8.5% (400,594)
Number of families with income $150k - 200k:
North Bellmore:
20.3% (1,145)
State:
11.6% (551,650)
Number of families with income > $200k:
North Bellmore:
42.4% (2,394)
State:
18.9% (895,998)
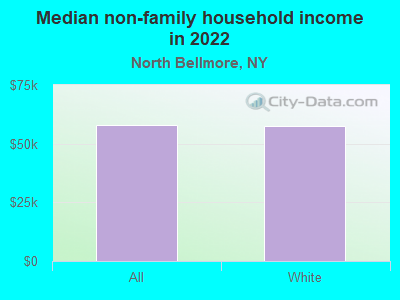
Median non-family income in North Bellmore in 2022:
North Bellmore:
$57,892
State:
$50,181
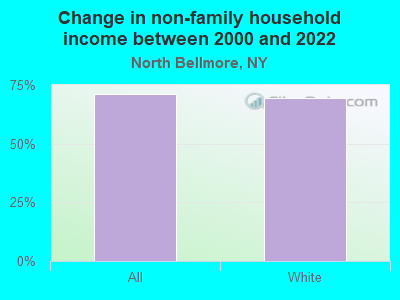
Change in median non-family income between 2000 and 2022:
North Bellmore, New York:
+71.3%
State:
+85.4%
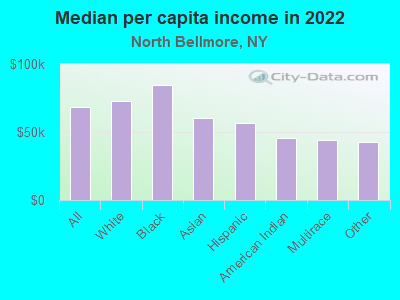
Median per capita income in North Bellmore in 2022:
North Bellmore:
$68,064
State:
$47,421
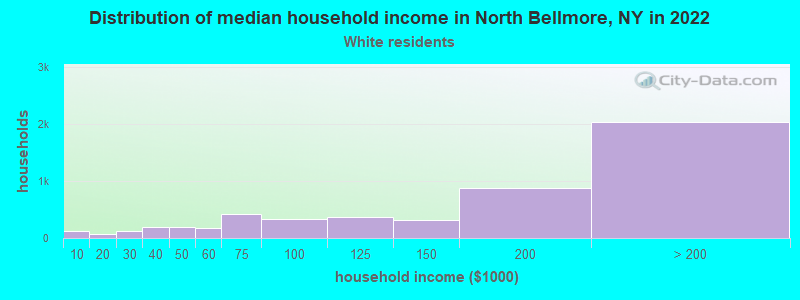
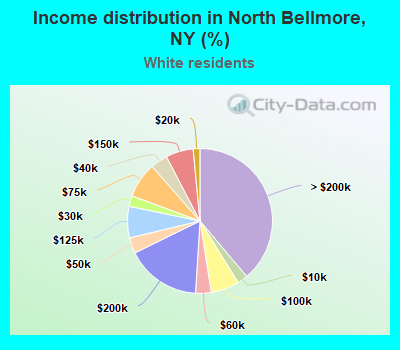
Income statistics for White residents
Median household income in North Bellmore, NY in 2022:
North Bellmore:
$163,922
New York:
$89,408
Change in median household income between 2000 and 2022:
North Bellmore, New York:
+127.5%
State:
+85.5%
Number of households with income < $10k:
North Bellmore:
2.3% (121)
New York:
4.8% (225,550)
Number of households with income $10k - 20k:
North Bellmore:
1.5% (79)
New York:
6.1% (289,425)
Number of households with income $20k - 30k:
North Bellmore:
2.4% (125)
State:
5.9% (280,254)
Number of households with income $30k - 40k:
North Bellmore:
3.8% (200)
New York:
6.1% (288,263)
Number of households with income $40k - 50k:
North Bellmore:
3.5% (185)
New York:
5.9% (278,079)
Number of households with income $50k - 60k:
North Bellmore:
3.5% (183)
State:
5.7% (267,554)
Number of households with income $60k - 75k:
North Bellmore:
7.9% (415)
State:
8.4% (398,344)
Number of households with income $75k - 100k:
North Bellmore:
6.3% (333)
State:
11.8% (554,841)
Number of households with income $100k - 125k:
North Bellmore:
7.0% (368)
New York:
10.0% (469,794)
Number of households with income $125k - 150k:
North Bellmore:
6.1% (322)
New York:
7.6% (360,467)
Number of households with income $150k - 200k:
North Bellmore:
16.8% (880)
State:
10.1% (477,078)
Number of households with income > $200k:
North Bellmore:
38.9% (2,041)
State:
17.6% (829,233)
Aggregate household income in North Bellmore in 2022: $1,091,912,001
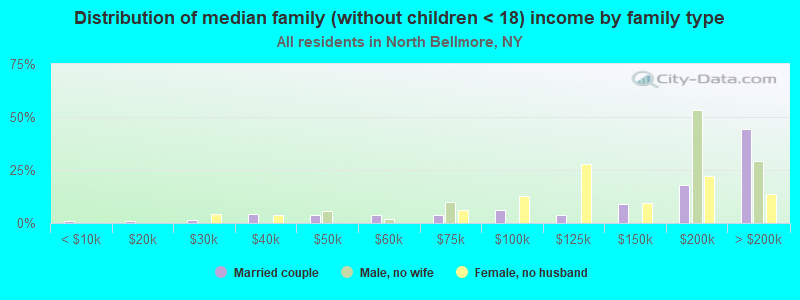
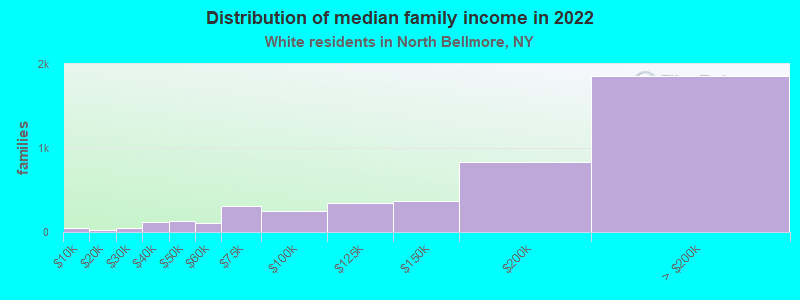
Median family income in North Bellmore in 2022:
North Bellmore:
$179,054
State:
$115,170
Number of families with income < $10k:
North Bellmore:
1.1% (49)
New York:
2.5% (68,851)
Number of families with income $10k - 20k:
North Bellmore:
0.6% (25)
New York:
3.0% (83,127)
Number of families with income $20k - 30k:
North Bellmore:
1.2% (53)
State:
3.5% (97,578)
Number of families with income $30k - 40k:
North Bellmore:
2.7% (122)
New York:
4.1% (114,108)
Number of families with income $40k - 50k:
North Bellmore:
2.9% (130)
State:
4.7% (130,902)
Number of families with income $50k - 60k:
North Bellmore:
2.4% (108)
New York:
4.9% (135,118)
Number of families with income $60k - 75k:
North Bellmore:
7.0% (311)
State:
7.8% (216,254)
Number of families with income $75k - 100k:
North Bellmore:
5.5% (246)
New York:
12.4% (342,382)
Number of families with income $100k - 125k:
North Bellmore:
7.7% (343)
New York:
11.4% (314,917)
Number of families with income $125k - 150k:
North Bellmore:
8.3% (369)
State:
9.4% (260,489)
Number of families with income $150k - 200k:
North Bellmore:
18.7% (832)
State:
13.2% (365,586)
Number of families with income > $200k:
North Bellmore:
41.8% (1,862)
State:
23.2% (642,319)
Median non-family income in North Bellmore in 2022:
North Bellmore:
$57,622
New York:
$54,783
Change in median non-family income between 2000 and 2022:
North Bellmore, New York:
+69.2%
State:
+87.9%
Median per capita income in North Bellmore in 2022:
North Bellmore:
$72,657
State:
$57,640
Income statistics for Black or African American residents
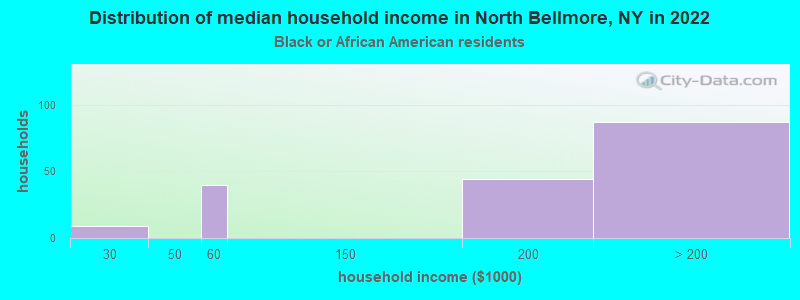
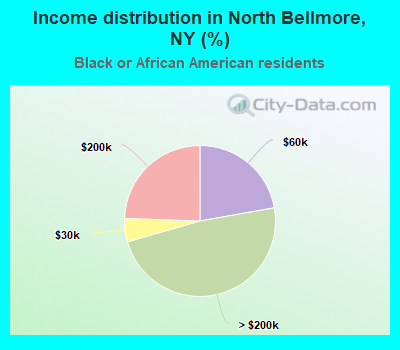
Median household income in North Bellmore, NY in 2022:
North Bellmore:
$215,979
State:
$57,898
Number of households with income < $10k:
North Bellmore:
0.0% (0)
State:
12.0% (128,500)
Number of households with income $10k - 20k:
North Bellmore:
0.0% (0)
State:
10.0% (107,541)
Number of households with income $20k - 30k:
North Bellmore:
5.0% (9)
State:
8.4% (90,192)
Number of households with income $30k - 40k:
North Bellmore:
0.0% (0)
New York:
7.4% (79,579)
Number of households with income $40k - 50k:
North Bellmore:
0.0% (0)
State:
6.8% (72,491)
Number of households with income $50k - 60k:
North Bellmore:
22.2% (40)
New York:
6.7% (71,309)
Number of households with income $60k - 75k:
North Bellmore:
0.0% (0)
State:
8.9% (95,050)
Number of households with income $75k - 100k:
North Bellmore:
0.0% (0)
State:
11.5% (123,569)
Number of households with income $100k - 125k:
North Bellmore:
0.0% (0)
New York:
8.1% (86,632)
Number of households with income $125k - 150k:
North Bellmore:
0.0% (0)
New York:
6.0% (64,788)
Number of households with income $150k - 200k:
North Bellmore:
24.4% (44)
New York:
7.2% (76,644)
Number of households with income > $200k:
North Bellmore:
48.3% (87)
State:
7.0% (75,062)
Aggregate household income in North Bellmore in 2022: $54,339,794
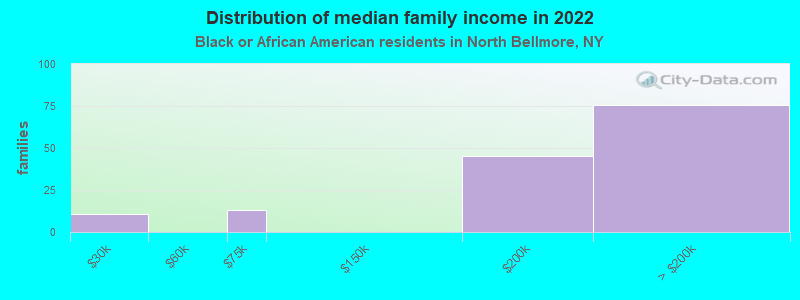
Median family income in North Bellmore in 2022:
North Bellmore:
$267,450
State:
$72,528
Number of families with income $20k - 30k:
North Bellmore:
7.6% (11)
New York:
7.0% (44,139)
Number of families with income $60k - 75k:
North Bellmore:
9.0% (13)
State:
9.2% (57,626)
Number of families with income $150k - 200k:
North Bellmore:
31.3% (45)
State:
9.4% (59,260)
Number of families with income > $200k:
North Bellmore:
52.2% (75)
State:
9.3% (58,575)
Median per capita income in North Bellmore in 2022:
North Bellmore:
$84,645
State:
$31,947
Income statistics for Asian residents
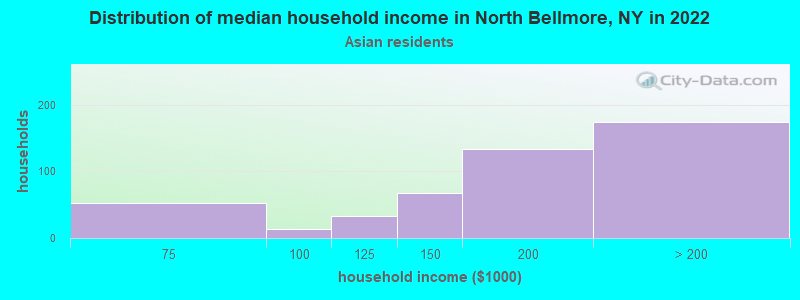
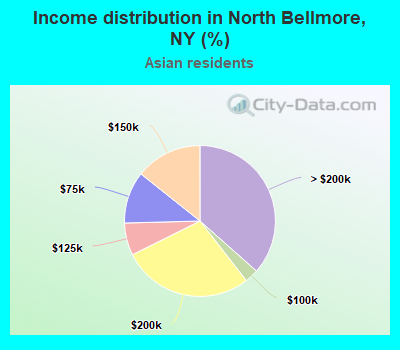
Median household income in North Bellmore, NY in 2022:
North Bellmore:
$194,718
State:
$89,947
Change in median household income between 2000 and 2022:
North Bellmore, New York:
+78.9%
New York:
+98.1%
Number of households with income < $10k:
North Bellmore:
0.0% (0)
State:
6.9% (42,537)
Number of households with income $10k - 20k:
North Bellmore:
0.0% (0)
State:
7.3% (44,745)
Number of households with income $20k - 30k:
North Bellmore:
0.0% (0)
State:
6.2% (38,249)
Number of households with income $30k - 40k:
North Bellmore:
0.0% (0)
New York:
5.5% (33,993)
Number of households with income $40k - 50k:
North Bellmore:
0.0% (0)
New York:
4.8% (29,795)
Number of households with income $50k - 60k:
North Bellmore:
0.0% (0)
New York:
5.2% (32,100)
Number of households with income $60k - 75k:
North Bellmore:
11.1% (53)
State:
7.3% (44,615)
Number of households with income $75k - 100k:
North Bellmore:
2.9% (14)
State:
10.8% (66,687)
Number of households with income $100k - 125k:
North Bellmore:
6.9% (33)
State:
8.2% (50,233)
Number of households with income $125k - 150k:
North Bellmore:
14.3% (68)
State:
7.2% (44,299)
Number of households with income $150k - 200k:
North Bellmore:
28.2% (134)
State:
10.4% (63,837)
Number of households with income > $200k:
North Bellmore:
36.6% (174)
State:
20.1% (123,891)
Aggregate household income in North Bellmore in 2022: $116,025,101
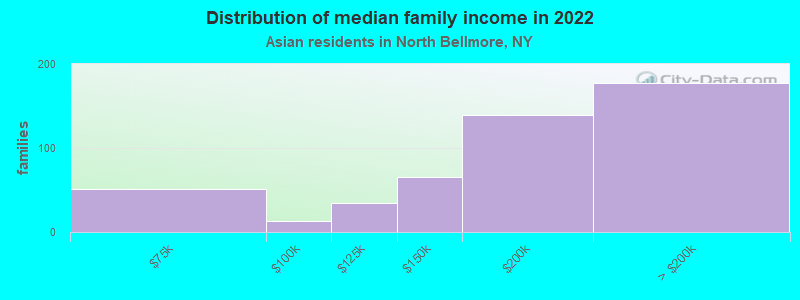
Median family income in North Bellmore in 2022:
North Bellmore:
$200,253
State:
$98,136
Number of families with income $60k - 75k:
North Bellmore:
10.8% (51)
State:
7.6% (33,120)
Number of families with income $75k - 100k:
North Bellmore:
2.6% (13)
State:
10.7% (46,726)
Number of families with income $100k - 125k:
North Bellmore:
7.0% (34)
State:
8.6% (37,796)
Number of families with income $125k - 150k:
North Bellmore:
13.5% (65)
State:
7.3% (31,893)
Number of families with income $150k - 200k:
North Bellmore:
29.0% (139)
State:
11.0% (48,177)
Number of families with income > $200k:
North Bellmore:
37.0% (177)
State:
22.2% (97,322)
Median per capita income in North Bellmore in 2022:
North Bellmore:
$60,518
State:
$46,726
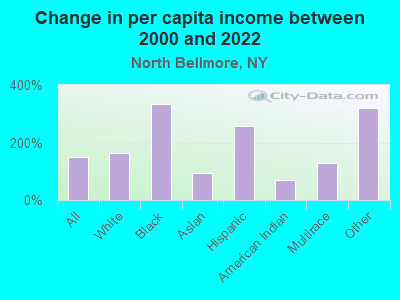
Change in median per capita income between 2000 and 2022:
North Bellmore, New York:
+94.5%
New York:
+126.6%
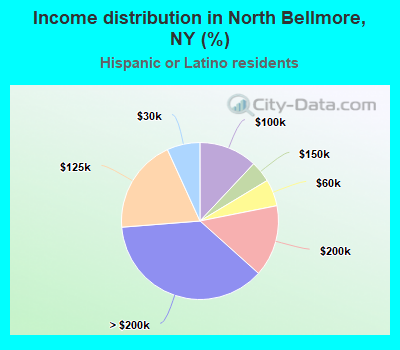
Income statistics for Hispanic or Latino residents
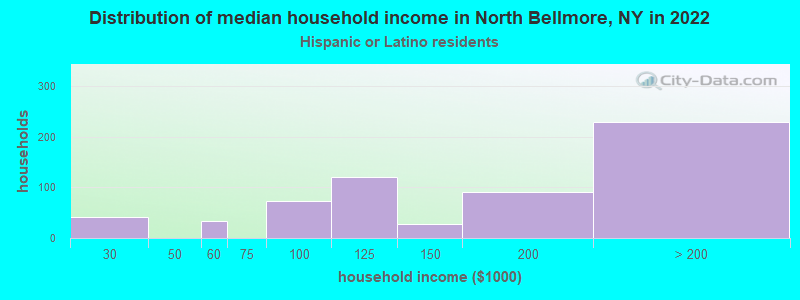
Median household income in North Bellmore, NY in 2022:
North Bellmore:
$167,168
State:
$60,468
Change in median household income between 2000 and 2022:
North Bellmore, New York:
+149.5%
State:
+98.3%
Number of households with income < $10k:
North Bellmore:
0.0% (0)
New York:
9.9% (127,185)
Number of households with income $10k - 20k:
North Bellmore:
0.0% (0)
State:
10.7% (136,699)
Number of households with income $20k - 30k:
North Bellmore:
6.8% (42)
State:
8.1% (102,991)
Number of households with income $30k - 40k:
North Bellmore:
0.0% (0)
New York:
7.8% (100,149)
Number of households with income $40k - 50k:
North Bellmore:
0.0% (0)
State:
6.9% (87,760)
Number of households with income $50k - 60k:
North Bellmore:
5.5% (34)
State:
6.3% (80,968)
Number of households with income $60k - 75k:
North Bellmore:
0.0% (0)
State:
8.7% (110,631)
Number of households with income $75k - 100k:
North Bellmore:
12.0% (74)
State:
11.2% (142,787)
Number of households with income $100k - 125k:
North Bellmore:
19.4% (120)
State:
8.2% (104,850)
Number of households with income $125k - 150k:
North Bellmore:
4.4% (27)
State:
6.3% (80,274)
Number of households with income $150k - 200k:
North Bellmore:
14.7% (91)
New York:
7.4% (95,117)
Number of households with income > $200k:
North Bellmore:
37.1% (229)
State:
8.6% (109,514)
Aggregate household income in North Bellmore in 2022: $138,932,450
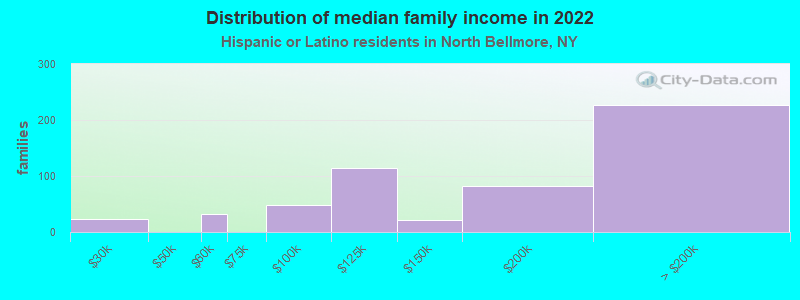
Median family income in North Bellmore in 2022:
North Bellmore:
$163,434
New York:
$68,770
Number of families with income $20k - 30k:
North Bellmore:
4.3% (24)
State:
8.0% (68,048)
Number of families with income $50k - 60k:
North Bellmore:
5.9% (33)
State:
6.6% (55,592)
Number of families with income $75k - 100k:
North Bellmore:
9.0% (49)
State:
12.6% (106,685)
Number of families with income $100k - 125k:
North Bellmore:
20.9% (115)
State:
9.4% (79,139)
Number of families with income $125k - 150k:
North Bellmore:
3.9% (22)
New York:
6.9% (58,255)
Number of families with income $150k - 200k:
North Bellmore:
14.8% (82)
State:
8.3% (69,877)
Number of families with income > $200k:
North Bellmore:
41.2% (227)
New York:
9.3% (78,555)
Median per capita income in North Bellmore in 2022:
North Bellmore:
$56,429
State:
$29,761
Income statistics for American Indian and Alaska Native residents
Number of households with income < $10k:
North Bellmore:
0.0% (0)
State:
8.6% (3,559)
Number of households with income $10k - 20k:
North Bellmore:
0.0% (0)
State:
5.9% (2,455)
Number of households with income $20k - 30k:
North Bellmore:
0.0% (0)
State:
8.2% (3,393)
Number of households with income $30k - 40k:
North Bellmore:
0.0% (0)
State:
11.9% (4,918)
Number of households with income $40k - 50k:
North Bellmore:
0.0% (0)
State:
6.5% (2,682)
Number of households with income $50k - 60k:
North Bellmore:
0.0% (0)
State:
6.1% (2,516)
Number of households with income $60k - 75k:
North Bellmore:
0.0% (0)
New York:
10.0% (4,125)
Number of households with income $75k - 100k:
North Bellmore:
0.0% (0)
New York:
13.3% (5,517)
Number of households with income $100k - 125k:
North Bellmore:
100.0% (38)
New York:
8.4% (3,463)
Number of households with income $125k - 150k:
North Bellmore:
0.0% (0)
State:
7.0% (2,887)
Number of households with income $150k - 200k:
North Bellmore:
0.0% (0)
State:
9.9% (4,106)
Number of households with income > $200k:
North Bellmore:
0.0% (0)
New York:
4.2% (1,744)
Aggregate household income in North Bellmore in 2022: $6,680,708
Median per capita income in North Bellmore in 2022:
North Bellmore:
$45,430
State:
$25,837
Change in median per capita income between 2000 and 2022:
North Bellmore, New York:
+69.1%
State:
+99.6%
Income statistics for Multirace residents
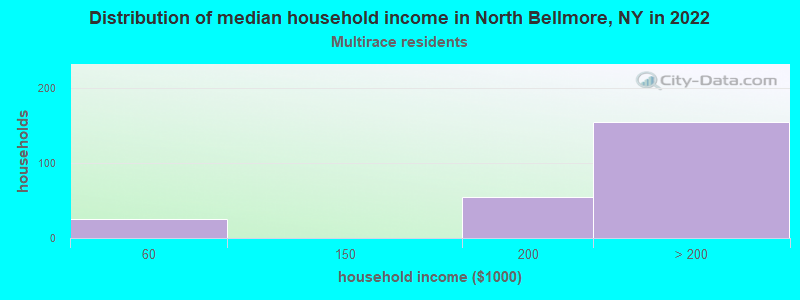
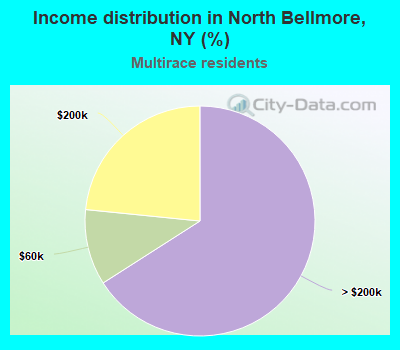
Median household income in North Bellmore, NY in 2022:
North Bellmore:
$217,157
New York:
$73,557
Number of households with income < $10k:
North Bellmore:
0.0% (0)
New York:
8.9% (57,924)
Number of households with income $10k - 20k:
North Bellmore:
0.0% (0)
New York:
8.7% (56,590)
Number of households with income $20k - 30k:
North Bellmore:
0.0% (0)
State:
7.1% (46,287)
Number of households with income $30k - 40k:
North Bellmore:
0.0% (0)
New York:
6.9% (45,132)
Number of households with income $40k - 50k:
North Bellmore:
0.0% (0)
State:
5.8% (37,946)
Number of households with income $50k - 60k:
North Bellmore:
10.6% (25)
State:
5.6% (36,410)
Number of households with income $60k - 75k:
North Bellmore:
0.0% (0)
State:
7.8% (50,819)
Number of households with income $75k - 100k:
North Bellmore:
0.0% (0)
New York:
11.7% (76,024)
Number of households with income $100k - 125k:
North Bellmore:
0.0% (0)
New York:
9.3% (60,635)
Number of households with income $125k - 150k:
North Bellmore:
0.0% (0)
State:
6.2% (40,533)
Number of households with income $150k - 200k:
North Bellmore:
23.4% (55)
State:
8.6% (56,409)
Number of households with income > $200k:
North Bellmore:
66.0% (155)
New York:
13.4% (87,442)
Aggregate household income in North Bellmore in 2022: $81,417,594
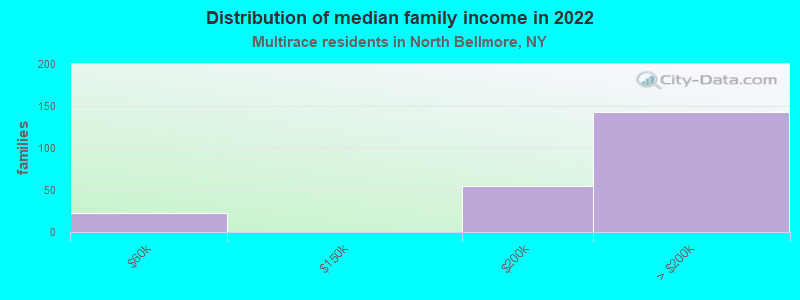
Median family income in North Bellmore in 2022:
North Bellmore:
$213,019
State:
$85,788
Number of families with income $50k - 60k:
North Bellmore:
10.4% (23)
State:
5.5% (22,002)
Number of families with income $150k - 200k:
North Bellmore:
24.9% (55)
State:
9.4% (37,771)
Number of families with income > $200k:
North Bellmore:
64.7% (143)
State:
15.7% (62,951)
Median per capita income in North Bellmore in 2022:
North Bellmore:
$43,850
State:
$36,931
Change in median per capita income between 2000 and 2022:
North Bellmore, New York:
+130.0%
New York:
+158.8%
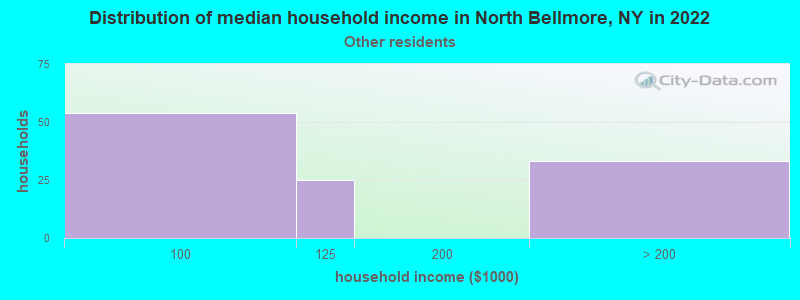
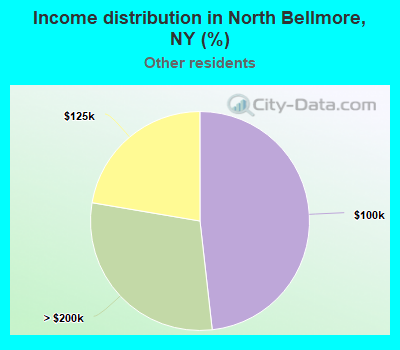
Income statistics for other residents
Number of households with income < $10k:
North Bellmore:
0.0% (0)
State:
10.3% (69,252)
Number of households with income $10k - 20k:
North Bellmore:
0.0% (0)
State:
11.0% (73,890)
Number of households with income $20k - 30k:
North Bellmore:
0.0% (0)
State:
8.8% (59,096)
Number of households with income $30k - 40k:
North Bellmore:
0.0% (0)
State:
8.1% (54,418)
Number of households with income $40k - 50k:
North Bellmore:
0.0% (0)
State:
7.3% (49,042)
Number of households with income $50k - 60k:
North Bellmore:
0.0% (0)
State:
6.5% (43,945)
Number of households with income $60k - 75k:
North Bellmore:
0.0% (0)
New York:
9.5% (64,087)
Number of households with income $75k - 100k:
North Bellmore:
48.2% (54)
State:
10.9% (73,094)
Number of households with income $100k - 125k:
North Bellmore:
22.3% (25)
State:
7.9% (53,055)
Number of households with income $125k - 150k:
North Bellmore:
0.0% (0)
State:
5.9% (39,446)
Number of households with income $150k - 200k:
North Bellmore:
0.0% (0)
New York:
7.2% (48,653)
Number of households with income > $200k:
North Bellmore:
29.5% (33)
State:
6.6% (44,703)
Aggregate household income in North Bellmore in 2022: $17,017,610
Median per capita income in North Bellmore in 2022:
North Bellmore:
$42,967
New York:
$26,975
Discuss North Bellmore, New York (NY) on our hugely popular New York forum.