The median household income in North Valley, NM in 2022 was $62,147, which was 3.9% greater than the median annual income of $59,726 across the entire state of New Mexico. Compared to the median income of $39,888 in 2000 this represents an increase of 35.8%. The per capita income in 2022 was $35,006, which means an increase of 44.6% compared to 2000 when it was $19,398.
Whole page based on the data from 2000 / 2022 when the population of North Valley, New Mexico was 11,923 / 11,220
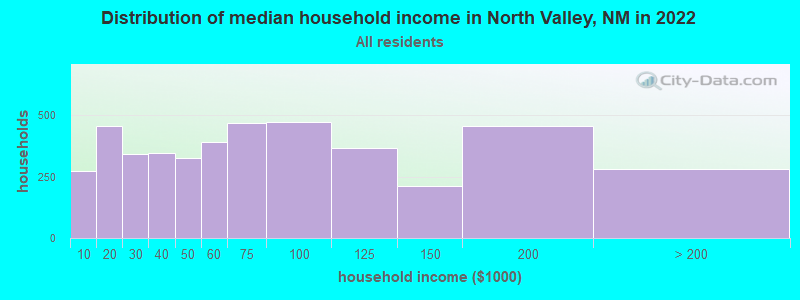
Income statistics for all residents
Median household income in North Valley, NM in 2022:
North Valley:
$62,148
State:
$59,726
Change in median household income between 2000 and 2022:
North Valley, New Mexico:
+55.8%
New Mexico:
+75.0%
Number of households with income < $10k:
North Valley:
6.2% (274)
New Mexico:
7.4% (62,451)
Number of households with income $10k - 20k:
North Valley:
10.4% (457)
State:
9.5% (80,886)
Number of households with income $20k - 30k:
North Valley:
7.8% (341)
State:
8.9% (75,578)
Number of households with income $30k - 40k:
North Valley:
7.9% (345)
New Mexico:
9.1% (77,319)
Number of households with income $40k - 50k:
North Valley:
7.4% (324)
New Mexico:
8.0% (67,979)
Number of households with income $50k - 60k:
North Valley:
8.9% (392)
State:
7.2% (61,477)
Number of households with income $60k - 75k:
North Valley:
10.7% (468)
State:
9.1% (77,047)
Number of households with income $75k - 100k:
North Valley:
10.8% (472)
State:
12.5% (106,292)
Number of households with income $100k - 125k:
North Valley:
8.4% (368)
State:
9.3% (79,200)
Number of households with income $125k - 150k:
North Valley:
4.8% (212)
State:
6.2% (52,769)
Number of households with income $150k - 200k:
North Valley:
10.3% (454)
State:
6.4% (54,020)
Number of households with income > $200k:
North Valley:
6.4% (280)
State:
6.3% (53,200)
Aggregate household income in North Valley in 2022: $376,437,892
Median family income in North Valley in 2022:
North Valley:
$69,227
State:
$74,341
Number of families with income < $10k:
North Valley:
2.6% (77)
New Mexico:
4.5% (23,191)
Number of families with income $10k - 20k:
North Valley:
10.3% (301)
State:
5.6% (28,861)
Number of families with income $20k - 30k:
North Valley:
6.1% (179)
State:
6.8% (35,308)
Number of families with income $30k - 40k:
North Valley:
10.1% (294)
State:
8.4% (43,204)
Number of families with income $40k - 50k:
North Valley:
5.9% (174)
State:
8.2% (42,398)
Number of families with income $50k - 60k:
North Valley:
8.4% (245)
State:
7.2% (37,358)
Number of families with income $60k - 75k:
North Valley:
7.2% (210)
State:
9.7% (50,331)
Number of families with income $75k - 100k:
North Valley:
9.5% (278)
New Mexico:
14.1% (72,803)
Number of families with income $100k - 125k:
North Valley:
10.1% (294)
New Mexico:
10.7% (55,058)
Number of families with income $125k - 150k:
North Valley:
6.2% (182)
State:
7.9% (40,847)
Number of families with income $150k - 200k:
North Valley:
14.5% (423)
State:
8.5% (44,144)
Number of families with income > $200k:
North Valley:
9.1% (266)
State:
8.3% (42,961)
Median non-family income in North Valley in 2022:
North Valley:
$37,225
State:
$36,532
Change in median non-family income between 2000 and 2022:
North Valley, New Mexico:
+81.5%
State:
+67.6%
Median per capita income in North Valley in 2022:
North Valley:
$35,007
New Mexico:
$33,916
Change in median per capita income between 2000 and 2022:
North Valley, New Mexico:
+80.5%
New Mexico:
+96.5%
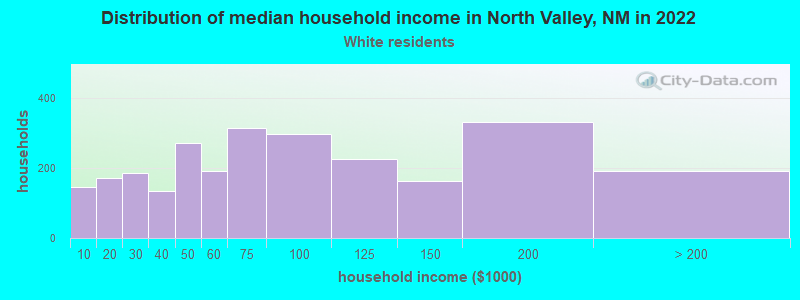
Income statistics for White residents
Median household income in North Valley, NM in 2022:
North Valley:
$76,575
New Mexico:
$66,903
Change in median household income between 2000 and 2022:
North Valley, New Mexico:
+90.8%
State:
+80.9%
Number of households with income < $10k:
North Valley:
5.6% (146)
State:
6.7% (30,275)
Number of households with income $10k - 20k:
North Valley:
6.5% (171)
State:
8.1% (36,636)
Number of households with income $20k - 30k:
North Valley:
7.1% (186)
State:
7.6% (34,662)
Number of households with income $30k - 40k:
North Valley:
5.2% (135)
State:
8.5% (38,487)
Number of households with income $40k - 50k:
North Valley:
10.3% (270)
New Mexico:
7.9% (35,775)
Number of households with income $50k - 60k:
North Valley:
7.3% (190)
State:
6.5% (29,590)
Number of households with income $60k - 75k:
North Valley:
12.0% (314)
New Mexico:
9.4% (42,749)
Number of households with income $75k - 100k:
North Valley:
11.4% (298)
New Mexico:
12.1% (54,752)
Number of households with income $100k - 125k:
North Valley:
8.6% (224)
New Mexico:
10.5% (47,619)
Number of households with income $125k - 150k:
North Valley:
6.2% (162)
New Mexico:
7.1% (32,441)
Number of households with income $150k - 200k:
North Valley:
12.6% (331)
State:
7.6% (34,408)
Number of households with income > $200k:
North Valley:
7.3% (190)
State:
8.0% (36,335)
Aggregate household income in North Valley in 2022: $251,724,393
Median family income in North Valley in 2022:
North Valley:
$95,334
New Mexico:
$86,441
Number of families with income < $10k:
North Valley:
0.4% (7)
New Mexico:
3.2% (8,287)
Number of families with income $10k - 20k:
North Valley:
5.0% (82)
State:
3.8% (9,892)
Number of families with income $20k - 30k:
North Valley:
7.2% (118)
State:
4.9% (12,813)
Number of families with income $30k - 40k:
North Valley:
9.5% (155)
State:
7.9% (20,670)
Number of families with income $40k - 50k:
North Valley:
8.2% (134)
State:
7.4% (19,396)
Number of families with income $50k - 60k:
North Valley:
3.2% (52)
State:
6.0% (15,747)
Number of families with income $60k - 75k:
North Valley:
7.2% (117)
State:
10.0% (26,136)
Number of families with income $75k - 100k:
North Valley:
12.2% (200)
New Mexico:
13.6% (35,677)
Number of families with income $100k - 125k:
North Valley:
9.0% (147)
State:
11.9% (31,166)
Number of families with income $125k - 150k:
North Valley:
8.5% (138)
State:
9.4% (24,562)
Number of families with income $150k - 200k:
North Valley:
19.0% (310)
State:
10.8% (28,256)
Number of families with income > $200k:
North Valley:
10.6% (173)
New Mexico:
11.1% (29,014)
Median non-family income in North Valley in 2022:
North Valley:
$47,263
State:
$41,946
Change in median non-family income between 2000 and 2022:
North Valley, New Mexico:
+118.0%
New Mexico:
+80.4%
Median per capita income in North Valley in 2022:
North Valley:
$41,982
State:
$42,438
Change in median per capita income between 2000 and 2022:
North Valley, New Mexico:
+94.5%
New Mexico:
+109.0%
Income statistics for Black or African American residents
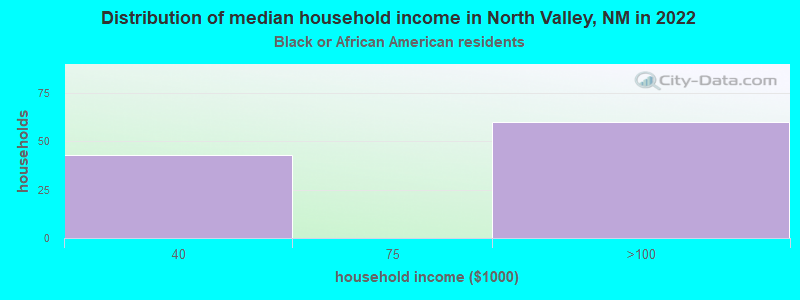
Number of households with income < $10k:
North Valley:
0.0% (0)
State:
6.7% (1,186)
Number of households with income $10k - 20k:
North Valley:
0.0% (0)
State:
8.5% (1,505)
Number of households with income $20k - 30k:
North Valley:
0.0% (0)
New Mexico:
14.3% (2,518)
Number of households with income $30k - 40k:
North Valley:
41.7% (43)
State:
12.3% (2,169)
Number of households with income $40k - 50k:
North Valley:
0.0% (0)
State:
5.1% (901)
Number of households with income $50k - 60k:
North Valley:
0.0% (0)
New Mexico:
8.4% (1,487)
Number of households with income $60k - 75k:
North Valley:
0.0% (0)
State:
9.4% (1,648)
Number of households with income $75k - 100k:
North Valley:
58.3% (60)
New Mexico:
11.6% (2,046)
Number of households with income $100k - 125k:
North Valley:
0.0% (0)
State:
9.4% (1,660)
Number of households with income $125k - 150k:
North Valley:
0.0% (0)
New Mexico:
3.6% (630)
Number of households with income $150k - 200k:
North Valley:
0.0% (0)
State:
6.3% (1,113)
Number of households with income > $200k:
North Valley:
0.0% (0)
State:
4.3% (749)
Aggregate household income in North Valley in 2022: $1,390,893
Median per capita income in North Valley in 2022:
North Valley:
$15,526
New Mexico:
$32,123
Change in median per capita income between 2000 and 2022:
North Valley, New Mexico:
+74.2%
State:
+116.3%
Income statistics for Asian residents
Median per capita income in North Valley in 2022:
North Valley:
$88,558
State:
$50,238
Change in median per capita income between 2000 and 2022:
North Valley, New Mexico:
+122.2%
State:
+134.4%
Income statistics for Hispanic or Latino residents
Median household income in North Valley, NM in 2022:
North Valley:
$57,400
New Mexico:
$52,568
Change in median household income between 2000 and 2022:
North Valley, New Mexico:
+72.3%
New Mexico:
+84.9%
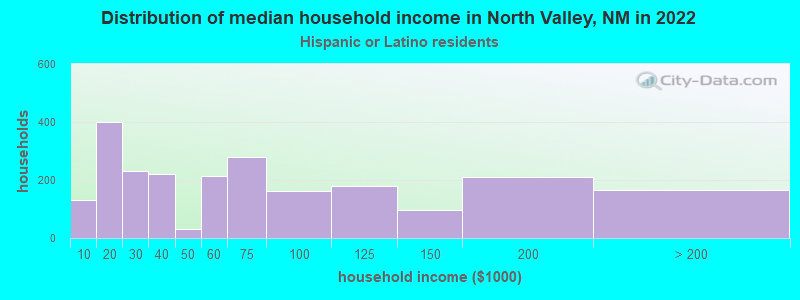
Number of households with income < $10k:
North Valley:
5.7% (132)
State:
7.7% (28,825)
Number of households with income $10k - 20k:
North Valley:
17.2% (401)
State:
11.3% (42,162)
Number of households with income $20k - 30k:
North Valley:
9.9% (230)
State:
10.3% (38,397)
Number of households with income $30k - 40k:
North Valley:
9.5% (221)
State:
10.0% (37,425)
Number of households with income $40k - 50k:
North Valley:
1.4% (32)
New Mexico:
8.8% (32,925)
Number of households with income $50k - 60k:
North Valley:
9.2% (215)
State:
8.2% (30,606)
Number of households with income $60k - 75k:
North Valley:
12.1% (281)
State:
8.6% (32,270)
Number of households with income $75k - 100k:
North Valley:
6.9% (161)
State:
13.3% (49,793)
Number of households with income $100k - 125k:
North Valley:
7.8% (181)
State:
8.1% (30,306)
Number of households with income $125k - 150k:
North Valley:
4.2% (98)
State:
5.3% (19,926)
Number of households with income $150k - 200k:
North Valley:
9.1% (211)
New Mexico:
4.9% (18,186)
Number of households with income > $200k:
North Valley:
7.0% (164)
State:
3.6% (13,321)
Aggregate household income in North Valley in 2022: $176,170,381
Median family income in North Valley in 2022:
North Valley:
$65,600
State:
$61,248
Number of families with income < $10k:
North Valley:
4.0% (69)
New Mexico:
5.3% (12,979)
Number of families with income $10k - 20k:
North Valley:
13.8% (238)
State:
7.5% (18,298)
Number of families with income $20k - 30k:
North Valley:
5.3% (91)
State:
8.9% (21,661)
Number of families with income $30k - 40k:
North Valley:
8.5% (147)
New Mexico:
9.3% (22,776)
Number of families with income $40k - 50k:
North Valley:
4.3% (75)
State:
10.0% (24,418)
Number of families with income $50k - 60k:
North Valley:
9.9% (170)
State:
8.1% (19,722)
Number of families with income $60k - 75k:
North Valley:
8.8% (152)
State:
9.5% (23,251)
Number of families with income $75k - 100k:
North Valley:
7.2% (123)
State:
14.4% (35,090)
Number of families with income $100k - 125k:
North Valley:
11.5% (198)
New Mexico:
9.8% (23,976)
Number of families with income $125k - 150k:
North Valley:
5.5% (94)
State:
6.8% (16,727)
Number of families with income $150k - 200k:
North Valley:
11.1% (191)
New Mexico:
5.8% (14,187)
Number of families with income > $200k:
North Valley:
10.2% (175)
State:
4.7% (11,406)
Median non-family income in North Valley in 2022:
North Valley:
$27,834
State:
$31,429
Change in median non-family income between 2000 and 2022:
North Valley, New Mexico:
+145.4%
State:
+86.7%
Median per capita income in North Valley in 2022:
North Valley:
$28,140
New Mexico:
$25,400
Change in median per capita income between 2000 and 2022:
North Valley, New Mexico:
+91.1%
State:
+110.9%
Income statistics for American Indian and Alaska Native residents
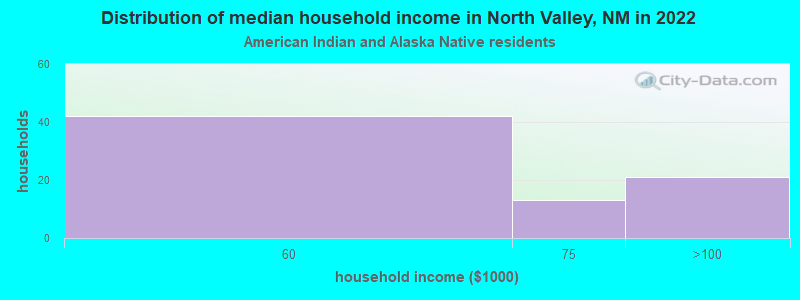
Median household income in North Valley, NM in 2022:
North Valley:
$61,607
State:
$43,317
Change in median household income between 2000 and 2022:
North Valley, New Mexico:
+66.8%
New Mexico:
+84.8%
Number of households with income < $10k:
North Valley:
0.0% (0)
State:
12.8% (7,750)
Number of households with income $10k - 20k:
North Valley:
0.0% (0)
State:
14.0% (8,481)
Number of households with income $20k - 30k:
North Valley:
0.0% (0)
New Mexico:
9.4% (5,714)
Number of households with income $30k - 40k:
North Valley:
0.0% (0)
New Mexico:
10.2% (6,190)
Number of households with income $40k - 50k:
North Valley:
0.0% (0)
State:
7.8% (4,765)
Number of households with income $50k - 60k:
North Valley:
55.3% (42)
State:
8.6% (5,205)
Number of households with income $60k - 75k:
North Valley:
17.1% (13)
State:
8.3% (5,073)
Number of households with income $75k - 100k:
North Valley:
27.6% (21)
State:
11.3% (6,847)
Number of households with income $100k - 125k:
North Valley:
0.0% (0)
State:
7.4% (4,504)
Number of households with income $125k - 150k:
North Valley:
0.0% (0)
New Mexico:
4.3% (2,588)
Number of households with income $150k - 200k:
North Valley:
0.0% (0)
New Mexico:
3.5% (2,146)
Number of households with income > $200k:
North Valley:
0.0% (0)
State:
2.5% (1,505)
Aggregate household income in North Valley in 2022: $5,102,023
Median family income in North Valley in 2022:
North Valley:
$60,447
New Mexico:
$49,129
Number of families with income $30k - 40k:
North Valley:
10.8% (8)
New Mexico:
10.8% (4,383)
Number of families with income $50k - 60k:
North Valley:
66.1% (47)
State:
10.8% (4,377)
Number of families with income $75k - 100k:
North Valley:
23.1% (16)
New Mexico:
9.0% (3,641)
Median per capita income in North Valley in 2022:
North Valley:
$25,491
State:
$20,119
Change in median per capita income between 2000 and 2022:
North Valley, New Mexico:
+116.4%
State:
+131.8%
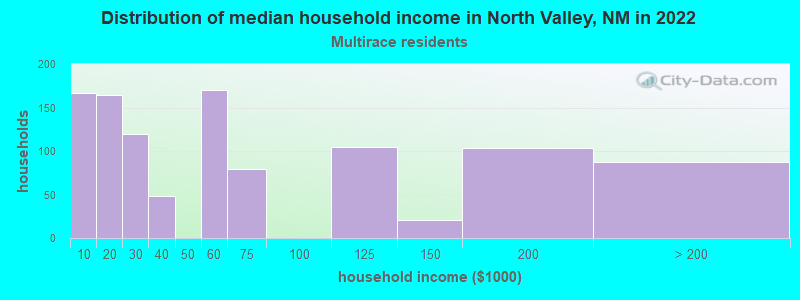
Income statistics for Multirace residents
Median household income in North Valley, NM in 2022:
North Valley:
$52,579
New Mexico:
$56,942
Change in median household income between 2000 and 2022:
North Valley, New Mexico:
+30.9%
State:
+94.8%
Number of households with income < $10k:
North Valley:
15.7% (167)
State:
6.5% (12,332)
Number of households with income $10k - 20k:
North Valley:
15.4% (164)
New Mexico:
10.6% (19,977)
Number of households with income $20k - 30k:
North Valley:
11.2% (119)
New Mexico:
10.3% (19,459)
Number of households with income $30k - 40k:
North Valley:
4.5% (48)
State:
8.8% (16,721)
Number of households with income $40k - 50k:
North Valley:
0.0% (0)
New Mexico:
7.4% (14,003)
Number of households with income $50k - 60k:
North Valley:
16.0% (170)
State:
9.0% (16,994)
Number of households with income $60k - 75k:
North Valley:
7.4% (79)
State:
8.9% (16,866)
Number of households with income $75k - 100k:
North Valley:
0.0% (0)
New Mexico:
13.5% (25,577)
Number of households with income $100k - 125k:
North Valley:
9.9% (105)
New Mexico:
8.9% (16,792)
Number of households with income $125k - 150k:
North Valley:
2.0% (21)
State:
5.6% (10,584)
Number of households with income $150k - 200k:
North Valley:
9.8% (104)
State:
5.7% (10,849)
Number of households with income > $200k:
North Valley:
8.2% (87)
State:
4.8% (9,158)
Aggregate household income in North Valley in 2022: $76,863,141
Median family income in North Valley in 2022:
North Valley:
$60,428
New Mexico:
$69,202
Number of families with income < $10k:
North Valley:
17.2% (135)
State:
4.1% (4,982)
Number of families with income $10k - 20k:
North Valley:
5.1% (40)
New Mexico:
6.3% (7,632)
Number of families with income $50k - 60k:
North Valley:
30.6% (240)
State:
9.1% (10,898)
Number of families with income $60k - 75k:
North Valley:
5.6% (44)
State:
9.8% (11,800)
Number of families with income $100k - 125k:
North Valley:
15.2% (120)
State:
10.5% (12,660)
Number of families with income $125k - 150k:
North Valley:
2.4% (19)
State:
6.9% (8,295)
Number of families with income $150k - 200k:
North Valley:
12.7% (100)
State:
7.0% (8,391)
Number of families with income > $200k:
North Valley:
11.2% (88)
State:
6.4% (7,749)
Median non-family income in North Valley in 2022:
North Valley:
$26,184
New Mexico:
$31,862
Median per capita income in North Valley in 2022:
North Valley:
$34,387
State:
$28,327
Income statistics for other residents
Number of households with income < $10k:
North Valley:
0.0% (0)
State:
8.9% (10,041)
Number of households with income $10k - 20k:
North Valley:
35.2% (154)
State:
11.6% (13,195)
Number of households with income $20k - 30k:
North Valley:
6.9% (30)
State:
10.7% (12,163)
Number of households with income $30k - 40k:
North Valley:
29.1% (127)
New Mexico:
11.4% (12,903)
Number of households with income $40k - 50k:
North Valley:
0.0% (0)
State:
10.3% (11,698)
Number of households with income $50k - 60k:
North Valley:
3.7% (16)
State:
6.8% (7,753)
Number of households with income $60k - 75k:
North Valley:
0.0% (0)
New Mexico:
8.4% (9,473)
Number of households with income $75k - 100k:
North Valley:
0.0% (0)
State:
13.7% (15,509)
Number of households with income $100k - 125k:
North Valley:
14.2% (62)
State:
6.6% (7,461)
Number of households with income $125k - 150k:
North Valley:
6.4% (28)
New Mexico:
5.3% (6,039)
Number of households with income $150k - 200k:
North Valley:
4.6% (20)
State:
3.9% (4,404)
Number of households with income > $200k:
North Valley:
0.0% (0)
New Mexico:
2.4% (2,687)
Aggregate household income in North Valley in 2022: $24,005,511
Median non-family income in North Valley in 2022:
North Valley:
$19,967
State:
$30,209
Change in median non-family income between 2000 and 2022:
North Valley, New Mexico:
+18.1%
New Mexico:
+84.1%
Median per capita income in North Valley in 2022:
North Valley:
$15,235
State:
$23,871
Change in median per capita income between 2000 and 2022:
North Valley, New Mexico:
+4.4%
New Mexico:
+110.4%
Discuss North Valley, New Mexico (NM) on our hugely popular New Mexico forum.