The median household income in Riverbend, WA in 2022 was $145,657, which was 37.3% greater than the median annual income of $91,306 across the entire state of Washington. Compared to the median income of $69,716 in 2000 this represents an increase of 52.1%. The per capita income in 2022 was $66,181, which means an increase of 61.9% compared to 2000 when it was $25,234.
Whole page based on the data from 2000 / 2022 when the population of Riverbend, Washington was 2,230 / 2,052
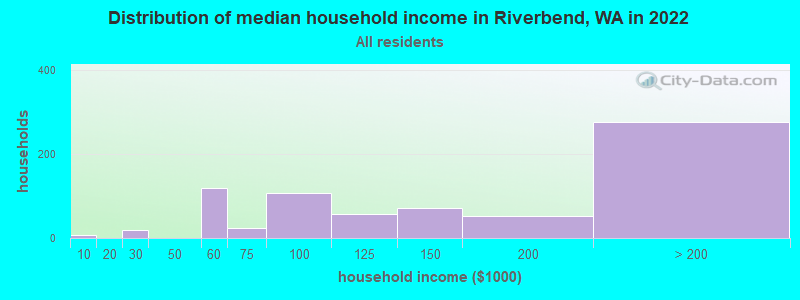
Income statistics for all residents
Median household income in Riverbend, WA in 2022:
Riverbend:
$145,658
State:
$91,306
Change in median household income between 2000 and 2022:
Riverbend, Washington:
+108.9%
State:
+99.5%
Number of households with income < $10k:
Riverbend:
1.1% (8)
State:
4.5% (139,331)
Number of households with income $10k - 20k:
Riverbend:
0.0% (0)
State:
5.0% (154,508)
Number of households with income $20k - 30k:
Riverbend:
2.5% (18)
Washington:
5.4% (166,555)
Number of households with income $30k - 40k:
Riverbend:
0.0% (0)
State:
5.5% (170,324)
Number of households with income $40k - 50k:
Riverbend:
0.0% (0)
State:
6.0% (183,941)
Number of households with income $50k - 60k:
Riverbend:
16.1% (118)
State:
6.1% (187,395)
Number of households with income $60k - 75k:
Riverbend:
3.3% (24)
Washington:
8.7% (266,771)
Number of households with income $75k - 100k:
Riverbend:
14.5% (106)
State:
13.1% (404,672)
Number of households with income $100k - 125k:
Riverbend:
7.9% (58)
State:
11.0% (337,911)
Number of households with income $125k - 150k:
Riverbend:
9.7% (71)
State:
8.0% (244,934)
Number of households with income $150k - 200k:
Riverbend:
7.2% (53)
State:
10.5% (323,812)
Number of households with income > $200k:
Riverbend:
37.7% (276)
Washington:
16.2% (499,799)
Aggregate household income in Riverbend in 2022: $133,575,017
Median family income in Riverbend in 2022:
Riverbend:
$142,655
State:
$109,192
Number of families with income < $10k:
Riverbend:
1.2% (7)
State:
2.9% (55,953)
Number of families with income $20k - 30k:
Riverbend:
1.0% (6)
Washington:
3.2% (61,974)
Number of families with income $50k - 60k:
Riverbend:
13.8% (83)
State:
5.3% (101,674)
Number of families with income $60k - 75k:
Riverbend:
3.4% (21)
Washington:
8.2% (158,348)
Number of families with income $75k - 100k:
Riverbend:
17.3% (104)
State:
13.8% (267,812)
Number of families with income $100k - 125k:
Riverbend:
9.7% (59)
State:
12.4% (240,213)
Number of families with income $125k - 150k:
Riverbend:
11.0% (66)
State:
9.3% (180,011)
Number of families with income $150k - 200k:
Riverbend:
5.9% (36)
State:
13.0% (250,874)
Number of families with income > $200k:
Riverbend:
36.6% (221)
Washington:
20.4% (393,898)
Median per capita income in Riverbend in 2022:
Riverbend:
$66,181
Washington:
$50,764
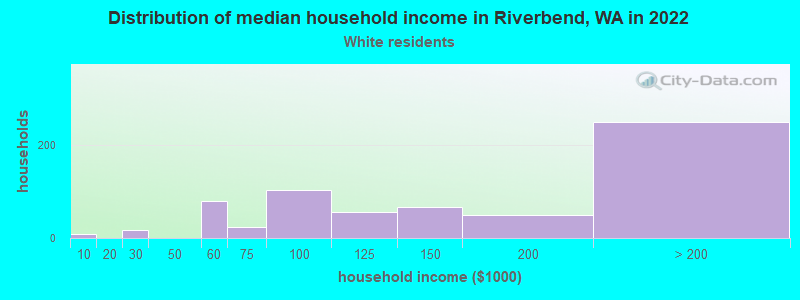
Income statistics for White residents
Median household income in Riverbend, WA in 2022:
Riverbend:
$146,465
Washington:
$91,916
Change in median household income between 2000 and 2022:
Riverbend, Washington:
+112.7%
State:
+95.4%
Number of households with income < $10k:
Riverbend:
1.2% (8)
Washington:
4.3% (95,850)
Number of households with income $10k - 20k:
Riverbend:
0.0% (0)
State:
4.8% (106,421)
Number of households with income $20k - 30k:
Riverbend:
2.6% (17)
State:
5.5% (122,860)
Number of households with income $30k - 40k:
Riverbend:
0.0% (0)
State:
5.4% (119,627)
Number of households with income $40k - 50k:
Riverbend:
0.0% (0)
Washington:
5.9% (132,276)
Number of households with income $50k - 60k:
Riverbend:
12.2% (79)
Washington:
6.1% (136,212)
Number of households with income $60k - 75k:
Riverbend:
3.5% (23)
Washington:
8.8% (196,086)
Number of households with income $75k - 100k:
Riverbend:
15.9% (103)
State:
13.4% (299,192)
Number of households with income $100k - 125k:
Riverbend:
8.5% (55)
State:
11.3% (252,209)
Number of households with income $125k - 150k:
Riverbend:
10.2% (66)
State:
7.9% (175,962)
Number of households with income $150k - 200k:
Riverbend:
7.6% (49)
Washington:
10.7% (239,156)
Number of households with income > $200k:
Riverbend:
38.4% (249)
State:
16.1% (359,917)
Aggregate household income in Riverbend in 2022: $122,081,995
Median family income in Riverbend in 2022:
Riverbend:
$150,351
Washington:
$112,511
Number of families with income < $10k:
Riverbend:
1.2% (6)
State:
2.4% (33,676)
Number of families with income $20k - 30k:
Riverbend:
1.0% (5)
Washington:
2.9% (39,288)
Number of families with income $50k - 60k:
Riverbend:
8.4% (44)
State:
5.0% (69,270)
Number of families with income $60k - 75k:
Riverbend:
3.9% (20)
State:
8.2% (112,369)
Number of families with income $75k - 100k:
Riverbend:
19.8% (104)
State:
14.1% (194,214)
Number of families with income $100k - 125k:
Riverbend:
10.6% (55)
State:
13.2% (182,184)
Number of families with income $125k - 150k:
Riverbend:
11.5% (60)
State:
9.5% (130,928)
Number of families with income $150k - 200k:
Riverbend:
6.3% (33)
State:
13.7% (188,621)
Number of families with income > $200k:
Riverbend:
37.4% (195)
Washington:
20.8% (285,982)
Median per capita income in Riverbend in 2022:
Riverbend:
$69,651
Washington:
$55,212
Income statistics for Asian residents
Median per capita income in Riverbend in 2022:
Riverbend:
$103,967
State:
$67,666
Income statistics for Hispanic or Latino residents
Number of households with income < $10k:
Riverbend:
0.0% (0)
State:
4.9% (14,456)
Number of households with income $10k - 20k:
Riverbend:
0.0% (0)
State:
5.3% (15,449)
Number of households with income $20k - 30k:
Riverbend:
0.0% (0)
State:
6.8% (20,016)
Number of households with income $30k - 40k:
Riverbend:
0.0% (0)
State:
7.7% (22,548)
Number of households with income $40k - 50k:
Riverbend:
0.0% (0)
State:
7.3% (21,450)
Number of households with income $50k - 60k:
Riverbend:
0.0% (0)
State:
7.7% (22,744)
Number of households with income $60k - 75k:
Riverbend:
0.0% (0)
Washington:
10.5% (30,737)
Number of households with income $75k - 100k:
Riverbend:
0.0% (0)
State:
14.9% (43,843)
Number of households with income $100k - 125k:
Riverbend:
0.0% (0)
Washington:
11.1% (32,554)
Number of households with income $125k - 150k:
Riverbend:
0.0% (0)
State:
7.4% (21,624)
Number of households with income $150k - 200k:
Riverbend:
0.0% (0)
Washington:
7.3% (21,360)
Number of households with income > $200k:
Riverbend:
100.0% (24)
State:
9.2% (27,055)
Aggregate household income in Riverbend in 2022: $14,908,475
Median per capita income in Riverbend in 2022:
Riverbend:
$42,198
State:
$28,252
Change in median per capita income between 2000 and 2022:: -22.3%
Riverbend, Washington:
-22.3%
Washington:
+150.2%
Income statistics for American Indian and Alaska Native residents
Number of households with income < $10k:
Riverbend:
0.0% (0)
State:
5.9% (1,768)
Number of households with income $10k - 20k:
Riverbend:
0.0% (0)
Washington:
8.9% (2,694)
Number of households with income $20k - 30k:
Riverbend:
0.0% (0)
Washington:
8.0% (2,412)
Number of households with income $30k - 40k:
Riverbend:
0.0% (0)
Washington:
7.7% (2,327)
Number of households with income $40k - 50k:
Riverbend:
0.0% (0)
State:
5.8% (1,755)
Number of households with income $50k - 60k:
Riverbend:
100.0% (25)
State:
7.5% (2,259)
Number of households with income $60k - 75k:
Riverbend:
0.0% (0)
State:
8.8% (2,669)
Number of households with income $75k - 100k:
Riverbend:
0.0% (0)
State:
12.8% (3,861)
Number of households with income $100k - 125k:
Riverbend:
0.0% (0)
State:
12.0% (3,618)
Number of households with income $125k - 150k:
Riverbend:
0.0% (0)
State:
8.6% (2,580)
Number of households with income $150k - 200k:
Riverbend:
0.0% (0)
State:
5.9% (1,774)
Number of households with income > $200k:
Riverbend:
0.0% (0)
State:
8.1% (2,447)
Median per capita income in Riverbend in 2022:
Riverbend:
$33,740
Washington:
$27,053
Change in median per capita income between 2000 and 2022:
Riverbend, Washington:
+68.7%
Washington:
+98.6%
Income statistics for Multirace residents
Median per capita income in Riverbend in 2022:
Riverbend:
$58,915
Washington:
$32,496
Change in median per capita income between 2000 and 2022:
Riverbend, Washington:
+39.0%
State:
+156.8%
Income statistics for other residents
Number of households with income < $10k:
Riverbend:
0.0% (0)
State:
5.3% (6,540)
Number of households with income $10k - 20k:
Riverbend:
0.0% (0)
State:
6.0% (7,385)
Number of households with income $20k - 30k:
Riverbend:
0.0% (0)
State:
7.5% (9,289)
Number of households with income $30k - 40k:
Riverbend:
0.0% (0)
State:
8.9% (11,015)
Number of households with income $40k - 50k:
Riverbend:
0.0% (0)
State:
7.6% (9,399)
Number of households with income $50k - 60k:
Riverbend:
0.0% (0)
State:
7.2% (8,867)
Number of households with income $60k - 75k:
Riverbend:
0.0% (0)
State:
10.5% (13,032)
Number of households with income $75k - 100k:
Riverbend:
0.0% (0)
Washington:
14.6% (18,007)
Number of households with income $100k - 125k:
Riverbend:
0.0% (0)
Washington:
12.2% (15,128)
Number of households with income $125k - 150k:
Riverbend:
0.0% (0)
Washington:
5.6% (6,950)
Number of households with income $150k - 200k:
Riverbend:
0.0% (0)
State:
7.1% (8,749)
Number of households with income > $200k:
Riverbend:
100.0% (19)
State:
7.5% (9,208)
Aggregate household income in Riverbend in 2022: $8,136,458
Median per capita income in Riverbend in 2022:
Riverbend:
$64,703
Washington:
$27,542
Change in median per capita income between 2000 and 2022:
Riverbend, Washington:
+4.4%
State:
+167.8%
Discuss Riverbend, Washington (WA) on our hugely popular Washington forum.