The median household income in Terrebonne, OR in 2022 was $70,534, which was 7.3% less than the median annual income of $75,657 across the entire state of Oregon. Compared to the median income of $37,674 in 2000 this represents an increase of 46.6%. The per capita income in 2022 was $43,405, which means an increase of 59.2% compared to 2000 when it was $17,698.
Whole page based on the data from 2000 / 2022 when the population of Terrebonne, Oregon was 1,469 / 1,345
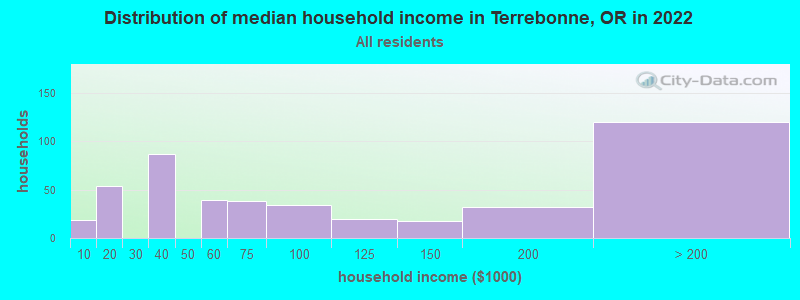
Income statistics for all residents
Median household income in Terrebonne, OR in 2022:
Terrebonne:
$70,535
State:
$75,657
Change in median household income between 2000 and 2022:
Terrebonne, Oregon:
+87.2%
State:
+84.9%
Number of households with income < $10k:
Terrebonne:
4.1% (19)
State:
5.1% (87,297)
Number of households with income $10k - 20k:
Terrebonne:
11.7% (54)
State:
6.7% (115,299)
Number of households with income $20k - 30k:
Terrebonne:
0.0% (0)
State:
6.9% (119,114)
Number of households with income $30k - 40k:
Terrebonne:
18.9% (87)
State:
7.1% (122,333)
Number of households with income $40k - 50k:
Terrebonne:
0.0% (0)
State:
7.2% (124,562)
Number of households with income $50k - 60k:
Terrebonne:
8.5% (39)
Oregon:
6.9% (118,435)
Number of households with income $60k - 75k:
Terrebonne:
8.2% (38)
Oregon:
9.8% (168,926)
Number of households with income $75k - 100k:
Terrebonne:
7.4% (34)
State:
13.3% (229,104)
Number of households with income $100k - 125k:
Terrebonne:
4.3% (20)
State:
10.5% (181,787)
Number of households with income $125k - 150k:
Terrebonne:
3.9% (18)
State:
7.4% (127,392)
Number of households with income $150k - 200k:
Terrebonne:
6.9% (32)
Oregon:
8.6% (148,614)
Number of households with income > $200k:
Terrebonne:
26.0% (120)
State:
10.6% (183,477)
Aggregate household income in Terrebonne in 2022: $54,283,037
Median family income in Terrebonne in 2022:
Terrebonne:
$122,757
State:
$93,384
Number of families with income < $10k:
Terrebonne:
8.3% (31)
State:
3.1% (32,019)
Number of families with income $30k - 40k:
Terrebonne:
19.2% (72)
State:
5.8% (60,772)
Number of families with income $50k - 60k:
Terrebonne:
9.1% (34)
State:
6.1% (63,915)
Number of families with income $60k - 75k:
Terrebonne:
11.7% (44)
State:
9.9% (102,697)
Number of families with income $75k - 100k:
Terrebonne:
2.7% (10)
State:
14.3% (148,745)
Number of families with income $100k - 125k:
Terrebonne:
5.7% (21)
State:
12.4% (129,023)
Number of families with income $125k - 150k:
Terrebonne:
4.3% (16)
State:
8.8% (91,808)
Number of families with income $150k - 200k:
Terrebonne:
8.2% (31)
State:
11.3% (117,224)
Number of families with income > $200k:
Terrebonne:
30.8% (115)
State:
14.4% (149,534)
Median income for 2 person families:
Terrebonne:
$129,623
Oregon:
$82,858
Median income for families with 0 earners:
Terrebonne:
$0
State:
$57,093
Median income for families with 1 earner:
Terrebonne:
$122,233
State:
$67,488
Median income for families with 2 earners:
Terrebonne:
$0
State:
$119,094
Median income for families with 3+ earners:
Terrebonne:
$0
State:
$141,024
Median non-family income in Terrebonne in 2022:
Terrebonne:
$17,932
Oregon:
$48,114
Change in median non-family income between 2000 and 2022:: -14.0%
Terrebonne, Oregon:
-14.0%
State:
+86.8%
Median per capita income in Terrebonne in 2022:
Terrebonne:
$43,406
State:
$42,474
Change in median per capita income between 2000 and 2022:
Terrebonne, Oregon:
+145.3%
State:
+102.8%
Income statistics for White residents
Number of households with income < $10k:
Terrebonne:
4.2% (18)
State:
4.9% (67,757)
Number of households with income $10k - 20k:
Terrebonne:
12.7% (55)
Oregon:
6.6% (91,229)
Number of households with income $20k - 30k:
Terrebonne:
0.0% (0)
State:
6.8% (93,981)
Number of households with income $30k - 40k:
Terrebonne:
20.4% (88)
State:
6.9% (95,328)
Number of households with income $40k - 50k:
Terrebonne:
0.0% (0)
State:
7.2% (100,221)
Number of households with income $50k - 60k:
Terrebonne:
1.9% (8)
State:
6.9% (95,294)
Number of households with income $60k - 75k:
Terrebonne:
8.8% (38)
Oregon:
9.5% (132,178)
Number of households with income $75k - 100k:
Terrebonne:
7.9% (34)
Oregon:
13.5% (187,105)
Number of households with income $100k - 125k:
Terrebonne:
4.9% (21)
State:
10.5% (145,264)
Number of households with income $125k - 150k:
Terrebonne:
3.9% (17)
Oregon:
7.3% (101,755)
Number of households with income $150k - 200k:
Terrebonne:
7.2% (31)
Oregon:
8.7% (121,099)
Number of households with income > $200k:
Terrebonne:
28.2% (122)
State:
11.1% (153,992)
Aggregate household income in Terrebonne in 2022: $53,090,517
Median family income in Terrebonne in 2022:
Terrebonne:
$132,371
Oregon:
$95,912
Number of families with income < $10k:
Terrebonne:
8.7% (30)
Oregon:
2.8% (23,325)
Number of families with income $30k - 40k:
Terrebonne:
20.6% (70)
State:
5.6% (46,508)
Number of families with income $50k - 60k:
Terrebonne:
1.8% (6)
State:
6.0% (49,589)
Number of families with income $60k - 75k:
Terrebonne:
11.9% (41)
State:
9.4% (77,838)
Number of families with income $75k - 100k:
Terrebonne:
3.0% (10)
Oregon:
14.7% (121,106)
Number of families with income $100k - 125k:
Terrebonne:
6.4% (22)
Oregon:
12.3% (101,829)
Number of families with income $125k - 150k:
Terrebonne:
4.6% (16)
State:
8.9% (73,376)
Number of families with income $150k - 200k:
Terrebonne:
8.8% (30)
State:
11.7% (96,629)
Number of families with income > $200k:
Terrebonne:
34.2% (117)
State:
15.2% (125,084)
Median non-family income in Terrebonne in 2022:
Terrebonne:
$18,094
Oregon:
$48,924
Change in median non-family income between 2000 and 2022:: -12.8%
Terrebonne, Oregon:
-12.8%
State:
+88.0%
Median per capita income in Terrebonne in 2022:
Terrebonne:
$59,018
Oregon:
$45,669
Income statistics for Hispanic or Latino residents
Number of households with income < $10k:
Terrebonne:
0.0% (0)
State:
5.0% (8,626)
Number of households with income $10k - 20k:
Terrebonne:
0.0% (0)
State:
5.4% (9,284)
Number of households with income $20k - 30k:
Terrebonne:
0.0% (0)
State:
8.2% (14,265)
Number of households with income $30k - 40k:
Terrebonne:
0.0% (0)
State:
9.9% (17,228)
Number of households with income $40k - 50k:
Terrebonne:
0.0% (0)
State:
9.2% (16,040)
Number of households with income $50k - 60k:
Terrebonne:
100.0% (26)
Oregon:
7.8% (13,499)
Number of households with income $60k - 75k:
Terrebonne:
0.0% (0)
State:
12.6% (21,845)
Number of households with income $75k - 100k:
Terrebonne:
0.0% (0)
State:
13.6% (23,566)
Number of households with income $100k - 125k:
Terrebonne:
0.0% (0)
State:
10.2% (17,704)
Number of households with income $125k - 150k:
Terrebonne:
0.0% (0)
Oregon:
5.9% (10,188)
Number of households with income $150k - 200k:
Terrebonne:
0.0% (0)
Oregon:
7.1% (12,405)
Number of households with income > $200k:
Terrebonne:
0.0% (0)
Oregon:
5.1% (8,851)
Aggregate household income in Terrebonne in 2022: $9,231,902
Median per capita income in Terrebonne in 2022:
Terrebonne:
$9,350
State:
$25,274
Change in median per capita income between 2000 and 2022:: -2.5%
Terrebonne, Oregon:
-2.5%
Oregon:
+149.8%
Income statistics for Multirace residents
Median per capita income in Terrebonne in 2022:
Terrebonne:
$38,354
State:
$29,750
Change in median per capita income between 2000 and 2022:
Terrebonne, Oregon:
+53.4%
State:
+148.0%
Income statistics for other residents
Number of households with income < $10k:
Terrebonne:
0.0% (0)
State:
5.9% (3,904)
Number of households with income $10k - 20k:
Terrebonne:
0.0% (0)
State:
4.8% (3,221)
Number of households with income $20k - 30k:
Terrebonne:
0.0% (0)
Oregon:
9.4% (6,245)
Number of households with income $30k - 40k:
Terrebonne:
0.0% (0)
Oregon:
9.9% (6,579)
Number of households with income $40k - 50k:
Terrebonne:
0.0% (0)
State:
7.3% (4,871)
Number of households with income $50k - 60k:
Terrebonne:
100.0% (38)
State:
8.2% (5,473)
Number of households with income $60k - 75k:
Terrebonne:
0.0% (0)
State:
13.7% (9,138)
Number of households with income $75k - 100k:
Terrebonne:
0.0% (0)
Oregon:
13.6% (9,057)
Number of households with income $100k - 125k:
Terrebonne:
0.0% (0)
State:
11.0% (7,344)
Number of households with income $125k - 150k:
Terrebonne:
0.0% (0)
State:
7.1% (4,713)
Number of households with income $150k - 200k:
Terrebonne:
0.0% (0)
State:
5.0% (3,350)
Number of households with income > $200k:
Terrebonne:
0.0% (0)
Oregon:
4.0% (2,665)
Aggregate household income in Terrebonne in 2022: $2,375,228
Median per capita income in Terrebonne in 2022:
Terrebonne:
$11,976
Oregon:
$25,226
Change in median per capita income between 2000 and 2022:
Terrebonne, Oregon:
+62.6%
State:
+162.2%
Discuss Terrebonne, Oregon (OR) on our hugely popular Oregon forum.