Wallingford, Connecticut (CT) income map, earnings map, and wages data
The median household income in Wallingford, CT in 2022 was $96,973, which was 8.8% greater than the median annual income of $88,429 across the entire state of Connecticut. Compared to the median income of $57,308 in 2000 this represents an increase of 40.9%. The per capita income in 2022 was $47,464, which means an increase of 45.3% compared to 2000 when it was $25,947.
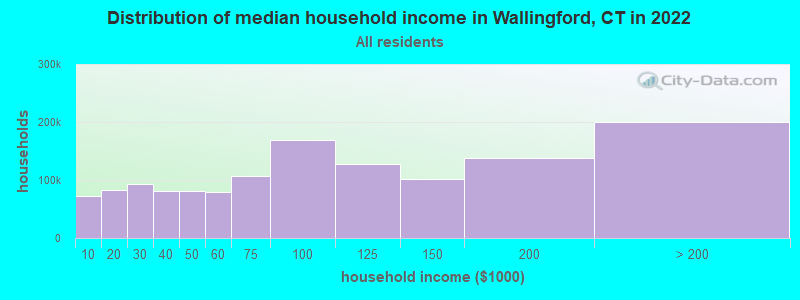
Income statistics for all residents
Median household income in Wallingford, CT in 2022:| Wallingford: | $96,973 |
| Connecticut: | $88,429 |
Change in median household income between 2000 and 2022:| Wallingford, Connecticut: | +69.2% |
| Connecticut: | +64.0% |
Number of households with income < $10k:| Wallingford: | 5.2% (39,499) |
| Connecticut: | 5.1% (72,746) |
Number of households with income $10k - 20k:| Wallingford: | 5.8% (44,541) |
| State: | 5.7% (81,643) |
Number of households with income $20k - 30k:| Wallingford: | 6.6% (50,416) |
| State: | 6.5% (92,844) |
Number of households with income $30k - 40k:| Wallingford: | 5.9% (45,246) |
| State: | 5.9% (83,934) |
Number of households with income $40k - 50k:| Wallingford: | 5.9% (44,955) |
| State: | 5.8% (83,025) |
Number of households with income $50k - 60k:| Wallingford: | 5.8% (44,081) |
| State: | 5.7% (81,788) |
Number of households with income $60k - 75k:| Wallingford: | 8.1% (61,763) |
| State: | 8.1% (115,651) |
Number of households with income $75k - 100k:| Wallingford: | 12.6% (96,460) |
| State: | 12.6% (180,173) |
Number of households with income $100k - 125k:| Wallingford: | 9.8% (75,093) |
| Connecticut: | 9.9% (141,231) |
Number of households with income $125k - 150k:| Wallingford: | 7.8% (59,969) |
| State: | 7.9% (112,826) |
Number of households with income $150k - 200k:| Wallingford: | 10.7% (82,033) |
| State: | 10.8% (154,641) |
Number of households with income > $200k:| Wallingford: | 16.0% (122,553) |
| State: | 16.3% (233,133) |
Aggregate household income in Wallingford in 2022: $47,595,399,646
Median family income in Wallingford in 2022:| Wallingford: | $122,032 |
| State: | $115,183 |
Median non-family income in Wallingford in 2022:| Wallingford: | $55,761 |
| State: | $50,964 |
Change in median non-family income between 2000 and 2022:| Wallingford, Connecticut: | +71.5% |
| State: | +65.1% |
Median per capita income in Wallingford in 2022:| Wallingford: | $47,465 |
| State: | $51,581 |
Change in median per capita income between 2000 and 2022:| Wallingford, Connecticut: | +82.9% |
| State: | +79.3% |
Income statistics for White residents
Median household income in Wallingford, CT in 2022:| Wallingford: | $97,156 |
| Connecticut: | $96,890 |
Change in median household income between 2000 and 2022:| Wallingford, Connecticut: | +69.4% |
| State: | +68.5% |
Number of households with income < $10k:| Wallingford: | 4.2% (21,250) |
| State: | 4.2% (42,265) |
Number of households with income $10k - 20k:| Wallingford: | 4.9% (24,432) |
| Connecticut: | 4.8% (48,323) |
Number of households with income $20k - 30k:| Wallingford: | 5.8% (29,056) |
| State: | 5.7% (57,716) |
Number of households with income $30k - 40k:| Wallingford: | 5.4% (26,895) |
| Connecticut: | 5.3% (53,827) |
Number of households with income $40k - 50k:| Wallingford: | 5.3% (26,783) |
| State: | 5.3% (53,301) |
Number of households with income $50k - 60k:| Wallingford: | 5.6% (27,874) |
| Connecticut: | 5.5% (55,690) |
Number of households with income $60k - 75k:| Wallingford: | 7.9% (39,833) |
| State: | 8.0% (80,329) |
Number of households with income $75k - 100k:| Wallingford: | 12.7% (63,827) |
| State: | 12.7% (128,070) |
Number of households with income $100k - 125k:| Wallingford: | 10.0% (50,120) |
| State: | 10.0% (101,210) |
Number of households with income $125k - 150k:| Wallingford: | 8.0% (40,238) |
| Connecticut: | 8.0% (81,250) |
Number of households with income $150k - 200k:| Wallingford: | 11.8% (59,165) |
| State: | 11.8% (119,527) |
Number of households with income > $200k:| Wallingford: | 18.4% (92,621) |
| State: | 18.6% (187,875) |
Aggregate household income in Wallingford in 2022: $34,517,831,370
Median family income in Wallingford in 2022:| Wallingford: | $125,670 |
| State: | $128,955 |
Number of families with income < $10k:| Wallingford: | 2.2% (185) |
| Connecticut: | 1.9% (11,537) |
Number of families with income $10k - 20k:| Wallingford: | 2.1% (180) |
| State: | 1.8% (11,289) |
Number of families with income $20k - 30k:| Wallingford: | 3.3% (279) |
| State: | 3.0% (18,506) |
Number of families with income $30k - 40k:| Wallingford: | 3.8% (319) |
| State: | 2.9% (18,160) |
Number of families with income $40k - 50k:| Wallingford: | 4.4% (373) |
| Connecticut: | 3.9% (24,550) |
Number of families with income $50k - 60k:| Wallingford: | 5.3% (446) |
| State: | 4.3% (26,723) |
Number of families with income $60k - 75k:| Wallingford: | 9.6% (807) |
| State: | 7.1% (44,075) |
Number of families with income $75k - 100k:| Wallingford: | 17.0% (1,428) |
| State: | 12.5% (77,679) |
Number of families with income $100k - 125k:| Wallingford: | 13.7% (1,149) |
| Connecticut: | 11.1% (69,086) |
Number of families with income $125k - 150k:| Wallingford: | 10.5% (880) |
| State: | 9.6% (59,616) |
Number of families with income $150k - 200k:| Wallingford: | 17.3% (1,458) |
| State: | 15.7% (97,890) |
Number of families with income > $200k:| Wallingford: | 10.7% (903) |
| State: | 26.3% (163,417) |
Median non-family income in Wallingford in 2022:| Wallingford: | $56,415 |
| State: | $54,067 |
Change in median non-family income between 2000 and 2022:| Wallingford, Connecticut: | +73.7% |
| Connecticut: | +68.7% |
Median per capita income in Wallingford in 2022:| Wallingford: | $50,532 |
| Connecticut: | $59,916 |
Change in median per capita income between 2000 and 2022:| Wallingford, Connecticut: | +92.1% |
| Connecticut: | +90.2% |
Income statistics for Black or African American residents
Median household income in Wallingford, CT in 2022:| Wallingford: | $90,223 |
| State: | $61,803 |
Change in median household income between 2000 and 2022:| Wallingford, Connecticut: | +60.9% |
| Connecticut: | +76.1% |
Number of households with income < $10k:| Wallingford: | 6.8% (15,165) |
| State: | 6.8% (9,494) |
Number of households with income $10k - 20k:| Wallingford: | 7.9% (17,575) |
| Connecticut: | 7.9% (11,003) |
Number of households with income $20k - 30k:| Wallingford: | 10.8% (24,031) |
| Connecticut: | 10.8% (15,045) |
Number of households with income $30k - 40k:| Wallingford: | 8.2% (18,370) |
| Connecticut: | 8.2% (11,501) |
Number of households with income $40k - 50k:| Wallingford: | 7.4% (16,637) |
| State: | 7.4% (10,416) |
Number of households with income $50k - 60k:| Wallingford: | 7.5% (16,826) |
| Connecticut: | 7.5% (10,534) |
Number of households with income $60k - 75k:| Wallingford: | 8.0% (17,960) |
| State: | 8.0% (11,244) |
Number of households with income $75k - 100k:| Wallingford: | 9.6% (21,356) |
| Connecticut: | 9.6% (13,370) |
Number of households with income $100k - 125k:| Wallingford: | 10.2% (22,752) |
| State: | 10.2% (14,244) |
Number of households with income $125k - 150k:| Wallingford: | 8.0% (17,963) |
| Connecticut: | 8.0% (11,246) |
Number of households with income $150k - 200k:| Wallingford: | 7.7% (17,134) |
| Connecticut: | 7.7% (10,727) |
Number of households with income > $200k:| Wallingford: | 7.9% (17,707) |
| State: | 7.9% (11,086) |
Aggregate household income in Wallingford in 2022: $65,849,599
Median family income in Wallingford in 2022:| Wallingford: | $180,742 |
| Connecticut: | $87,228 |
Number of families with income $10k - 20k:| Wallingford: | 0.2% (1) |
| State: | 4.8% (4,026) |
Number of families with income $20k - 30k:| Wallingford: | 5.3% (12) |
| State: | 6.0% (5,015) |
Number of families with income $30k - 40k:| Wallingford: | 3.2% (7) |
| Connecticut: | 7.7% (6,445) |
Number of families with income $40k - 50k:| Wallingford: | 5.1% (12) |
| State: | 6.6% (5,531) |
Number of families with income $50k - 60k:| Wallingford: | 2.3% (5) |
| State: | 5.4% (4,480) |
Number of families with income $75k - 100k:| Wallingford: | 17.5% (40) |
| State: | 12.7% (10,598) |
Number of families with income $100k - 125k:| Wallingford: | 66.4% (151) |
| Connecticut: | 11.4% (9,482) |
Median non-family income in Wallingford in 2022:| Wallingford: | $79,862 |
| State: | $38,608 |
Change in median non-family income between 2000 and 2022:| Wallingford, Connecticut: | +77.0% |
| Connecticut: | +77.0% |
Median per capita income in Wallingford in 2022:| Wallingford: | $54,276 |
| State: | $36,289 |
Change in median per capita income between 2000 and 2022:| Wallingford, Connecticut: | +115.2% |
| State: | +117.5% |
Income statistics for Asian residents
Median household income in Wallingford, CT in 2022:| Wallingford: | $136,557 |
| Connecticut: | $110,568 |
Change in median household income between 2000 and 2022:| Wallingford, Connecticut: | +110.1% |
| State: | +79.5% |
Number of households with income < $10k:| Wallingford: | 7.1% (4,480) |
| State: | 7.1% (4,245) |
Number of households with income $10k - 20k:| Wallingford: | 3.5% (2,202) |
| Connecticut: | 3.5% (2,087) |
Number of households with income $20k - 30k:| Wallingford: | 4.1% (2,601) |
| State: | 4.1% (2,464) |
Number of households with income $30k - 40k:| Wallingford: | 4.1% (2,615) |
| Connecticut: | 4.1% (2,478) |
Number of households with income $40k - 50k:| Wallingford: | 3.3% (2,093) |
| State: | 3.3% (1,983) |
Number of households with income $50k - 60k:| Wallingford: | 3.9% (2,457) |
| State: | 3.9% (2,328) |
Number of households with income $60k - 75k:| Wallingford: | 7.0% (4,462) |
| Connecticut: | 7.0% (4,228) |
Number of households with income $75k - 100k:| Wallingford: | 11.5% (7,294) |
| Connecticut: | 11.5% (6,911) |
Number of households with income $100k - 125k:| Wallingford: | 10.2% (6,467) |
| State: | 10.2% (6,127) |
Number of households with income $125k - 150k:| Wallingford: | 8.5% (5,360) |
| Connecticut: | 8.5% (5,079) |
Number of households with income $150k - 200k:| Wallingford: | 12.4% (7,846) |
| State: | 12.4% (7,434) |
Number of households with income > $200k:| Wallingford: | 24.4% (15,473) |
| State: | 24.4% (14,661) |
Aggregate household income in Wallingford in 2022: $91,336,718
Median family income in Wallingford in 2022:| Wallingford: | $133,562 |
| State: | $134,548 |
Number of families with income < $10k:| Wallingford: | 2.6% (11) |
| Connecticut: | 4.3% (1,875) |
Number of families with income $20k - 30k:| Wallingford: | 9.6% (40) |
| State: | 3.8% (1,682) |
Number of families with income $30k - 40k:| Wallingford: | 8.3% (34) |
| State: | 3.8% (1,652) |
Number of families with income $40k - 50k:| Wallingford: | 4.0% (17) |
| State: | 2.0% (863) |
Number of families with income $50k - 60k:| Wallingford: | 3.9% (16) |
| Connecticut: | 3.7% (1,635) |
Number of families with income $60k - 75k:| Wallingford: | 9.9% (41) |
| State: | 6.0% (2,651) |
Number of families with income $75k - 100k:| Wallingford: | 9.4% (39) |
| State: | 11.0% (4,844) |
Number of families with income $100k - 125k:| Wallingford: | 14.7% (61) |
| Connecticut: | 10.5% (4,621) |
Number of families with income $125k - 150k:| Wallingford: | 8.4% (35) |
| State: | 8.2% (3,588) |
Number of families with income $150k - 200k:| Wallingford: | 20.7% (86) |
| State: | 14.2% (6,237) |
Number of families with income > $200k:| Wallingford: | 8.6% (36) |
| State: | 30.8% (13,522) |
Median non-family income in Wallingford in 2022:| Wallingford: | $34,492 |
| State: | $63,785 |
Change in median non-family income between 2000 and 2022:| Wallingford, Connecticut: | +148.6% |
| State: | +77.9% |
Median per capita income in Wallingford in 2022:| Wallingford: | $41,512 |
| State: | $55,295 |
Change in median per capita income between 2000 and 2022:| Wallingford, Connecticut: | +103.6% |
| State: | +97.8% |
Income statistics for Hispanic or Latino residents
Median household income in Wallingford, CT in 2022:| Wallingford: | $75,974 |
| State: | $60,275 |
Change in median household income between 2000 and 2022:| Wallingford, Connecticut: | +67.8% |
| Connecticut: | +87.9% |
Number of households with income < $10k:| Wallingford: | 8.7% (26,234) |
| State: | 8.7% (18,584) |
Number of households with income $10k - 20k:| Wallingford: | 9.1% (27,152) |
| State: | 9.1% (19,235) |
Number of households with income $20k - 30k:| Wallingford: | 8.9% (26,806) |
| Connecticut: | 8.9% (18,989) |
Number of households with income $30k - 40k:| Wallingford: | 7.5% (22,539) |
| State: | 7.5% (15,967) |
Number of households with income $40k - 50k:| Wallingford: | 8.7% (26,067) |
| State: | 8.7% (18,466) |
Number of households with income $50k - 60k:| Wallingford: | 6.9% (20,759) |
| State: | 6.9% (14,706) |
Number of households with income $60k - 75k:| Wallingford: | 8.9% (26,663) |
| State: | 8.9% (18,888) |
Number of households with income $75k - 100k:| Wallingford: | 13.5% (40,470) |
| State: | 13.5% (28,669) |
Number of households with income $100k - 125k:| Wallingford: | 8.2% (24,610) |
| State: | 8.2% (17,434) |
Number of households with income $125k - 150k:| Wallingford: | 6.5% (19,413) |
| Connecticut: | 6.5% (13,752) |
Number of households with income $150k - 200k:| Wallingford: | 6.6% (19,924) |
| Connecticut: | 6.6% (14,114) |
Number of households with income > $200k:| Wallingford: | 6.4% (19,241) |
| State: | 6.4% (13,630) |
Aggregate household income in Wallingford in 2022: $209,130,515
Median family income in Wallingford in 2022:| Wallingford: | $83,918 |
| State: | $68,336 |
Number of families with income < $10k:| Wallingford: | 4.0% (85) |
| Connecticut: | 5.2% (7,456) |
Number of families with income $10k - 20k:| Wallingford: | 6.4% (136) |
| Connecticut: | 6.0% (8,616) |
Number of families with income $20k - 30k:| Wallingford: | 10.2% (215) |
| State: | 8.9% (12,680) |
Number of families with income $30k - 40k:| Wallingford: | 8.3% (175) |
| State: | 8.5% (12,090) |
Number of families with income $40k - 50k:| Wallingford: | 8.4% (178) |
| State: | 8.8% (12,624) |
Number of families with income $50k - 60k:| Wallingford: | 9.7% (205) |
| State: | 8.4% (11,924) |
Number of families with income $60k - 75k:| Wallingford: | 10.2% (217) |
| State: | 8.9% (12,677) |
Number of families with income $75k - 100k:| Wallingford: | 17.6% (372) |
| State: | 14.3% (20,457) |
Number of families with income $100k - 125k:| Wallingford: | 8.5% (181) |
| State: | 8.2% (11,720) |
Number of families with income $125k - 150k:| Wallingford: | 7.9% (167) |
| State: | 8.2% (11,729) |
Number of families with income $150k - 200k:| Wallingford: | 6.4% (136) |
| Connecticut: | 7.1% (10,096) |
Number of families with income > $200k:| Wallingford: | 2.3% (49) |
| State: | 7.4% (10,622) |
Median non-family income in Wallingford in 2022:| Wallingford: | $35,212 |
| State: | $36,714 |
Change in median non-family income between 2000 and 2022:| Wallingford, Connecticut: | +73.9% |
| State: | +90.0% |
Median per capita income in Wallingford in 2022:| Wallingford: | $25,897 |
| Connecticut: | $28,507 |
Change in median per capita income between 2000 and 2022:| Wallingford, Connecticut: | +80.3% |
| State: | +117.2% |
Income statistics for American Indian and Alaska Native residents
Median household income in Wallingford, CT in 2022:| Wallingford: | $90,647 |
| State: | $41,848 |
Change in median household income between 2000 and 2022:| Wallingford, Connecticut: | +12.9% |
| Connecticut: | +12.9% |
Number of households with income < $10k:| Wallingford: | 8.4% (228,380) |
| Connecticut: | 10.2% (340) |
Number of households with income $10k - 20k:| Wallingford: | 9.4% (254,867) |
| State: | 8.5% (283) |
Number of households with income $20k - 30k:| Wallingford: | 8.5% (230,530) |
| Connecticut: | 9.4% (314) |
Number of households with income $30k - 40k:| Wallingford: | 9.1% (246,984) |
| State: | 10.1% (337) |
Number of households with income $40k - 50k:| Wallingford: | 8.3% (226,550) |
| Connecticut: | 13.4% (447) |
Number of households with income $50k - 60k:| Wallingford: | 7.8% (213,619) |
| Connecticut: | 3.1% (104) |
Number of households with income $60k - 75k:| Wallingford: | 9.8% (266,266) |
| State: | 5.6% (188) |
Number of households with income $75k - 100k:| Wallingford: | 12.6% (343,707) |
| Connecticut: | 13.4% (447) |
Number of households with income $100k - 125k:| Wallingford: | 9.4% (257,024) |
| State: | 9.5% (317) |
Number of households with income $125k - 150k:| Wallingford: | 5.6% (153,879) |
| Connecticut: | 3.9% (131) |
Number of households with income $150k - 200k:| Wallingford: | 6.0% (162,218) |
| State: | 6.3% (212) |
Number of households with income > $200k:| Wallingford: | 5.2% (140,409) |
| Connecticut: | 6.8% (228) |
Aggregate household income in Wallingford in 2022: $1,337,343
Median family income in Wallingford in 2022:| Wallingford: | $109,981 |
| State: | $57,217 |
Number of families with income $75k - 100k:| Wallingford: | 100.0% (24) |
| Connecticut: | 17.4% (349) |
Median non-family income in Wallingford in 2022:| Wallingford: | $149,117 |
| State: | $40,310 |
Change in median non-family income between 2000 and 2022:| Wallingford, Connecticut: | +125.1% |
| State: | +125.1% |
Median per capita income in Wallingford in 2022:| Wallingford: | $30,572 |
| State: | $25,355 |
Change in median per capita income between 2000 and 2022:| Wallingford, Connecticut: | +45.9% |
| State: | +39.4% |
Income statistics for Multirace residents
Median household income in Wallingford, CT in 2022:| Wallingford: | $132,289 |
| State: | $77,277 |
Change in median household income between 2000 and 2022:| Wallingford, Connecticut: | +119.4% |
| Connecticut: | +113.6% |
Number of households with income < $10k:| Wallingford: | 6.0% (12,423) |
| State: | 6.0% (7,457) |
Number of households with income $10k - 20k:| Wallingford: | 8.1% (16,891) |
| State: | 8.1% (10,139) |
Number of households with income $20k - 30k:| Wallingford: | 7.0% (14,497) |
| Connecticut: | 7.0% (8,702) |
Number of households with income $30k - 40k:| Wallingford: | 6.9% (14,237) |
| State: | 6.9% (8,546) |
Number of households with income $40k - 50k:| Wallingford: | 7.0% (14,514) |
| State: | 7.0% (8,712) |
Number of households with income $50k - 60k:| Wallingford: | 5.9% (12,213) |
| State: | 5.9% (7,331) |
Number of households with income $60k - 75k:| Wallingford: | 8.5% (17,716) |
| State: | 8.5% (10,634) |
Number of households with income $75k - 100k:| Wallingford: | 14.1% (29,321) |
| State: | 14.1% (17,600) |
Number of households with income $100k - 125k:| Wallingford: | 9.9% (20,629) |
| State: | 9.9% (12,383) |
Number of households with income $125k - 150k:| Wallingford: | 7.2% (14,862) |
| Connecticut: | 7.2% (8,921) |
Number of households with income $150k - 200k:| Wallingford: | 8.8% (18,195) |
| State: | 8.8% (10,922) |
Number of households with income > $200k:| Wallingford: | 10.6% (22,069) |
| State: | 10.6% (13,247) |
Aggregate household income in Wallingford in 2022: $183,514,326
Median family income in Wallingford in 2022:| Wallingford: | $133,307 |
| State: | $84,255 |
Number of families with income $10k - 20k:| Wallingford: | 3.7% (31) |
| Connecticut: | 4.8% (4,079) |
Number of families with income $20k - 30k:| Wallingford: | 7.7% (64) |
| State: | 6.9% (5,812) |
Number of families with income $50k - 60k:| Wallingford: | 3.3% (27) |
| State: | 7.6% (6,420) |
Number of families with income $60k - 75k:| Wallingford: | 15.1% (126) |
| Connecticut: | 7.8% (6,550) |
Number of families with income $75k - 100k:| Wallingford: | 16.4% (137) |
| State: | 14.5% (12,236) |
Number of families with income $100k - 125k:| Wallingford: | 28.4% (236) |
| State: | 9.2% (7,787) |
Number of families with income > $200k:| Wallingford: | 25.4% (211) |
| Connecticut: | 13.7% (11,603) |
Median non-family income in Wallingford in 2022:| Wallingford: | $57,136 |
| State: | $44,462 |
Change in median non-family income between 2000 and 2022:| Wallingford, Connecticut: | +81.0% |
| Connecticut: | +97.6% |
Median per capita income in Wallingford in 2022:| Wallingford: | $42,827 |
| State: | $32,794 |
Change in median per capita income between 2000 and 2022:| Wallingford, Connecticut: | +95.5% |
| Connecticut: | +117.2% |
Income statistics for other residents
Number of households with income < $10k:| Wallingford: | 9.0% (44) |
| Connecticut: | 9.0% (8,596) |
Number of households with income $10k - 20k:| Wallingford: | 10.2% (50) |
| State: | 10.2% (9,773) |
Number of households with income $20k - 30k:| Wallingford: | 9.0% (44) |
| State: | 9.1% (8,691) |
Number of households with income $30k - 40k:| Wallingford: | 7.8% (38) |
| State: | 7.8% (7,447) |
Number of households with income $40k - 50k:| Wallingford: | 8.2% (40) |
| Connecticut: | 8.2% (7,860) |
Number of households with income $50k - 60k:| Wallingford: | 5.9% (29) |
| State: | 6.0% (5,757) |
Number of households with income $60k - 75k:| Wallingford: | 9.2% (45) |
| State: | 9.3% (8,942) |
Number of households with income $75k - 100k:| Wallingford: | 14.3% (70) |
| Connecticut: | 14.3% (13,700) |
Number of households with income $100k - 125k:| Wallingford: | 7.2% (35) |
| State: | 7.2% (6,906) |
Number of households with income $125k - 150k:| Wallingford: | 6.6% (32) |
| State: | 6.5% (6,215) |
Number of households with income $150k - 200k:| Wallingford: | 6.1% (30) |
| Connecticut: | 6.1% (5,865) |
Number of households with income > $200k:| Wallingford: | 6.4% (31) |
| Connecticut: | 6.3% (6,065) |
Aggregate household income in Wallingford in 2022: $68,262,661
Median family income in Wallingford in 2022:| Wallingford: | $130,023 |
| State: | $67,610 |
Number of families with income < $10k:| Wallingford: | 1.4% (6) |
| State: | 5.0% (3,311) |
Number of families with income $10k - 20k:| Wallingford: | 1.1% (5) |
| Connecticut: | 7.5% (4,961) |
Number of families with income $20k - 30k:| Wallingford: | 4.4% (19) |
| Connecticut: | 8.7% (5,752) |
Number of families with income $30k - 40k:| Wallingford: | 5.1% (21) |
| Connecticut: | 9.1% (5,996) |
Number of families with income $40k - 50k:| Wallingford: | 2.8% (12) |
| Connecticut: | 9.1% (6,039) |
Number of families with income $50k - 60k:| Wallingford: | 8.7% (37) |
| Connecticut: | 5.9% (3,868) |
Number of families with income $60k - 75k:| Wallingford: | 7.6% (32) |
| State: | 9.4% (6,232) |
Number of families with income $75k - 100k:| Wallingford: | 47.9% (202) |
| State: | 15.7% (10,362) |
Number of families with income $125k - 150k:| Wallingford: | 21.1% (89) |
| State: | 9.0% (5,971) |
Median non-family income in Wallingford in 2022:| Wallingford: | $61,649 |
| Connecticut: | $34,285 |
Change in median non-family income between 2000 and 2022:| Wallingford, Connecticut: | +83.6% |
| State: | +83.6% |
Median per capita income in Wallingford in 2022:| Wallingford: | $37,375 |
| State: | $29,353 |