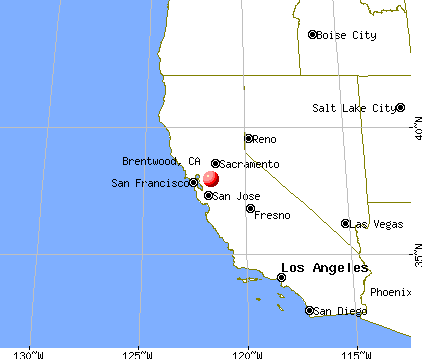
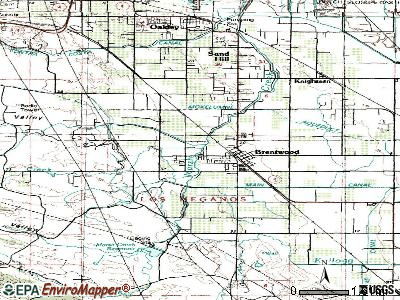
Brentwood, California
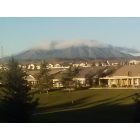
Brentwood: View of Mount Diabolo crowned by the only cloud in the sky January 2013
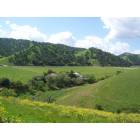
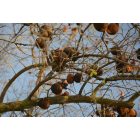
Brentwood: Brentwood Country
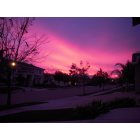
Brentwood: my street on dec 15 2010
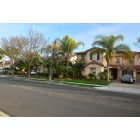
Brentwood: Brentwood home
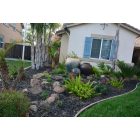
Brentwood: Brentwood home
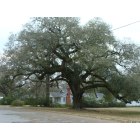
Brentwood: Brentwood park
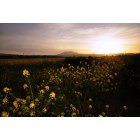
Brentwood: Brentwood view of the mountain
Brentwood
Brentwood: Golf Club
Brentwood
- add
your


Submit your own pictures of this city and show them to the world
- OSM Map
- General Map
- Google Map
- MSN Map
Population change since 2000: +183.8%
| Males: 32,303 | |
| Females: 33,824 |
| Median resident age: | 39.8 years |
| California median age: | 37.9 years |
Zip codes: 94513.
| Brentwood: | $132,610 |
| CA: | $91,551 |
Estimated per capita income in 2022: $55,382 (it was $24,909 in 2000)
Brentwood city income, earnings, and wages data
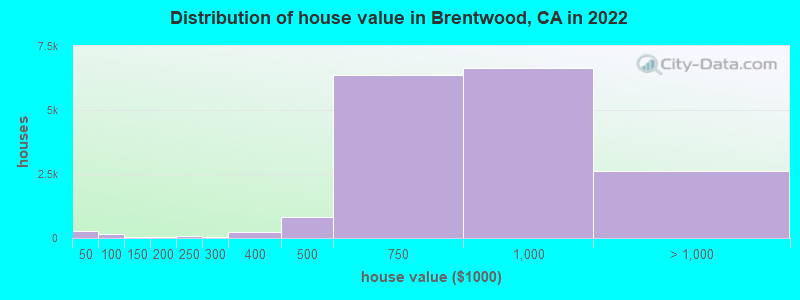
Estimated median house or condo value in 2022: $874,500 (it was $249,000 in 2000)
| Brentwood: | $874,500 |
| CA: | $715,900 |
Mean prices in 2022: all housing units: over $1,000,000; detached houses: over $1,000,000; townhouses or other attached units: $865,348; in 2-unit structures: $602,949; in 3-to-4-unit structures: $772,223; in 5-or-more-unit structures: $695,046; mobile homes: $193,193; occupied boats, rvs, vans, etc.: $261,954
Median gross rent in 2022: $2,750.
(6.3% for White Non-Hispanic residents, 3.2% for Black residents, 8.2% for Hispanic or Latino residents, 13.3% for American Indian residents, 13.4% for other race residents, 3.2% for two or more races residents)
Detailed information about poverty and poor residents in Brentwood, CA


Compare current foreclosures in Brentwood, CA:
| Photo | Address | Area | Beds / Baths | Price | Details |
|---|---|---|---|---|---|

|
#1
Mendota St
Brentwood, CA 94513
|
2,485 sq. feet
|
3 baths 4 beds |
show details | |

|
#2
Fitzgerald Way
Brentwood, CA 94513
|
4,631 sq. feet
|
3 baths 6 beds |
show details | |

|
#3
Sycamore Ave
Brentwood, CA 94513
|
1,667 sq. feet
|
2 baths 3 beds |
show details | |

|
#4
Emory Oak Ct
Brentwood, CA 94513
|
2,936 sq. feet
|
3 baths 4 beds |
show details | |

|
#5
Moreau Way
Brentwood, CA 94513
|
3,302 sq. feet
|
3 baths 5 beds |
show details | |

|
#6
Fitzgerald Way
Brentwood, CA 94513
|
4,631 sq. feet
|
3 baths 6 beds |
show details | |

|
#7
Maggiore Ct
Brentwood, CA 94513
|
2,748 sq. feet
|
3 baths 4 beds |
show details | |

|
#8
Maggiore Ct
Brentwood, CA 94513
|
2,748 sq. feet
|
3 baths 4 beds |
show details | |

|
#9
Madrone Pl
Brentwood, CA 94513
|
2,811 sq. feet
|
3 baths 5 beds |
show details | |

|
#10
Emerald Bay Dr
Brentwood, CA 94513
|
3,542 sq. feet
|
3 baths 5 beds |
show details |
| Photo | Address | Area | Beds / Baths | Price | Details |
|---|---|---|---|---|---|

|
#11
Apple Hill Dr
Brentwood, CA 94513
|
1,328 sq. feet
|
2 baths 3 beds |
show details | |

|
#12
San Marino Ln
Brentwood, CA 94513
|
2,651 sq. feet
|
2 baths 4 beds |
show details | |

|
#13
Cinnabar Hills Ct
Brentwood, CA 94513
|
3,375 sq. feet
|
3 baths 4 beds |
show details | |

|
#14
Dawnview Dr
Brentwood, CA 94513
|
3,161 sq. feet
|
3 baths 4 beds |
show details | |

|
#15
Knights Bridge Ct
Brentwood, CA 94513
|
2,023 sq. feet
|
3 baths 4 beds |
show details | |

|
#16
Sunflower Ln
Brentwood, CA 94513
|
2,504 sq. feet
|
3 baths 5 beds |
show details | |

|
#17
Alder Creek Way
Brentwood, CA 94513
|
2,138 sq. feet
|
3 baths 3 beds |
show details | |

|
#18
Amberleaf Way
Brentwood, CA 94513
|
1,648 sq. feet
|
2 baths 3 beds |
show details | |

|
#19
Twilight Ct
Brentwood, CA 94513
|
1,943 sq. feet
|
2 baths 4 beds |
show details | |

|
#20
Spruce St
Brentwood, CA 94513
|
2,651 sq. feet
|
2 baths 5 beds |
show details |
| Photo | Address | Area | Beds / Baths | Price | Details |
|---|---|---|---|---|---|

|
#21
Antelope Ter
Brentwood, CA 94513
|
1,534 sq. feet
|
4 baths 4 beds |
show details | |

|
#22
Wright Ct
Brentwood, CA 94513
|
1,420 sq. feet
|
2 baths 3 beds |
show details | |

|
#23
Caribou Ter
Brentwood, CA 94513
|
1,531 sq. feet
|
2 baths 3 beds |
show details | |

|
#24
Crescent Dr
Brentwood, CA 94513
|
2,213 sq. feet
|
3 baths 4 beds |
show details | |

|
#25
Valley Green Dr
Brentwood, CA 94513
|
1,795 sq. feet
|
2 baths 3 beds |
show details | |

|
#26
Cloverleaf Cir
Brentwood, CA 94513
|
1,680 sq. feet
|
2 baths 4 beds |
show details | |

|
#27
Sawyer Way
Brentwood, CA 94513
|
2,133 sq. feet
|
2 baths 3 beds |
show details | |

|
#28
Tricia St
Brentwood, CA 94513
|
1,209 sq. feet
|
1 baths 4 beds |
show details | |

|
#29
Jubilee Dr
Brentwood, CA 94513
|
2,310 sq. feet
|
2 baths 4 beds |
show details | |

|
#30
Europena Dr
Brentwood, CA 94513
|
3,125 sq. feet
|
3 baths 5 beds |
show details |
| Photo | Address | Area | Beds / Baths | Price | Details |
|---|---|---|---|---|---|

|
#31
Elberta Pkwy
Brentwood, CA 94513
|
2,178 sq. feet
|
3 baths 3 beds |
show details | |

|
#32
Margaret Ln
Brentwood, CA 94513
|
2,615 sq. feet
|
2 baths 4 beds |
show details | |

|
#33
Pimento Dr
Brentwood, CA 94513
|
2,689 sq. feet
|
2 baths 4 beds |
show details | |

|
#34
Dawnview Dr
Brentwood, CA 94513
|
2,540 sq. feet
|
3 baths 4 beds |
show details | |

|
#35
Mandarin Ct
Brentwood, CA 94513
|
1,506 sq. feet
|
2 baths 4 beds |
show details | |

|
#36
Finn Way
Brentwood, CA 94513
|
2,456 sq. feet
|
2 baths 4 beds |
show details | |

|
#37
Jasmine Pl
Brentwood, CA 94513
|
2,810 sq. feet
|
3 baths 5 beds |
show details | |

|
#38
Cashew Pl
Brentwood, CA 94513
|
2,660 sq. feet
|
2 baths 4 beds |
show details | |

|
#39
Concord Ave
Brentwood, CA 94513
|
2,021 sq. feet
|
2 baths 3 beds |
show details | |

|
#40
Christenson St
Brentwood, CA 94513
|
- sq. feet
|
- baths - beds |
show details |
| Photo | Address | Area | Beds / Baths | Price | Details |
|---|---|---|---|---|---|

|
#41
Rice St
Brentwood, CA 94513
|
- sq. feet
|
- baths - beds |
show details | |

|
#42
Tulare St
Brentwood, CA 94513
|
- sq. feet
|
- baths - beds |
show details | |

|
#43
Cakebread Pl
Brentwood, CA 94513
|
- sq. feet
|
- baths - beds |
show details | |

|
#44
Acero Ct
Brentwood, CA 94513
|
- sq. feet
|
- baths - beds |
show details | |

|
#45
Arbor Ct
Brentwood, CA 94513
|
- sq. feet
|
- baths - beds |
show details | |

|
#46
Snapdragon Ct
Brentwood, CA 94513
|
- sq. feet
|
- baths - beds |
show details | |

|
#47
Balfour Rd Ste D
Brentwood, CA 94513
|
- sq. feet
|
- baths - beds |
show details | |

|
#48
Volpaia Ct
Brentwood, CA 94513
|
- sq. feet
|
- baths - beds |
show details | |

|
#49
Diamond Springs Ln
Brentwood, CA 94513
|
- sq. feet
|
- baths - beds |
show details | |

|
Check over 1 million property listings on Foreclosure.com!
|
browse all offers | |||


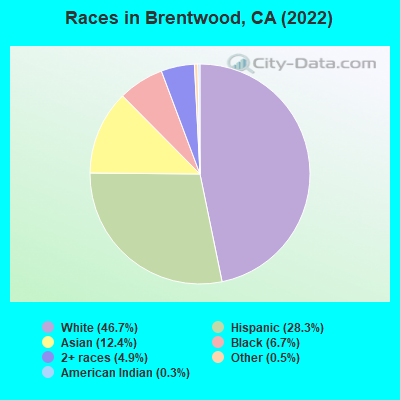
- 30,90046.7%White alone
- 18,71728.3%Hispanic
- 8,21512.4%Asian alone
- 4,4546.7%Black alone
- 3,2364.9%Two or more races
- 3460.5%Other race alone
- 2090.3%American Indian alone
- 430.07%Native Hawaiian and Other
Pacific Islander alone
According to our research of California and other state lists, there were 38 registered sex offenders living in Brentwood, California as of April 19, 2024.
The ratio of all residents to sex offenders in Brentwood is 1,535 to 1.
The ratio of registered sex offenders to all residents in this city is lower than the state average.
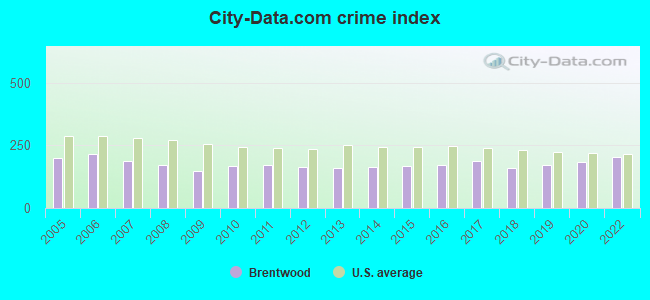
The City-Data.com crime index weighs serious crimes and violent crimes more heavily. Higher means more crime, U.S. average is 246.1. It adjusts for the number of visitors and daily workers commuting into cities.
- means the value is smaller than the state average.- means the value is about the same as the state average.
- means the value is bigger than the state average.
Crime rate in Brentwood detailed stats: murders, rapes, robberies, assaults, burglaries, thefts, arson
Full-time law enforcement employees in 2021, including police officers: 95 (64 officers - 57 male; 7 female).
| Officers per 1,000 residents here: | 0.96 |
| California average: | 2.30 |
 Recent articles from our blog. Our writers, many of them Ph.D. graduates or candidates, create easy-to-read articles on a wide variety of topics.


 | LA's Brentwood School: Ground-Zero for Elite Ethno-Masochism (18 replies) |
| Los Feliz vs Brentwood (18 replies) |
| Tell me about Brentwood, CA (39 replies) |
| Recreation in the Delta Area (Brentwood/Antioch/Oakley) (7 replies) |
| Pleasant Hill or Brentwood (25 replies) |
| moving to LA..... question(s) about Brentwood (11 replies) |
Latest news from Brentwood, CA collected exclusively by city-data.com from local newspapers, TV, and radio stations
Ancestries: European (5.2%), Irish (3.8%), English (3.8%), German (3.4%), American (2.5%), African (1.9%).
Current Local Time: PST time zone
Land area: 11.6 square miles.
Population density: 5,679 people per square mile (average).
10,833 residents are foreign born (8.8% Asia, 5.6% Latin America).
| This city: | 16.9% |
| California: | 26.5% |
Median real estate property taxes paid for housing units with mortgages in 2022: $8,022 (0.9%)
Median real estate property taxes paid for housing units with no mortgage in 2022: $8,204 (1.0%)
Nearest city with pop. 50,000+: East Contra Costa, CA (1.4 miles  , pop. 73,778).
Nearest city with pop. 200,000+: Central Contra Costa, CA (18.4 miles , pop. 459,252).
Nearest city with pop. 1,000,000+: Los Angeles, CA (325.0 miles , pop. 3,694,820).
Nearest cities:
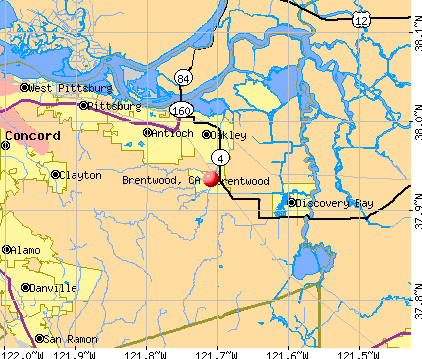
), ), )Latitude: 37.94 N, Longitude: 121.71 W
Daytime population change due to commuting: -10,470 (-15.8%)
Workers who live and work in this city: 13,066 (42.6%)
Area code commonly used in this area: 925

Brentwood, California accommodation & food services, waste management - Economy and Business Data
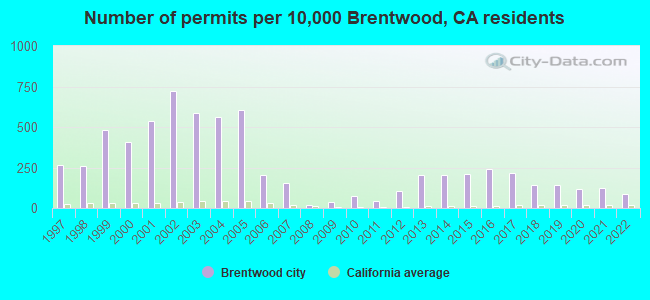
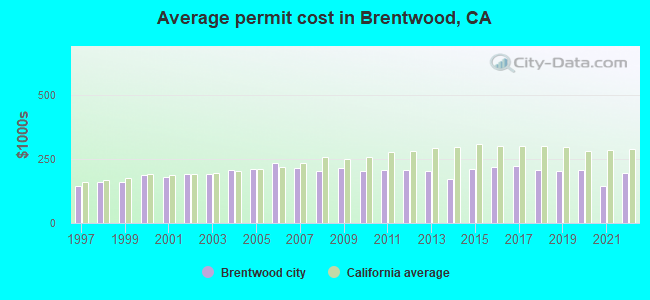
Single-family new house construction building permits:
- 2022: 208 buildings, average cost: $196,000
- 2021: 288 buildings, average cost: $143,100
- 2020: 274 buildings, average cost: $208,700
- 2019: 323 buildings, average cost: $204,300
- 2018: 324 buildings, average cost: $205,800
- 2017: 506 buildings, average cost: $223,000
- 2016: 559 buildings, average cost: $220,900
- 2015: 486 buildings, average cost: $210,000
- 2014: 476 buildings, average cost: $174,400
- 2013: 478 buildings, average cost: $204,900
- 2012: 248 buildings, average cost: $209,200
- 2011: 104 buildings, average cost: $207,900
- 2010: 167 buildings, average cost: $202,100
- 2009: 87 buildings, average cost: $214,900
- 2008: 37 buildings, average cost: $203,000
- 2007: 357 buildings, average cost: $217,000
- 2006: 475 buildings, average cost: $235,900
- 2005: 1413 buildings, average cost: $213,300
- 2004: 1308 buildings, average cost: $207,800
- 2003: 1360 buildings, average cost: $191,500
- 2002: 1682 buildings, average cost: $192,900
- 2001: 1254 buildings, average cost: $180,600
- 2000: 952 buildings, average cost: $186,000
- 1999: 1128 buildings, average cost: $159,100
- 1998: 611 buildings, average cost: $159,300
- 1997: 623 buildings, average cost: $144,700
| Here: | 4.8% |
| California: | 5.1% |
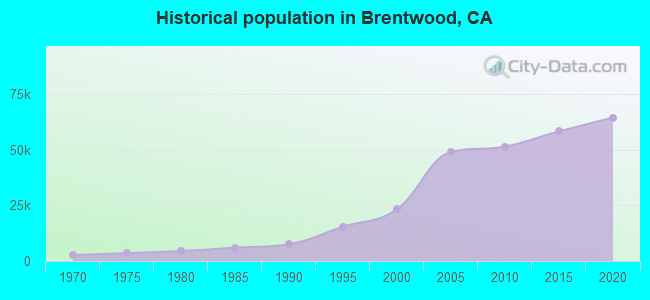
Population change in the 1990s: +14,945 (+178.8%).
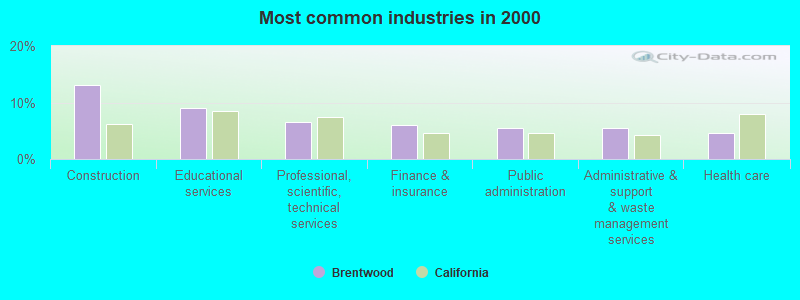
- Construction (13.1%)
- Educational services (9.1%)
- Professional, scientific, technical services (6.6%)
- Finance & insurance (5.9%)
- Public administration (5.6%)
- Administrative & support & waste management services (5.5%)
- Health care (4.6%)
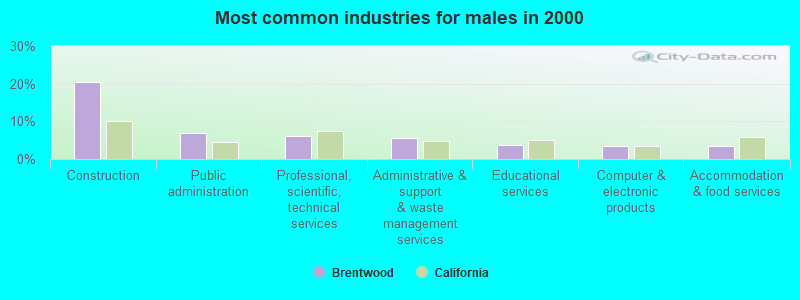
- Construction (20.4%)
- Public administration (7.0%)
- Professional, scientific, technical services (6.1%)
- Administrative & support & waste management services (5.6%)
- Educational services (3.6%)
- Computer & electronic products (3.5%)
- Accommodation & food services (3.4%)
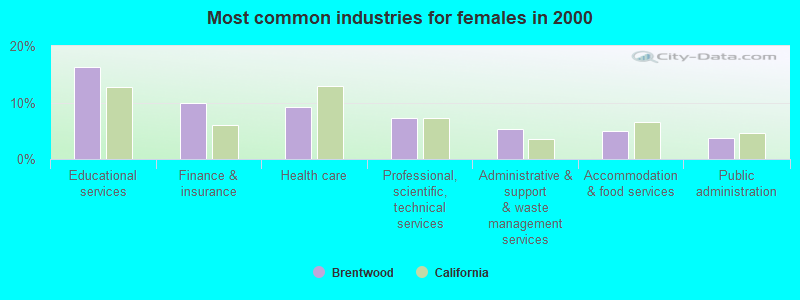
- Educational services (16.3%)
- Finance & insurance (9.9%)
- Health care (9.1%)
- Professional, scientific, technical services (7.2%)
- Administrative & support & waste management services (5.2%)
- Accommodation & food services (4.9%)
- Public administration (3.7%)
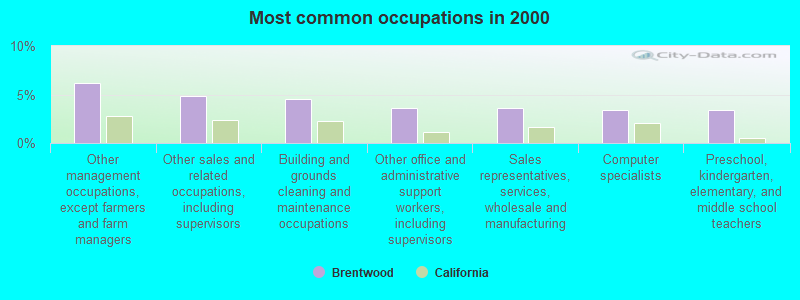
- Other management occupations, except farmers and farm managers (6.2%)
- Other sales and related occupations, including supervisors (4.9%)
- Building and grounds cleaning and maintenance occupations (4.6%)
- Other office and administrative support workers, including supervisors (3.6%)
- Sales representatives, services, wholesale and manufacturing (3.6%)
- Computer specialists (3.4%)
- Preschool, kindergarten, elementary, and middle school teachers (3.4%)
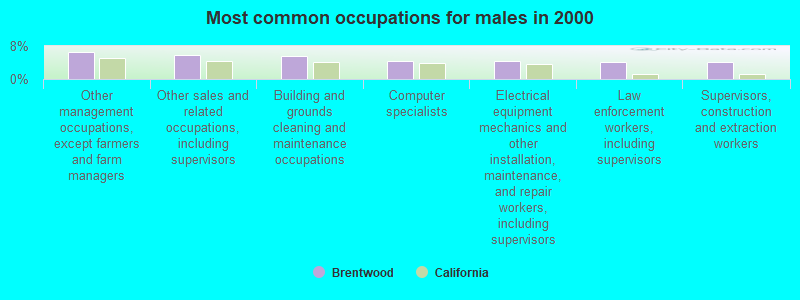
- Other management occupations, except farmers and farm managers (6.5%)
- Other sales and related occupations, including supervisors (5.9%)
- Building and grounds cleaning and maintenance occupations (5.6%)
- Computer specialists (4.4%)
- Electrical equipment mechanics and other installation, maintenance, and repair workers, including supervisors (4.3%)
- Law enforcement workers, including supervisors (4.2%)
- Supervisors, construction and extraction workers (4.1%)

- Other office and administrative support workers, including supervisors (8.1%)
- Preschool, kindergarten, elementary, and middle school teachers (6.6%)
- Other management occupations, except farmers and farm managers (5.8%)
- Secretaries and administrative assistants (5.0%)
- Other teachers, instructors, education, training, and library occupations (4.7%)
- Customer service representatives (3.8%)
- Sales representatives, services, wholesale and manufacturing (3.6%)
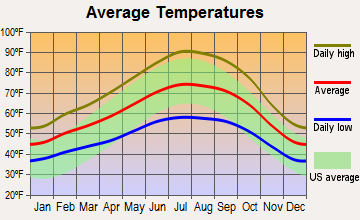
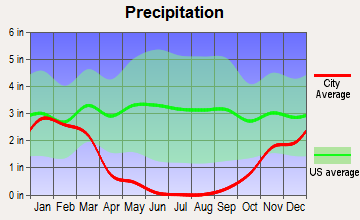
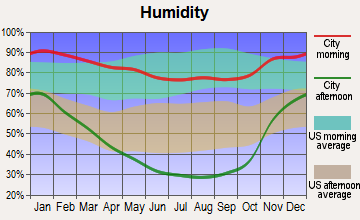
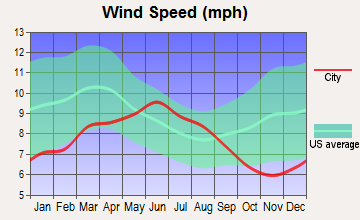
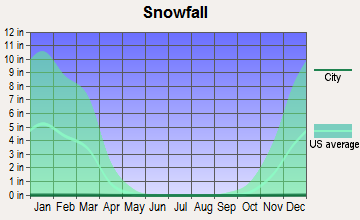
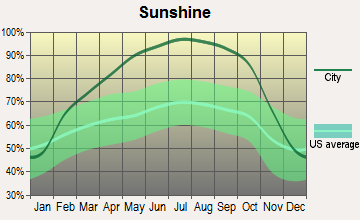
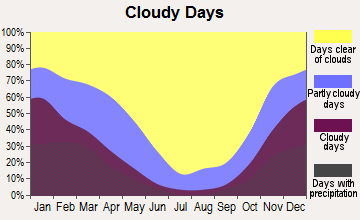
Average climate in Brentwood, California
Based on data reported by over 4,000 weather stations
|
|

(lower is better)
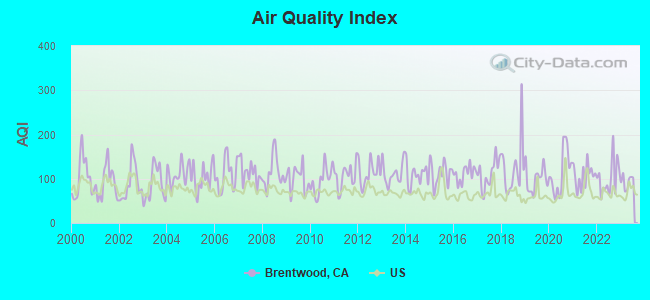
Air Quality Index (AQI) level in 2023 was 93.8. This is worse than average.
| City: | 93.8 |
| U.S.: | 72.6 |
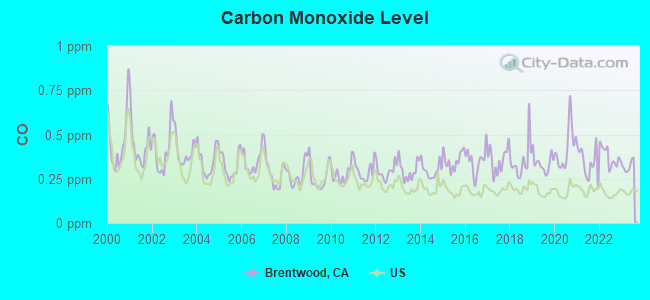
Carbon Monoxide (CO) [ppm] level in 2023 was 0.322. This is worse than average. Closest monitor was 6.1 miles away from the city center.
| City: | 0.322 |
| U.S.: | 0.251 |
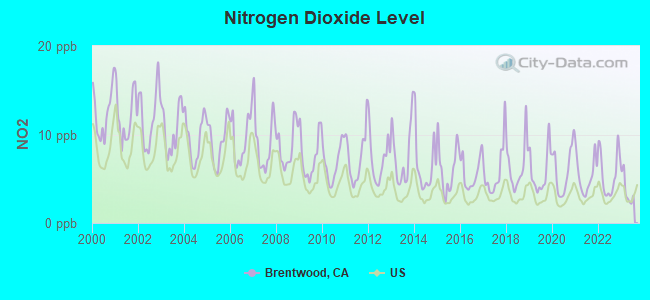
Nitrogen Dioxide (NO2) [ppb] level in 2023 was 3.74. This is better than average. Closest monitor was 6.1 miles away from the city center.
| City: | 3.74 |
| U.S.: | 5.11 |
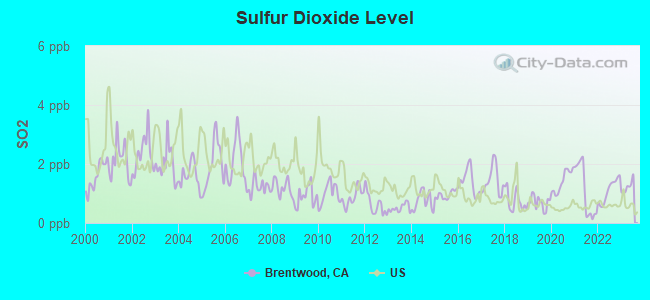
Sulfur Dioxide (SO2) [ppb] level in 2023 was 1.22. This is better than average. Closest monitor was 6.1 miles away from the city center.
| City: | 1.22 |
| U.S.: | 1.51 |
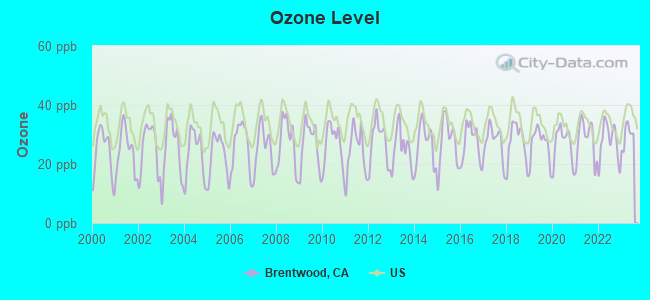
Ozone [ppb] level in 2023 was 29.7. This is about average. Closest monitor was 6.1 miles away from the city center.
| City: | 29.7 |
| U.S.: | 33.3 |
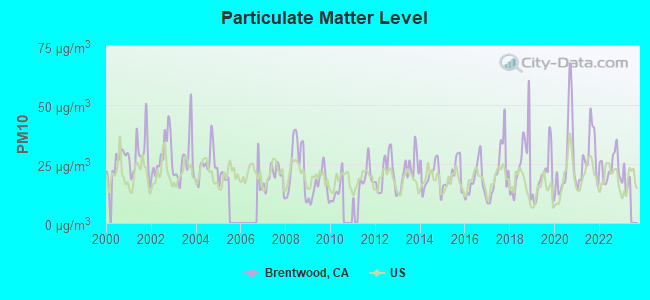
Particulate Matter (PM10) [µg/m3] level in 2022 was 23.5. This is worse than average. Closest monitor was 6.1 miles away from the city center.
| City: | 23.5 |
| U.S.: | 19.2 |
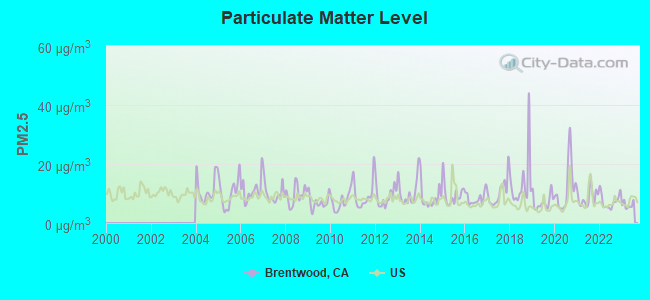
Particulate Matter (PM2.5) [µg/m3] level in 2023 was 6.09. This is better than average. Closest monitor was 17.3 miles away from the city center.
| City: | 6.09 |
| U.S.: | 8.11 |

Lead (Pb) [µg/m3] level in 2023 was 0.00414. This is significantly better than average. Closest monitor was 6.1 miles away from the city center.
| City: | 0.00414 |
| U.S.: | 0.00931 |
Earthquake activity:
Brentwood-area historical earthquake activity is significantly above California state average. It is 7840% greater than the overall U.S. average.On 4/18/1906 at 13:12:21, a magnitude 7.9 (7.9 UK, Class: Major, Intensity: VIII - XII) earthquake occurred 70.5 miles away from Brentwood center, causing $524,000,000 total damage
On 10/18/1989 at 00:04:15, a magnitude 7.1 (6.5 MB, 7.1 MS, 6.9 MW, 7.0 ML) earthquake occurred 57.2 miles away from the city center, causing 62 deaths (62 shaking deaths) and 3757 injuries, causing $1,305,032,704 total damage
On 7/21/1952 at 11:52:14, a magnitude 7.7 (7.7 UK) earthquake occurred 252.8 miles away from the city center, causing $50,000,000 total damage
On 11/4/1927 at 13:51:53, a magnitude 7.5 (7.5 UK) earthquake occurred 212.3 miles away from the city center
On 1/31/1922 at 13:17:28, a magnitude 7.6 (7.6 UK) earthquake occurred 280.8 miles away from the city center
On 10/3/1915 at 06:52:48, a magnitude 7.6 (7.6 UK) earthquake occurred 286.9 miles away from Brentwood center
Magnitude types: body-wave magnitude (MB), local magnitude (ML), surface-wave magnitude (MS), moment magnitude (MW)
Natural disasters:
The number of natural disasters in Contra Costa County (18) is near the US average (15).Major Disasters (Presidential) Declared: 11
Emergencies Declared: 3
Causes of natural disasters: Floods: 13, Storms: 7, Winter Storms: 7, Mudslides: 5, Landslides: 4, Drought: 1, Earthquake: 1, Hurricane: 1, Tornado: 1, Wind: 1, Other: 1 (Note: some incidents may be assigned to more than one category).
Hospitals and medical centers in Brentwood:
Other hospitals and medical centers near Brentwood:
- KC'S SUNSHINE HOMES, ANGELIC II (Hospital, about 3 miles away; OAKLEY, CA)
- KAISER FOUNDATION HOSPITAL - ANTIOCH Acute Care Hospitals (about 4 miles away; ANTIOCH, CA)
- FMC EAST ANTIOCH (Dialysis Facility, about 5 miles away; ANTIOCH, CA)
- LONE TREE CONV HOSP (Nursing Home, about 5 miles away; ANTIOCH, CA)
- SUTTER DELTA MEDICAL CENTER Acute Care Hospitals (about 5 miles away; ANTIOCH, CA)
- AMERICAN STAR HOME II ICF/DD-N (Hospital, about 6 miles away; ANTIOCH, CA)
- PUTNAM ICF (Hospital, about 8 miles away; ANTIOCH, CA)
Airports located in Brentwood:
- Funny Farm Airport (4CA2) (Runways: 1, Itinerant Ops: 100, Local Ops: 500)
Amtrak stations near Brentwood:
- 9 miles: ANTIOCH-PITTSBURG (ANTIOCH, I ST. & SANTA FE TRACKS) . Services: public payphones, full-service food facilities, free short-term parking, free long-term parking, call for taxi service, intercity bus service, public transit connection.
- 17 miles: LIVERMORE (720 LAS FLORES DR.) - Bus Station . Services: fully wheelchair accessible, enclosed waiting area, public restrooms, public payphones, full-service food facilities, free short-term parking, free long-term parking, call for taxi service, intercity bus service, public transit connection.
- 20 miles: EAST DUBLIN-PLEASANTON (PLEASANTON, OWENS DR. AT BART WAY) - Bus Station
Colleges/universities with over 2000 students nearest to Brentwood:
- Los Medanos College (about 10 miles; Pittsburg, CA; Full-time enrollment: 5,289)
- Las Positas College (about 17 miles; Livermore, CA; FT enrollment: 5,112)
- Diablo Valley College (about 20 miles; Pleasant Hill, CA; FT enrollment: 13,015)
- San Joaquin Delta College (about 22 miles; Stockton, CA; FT enrollment: 12,167)
- University of the Pacific (about 23 miles; Stockton, CA; FT enrollment: 4,999)
- Saint Mary's College of California (about 23 miles; Moraga, CA; FT enrollment: 4,200)
- Merritt College (about 27 miles; Oakland, CA; FT enrollment: 2,842)
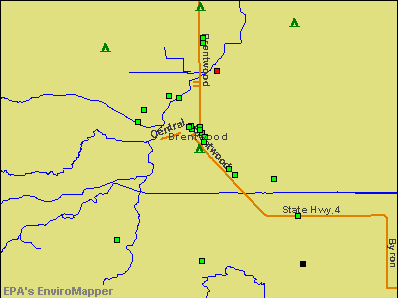
Points of interest:
Notable locations in Brentwood: Lions Community Center (A), Brentwood Branch Contra Costa County Library (B), Brentwood City Hall (C), East Contra Costa Fire Protection District Station 52 (D), East Contra Costa Fire Protection District Station 54 (E). Display/hide their locations on the map
Shopping Center: Brentwood Shopping Center (1). Display/hide its location on the map
Churches in Brentwood include: Soul's Harbor Church (A), Saint Alban's Episcopal Church (B), Neighborhood Church (C), Grace Bible Fellowship Church (D), Church of Christ (E), Brentwood Community Methodist Church (F), Brentwood Baptist Church (G). Display/hide their locations on the map
Creeks: Deer Creek (A), Dry Creek (B). Display/hide their locations on the map
Parks in Brentwood include: Brentwood Park (1), McClarren Park (2), Sunset Park (3). Display/hide their locations on the map
Tourist attraction: Pony Parties And Petting Hill (Petting Zoos; 4225 Briones Valley Road).
Birthplace of: Sarah G. Buxton - Film actor.
Drinking water stations with addresses in Brentwood and their reported violations in the past:
LONE TREE MEDICAL & DENTAL (Population served: 45, Groundwater):Past health violations:Past monitoring violations:
- MCL, Average - In SEP-2008, Contaminant: Nitrate. Follow-up actions: St Compliance achieved (2 times from OCT-21-2008 to OCT-21-2008)
- 2 routine major monitoring violations
- 2 minor monitoring violations
Drinking water stations with addresses in Brentwood that have no violations reported:
- COW CREEK PERMITTEES ASSOCIATION (Population served: 100, Primary Water Source Type: Groundwater)
- LOS VAQUEROS INTERPRETIVE CENTER (Population served: 100, Primary Water Source Type: Surface water)
- LOS VAQUEROS MARINA BLDG (Population served: 50, Primary Water Source Type: Surface water)
- LINDQUIST LANDING MARINA (Population served: 30, Primary Water Source Type: Groundwater)
| This city: | 3.1 people |
| California: | 2.9 people |
| This city: | 80.1% |
| Whole state: | 68.7% |
| This city: | 5.7% |
| Whole state: | 7.2% |
Likely homosexual households (counted as self-reported same-sex unmarried-partner households)
- Lesbian couples: 0.6% of all households
- Gay men: 0.3% of all households
People in group quarters in Brentwood in 2010:
- 53 people in other noninstitutional facilities
- 44 people in group homes intended for adults
- 23 people in workers' group living quarters and job corps centers
- 21 people in emergency and transitional shelters (with sleeping facilities) for people experiencing homelessness
- 5 people in nursing facilities/skilled-nursing facilities
People in group quarters in Brentwood in 2000:
- 17 people in other noninstitutional group quarters
- 7 people in nursing homes
- 7 people in homes for the mentally retarded
- 6 people in religious group quarters
Banks with most branches in Brentwood (2011 data):
- Bank of Agriculture and Commerce: Brentwood Branch at 740 First Street, branch established on 1967/06/30; Country Club Branch at 2251 Balfour Rd, branch established on 2008/07/09. Info updated 2009/08/28: Bank assets: $469.4 mil, Deposits: $403.6 mil, headquarters in Stockton, CA, positive income, Commercial Lending Specialization, 10 total offices, Holding Company: Bac Financial Inc.
- U.S. Bank National Association: Somerset Safeway Branch at 3110 Balfour Road, branch established on 2005/06/13; Brentwood Safeway at 1125 Second Steet, branch established on 2007/10/27. Info updated 2012/01/30: Bank assets: $330,470.8 mil, Deposits: $236,091.5 mil, headquarters in Cincinnati, OH, positive income, 3121 total offices, Holding Company: U.S. Bancorp
- Bank of America, National Association: Brentwood Branch at 241 Oak Street, branch established on 1930/11/03; Slatten Branch at 6261 Lone Tree Way, branch established on 2007/04/30. Info updated 2009/11/18: Bank assets: $1,451,969.3 mil, Deposits: $1,077,176.8 mil, headquarters in Charlotte, NC, positive income, 5782 total offices, Holding Company: Bank Of America Corporation
- Fremont Bank: Brentwood Branch at 200 Sand Creek Road - Suite F, branch established on 2004/02/04. Info updated 2006/11/03: Bank assets: $2,367.9 mil, Deposits: $1,975.1 mil, headquarters in Fremont, CA, positive income, Commercial Lending Specialization, 19 total offices, Holding Company: Fremont Bancorporation
- Bank of the West: Brentwood Branch at 4540 Balfour Road, branch established on 1921/01/01. Info updated 2009/11/16: Bank assets: $62,408.3 mil, Deposits: $43,995.2 mil, headquarters in San Francisco, CA, positive income, 647 total offices, Holding Company: Bnp Paribas
- First Bank: Lone Tree Way Branch at 6590 Lone Tree Way, branch established on 2007/09/24. Info updated 2007/12/04: Bank assets: $6,579.8 mil, Deposits: $5,800.6 mil, headquarters in Creve Coeur, MO, negative income in the last year, Commercial Lending Specialization, 148 total offices, Holding Company: First Banks, Inc.
- Tri Counties Bank: Brentwood Branch at 2400 Sand Creek Road, branch established on 2002/05/01. Info updated 2011/09/26: Bank assets: $2,554.4 mil, Deposits: $2,191.2 mil, headquarters in Chico, CA, positive income, Commercial Lending Specialization, 71 total offices, Holding Company: Trico Bancshares
- Wells Fargo Bank, National Association: Brentwood Branch at 1115 2nd Street, branch established on 2001/11/08. Info updated 2011/04/05: Bank assets: $1,161,490.0 mil, Deposits: $905,653.0 mil, headquarters in Sioux Falls, SD, positive income, 6395 total offices, Holding Company: Wells Fargo & Company
- Citibank, National Association: Lone Tree- Brentwood Branch at 6041 Lone Tree Way, branch established on 2006/10/01. Info updated 2012/01/10: Bank assets: $1,288,658.0 mil, Deposits: $882,541.0 mil, headquarters in Sioux Falls, SD, positive income, International Specialization, 1048 total offices, Holding Company: Citigroup Inc.
For population 15 years and over in Brentwood:
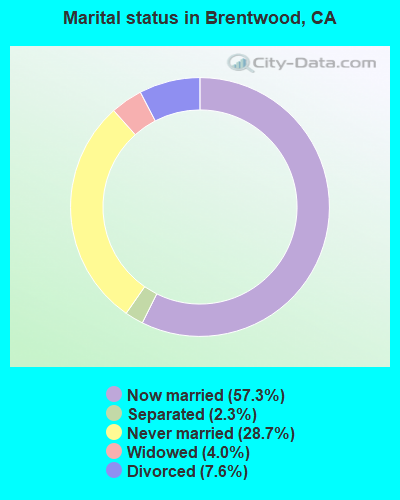
- Never married: 28.7%
- Now married: 57.3%
- Separated: 2.3%
- Widowed: 4.0%
- Divorced: 7.6%
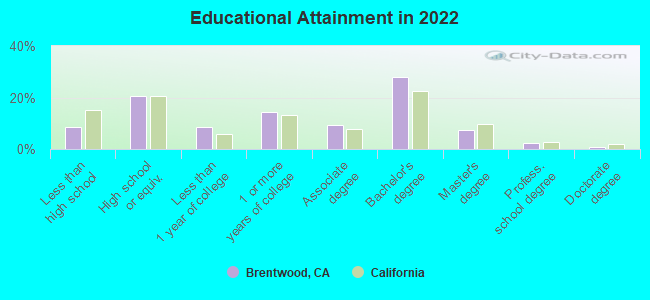
For population 25 years and over in Brentwood:
- High school or higher: 91.6%
- Bachelor's degree or higher: 38.5%
- Graduate or professional degree: 10.7%
- Unemployed: 5.4%
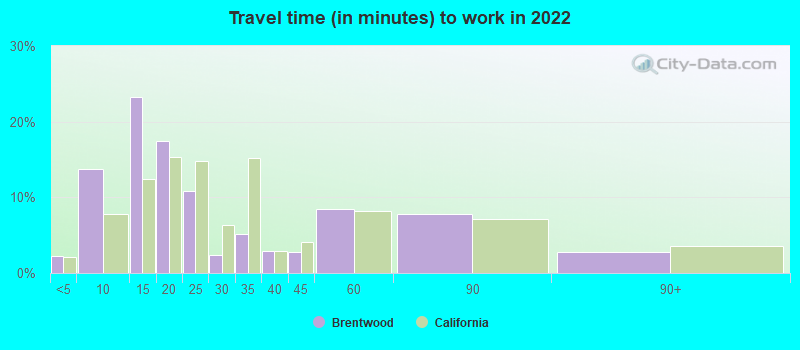
- Mean travel time to work (commute): 28.3 minutes
| Here: | 11.7 |
| California average: | 15.5 |


Graphs represent county-level data. Detailed 2008 Election Results
Religion statistics for Brentwood, CA (based on Contra Costa County data)


| Religion | Adherents | Congregations |
|---|---|---|
| Catholic | 228,400 | 34 |
| Evangelical Protestant | 81,120 | 352 |
| Other | 48,553 | 123 |
| Mainline Protestant | 32,693 | 101 |
| Black Protestant | 10,395 | 34 |
| Orthodox | 2,435 | 8 |
| None | 645,429 | - |
Food Environment Statistics:
| This county: | 1.78 / 10,000 pop. |
| California: | 2.14 / 10,000 pop. |
| This county: | 0.05 / 10,000 pop. |
| State: | 0.04 / 10,000 pop. |
| This county: | 0.51 / 10,000 pop. |
| State: | 0.62 / 10,000 pop. |
| Contra Costa County: | 1.75 / 10,000 pop. |
| California: | 1.49 / 10,000 pop. |
| Here: | 6.73 / 10,000 pop. |
| California: | 7.42 / 10,000 pop. |
| Contra Costa County: | 7.1% |
| California: | 7.3% |
| This county: | 22.2% |
| State: | 21.3% |
| Contra Costa County: | 16.8% |
| State: | 17.9% |
Health and Nutrition:
| Brentwood: | 49.2% |
| State: | 49.4% |
| Here: | 48.3% |
| State: | 48.0% |
| Brentwood: | 28.7 |
| California: | 28.1 |
| Brentwood: | 21.5% |
| State: | 20.2% |
| Here: | 9.9% |
| California: | 11.2% |
| This city: | 6.8 |
| California: | 6.8 |
| This city: | 34.7% |
| California: | 31.5% |
| This city: | 56.7% |
| State: | 56.4% |
| Brentwood: | 80.7% |
| California: | 80.9% |
More about Health and Nutrition of Brentwood, CA Residents
| Local government employment and payroll (March 2022) | |||||
| Function | Full-time employees | Monthly full-time payroll | Average yearly full-time wage | Part-time employees | Monthly part-time payroll |
|---|---|---|---|---|---|
| Police Protection - Officers | 66 | $916,828 | $166,696 | 0 | $0 |
| Financial Administration | 32 | $332,539 | $124,702 | 0 | $0 |
| Police - Other | 28 | $248,173 | $106,360 | 4 | $12,018 |
| Parks and Recreation | 26 | $253,390 | $116,949 | 93 | $65,442 |
| Other Government Administration | 25 | $291,831 | $140,079 | 11 | $6,911 |
| Streets and Highways | 24 | $284,031 | $142,016 | 0 | $0 |
| Solid Waste Management | 22 | $196,438 | $107,148 | 7 | $19,488 |
| Other and Unallocable | 22 | $216,048 | $117,844 | 0 | $0 |
| Water Supply | 17 | $160,747 | $113,468 | 0 | $0 |
| Sewerage | 16 | $168,202 | $126,152 | 1 | $1,847 |
| Housing and Community Development (Local) | 11 | $113,568 | $123,892 | 1 | $2,526 |
| Judicial and Legal | 5 | $74,599 | $179,038 | 0 | $0 |
| Health | 3 | $31,160 | $124,640 | 0 | $0 |
| Totals for Government | 297 | $3,287,554 | $132,830 | 117 | $108,232 |
Brentwood government finances - Expenditure in 2017 (per resident):
- Construction - Housing and Community Development: $4,985,000 ($75.39)
Parks and Recreation: $3,315,000 ($50.13)
Solid Waste Management: $2,509,000 ($37.94)
Water Utilities: $1,414,000 ($21.38)
Regular Highways: $987,000 ($14.93)
Sewerage: $161,000 ($2.43)
- Current Operations - Police Protection: $21,271,000 ($321.67)
Water Utilities: $15,656,000 ($236.76)
Regular Highways: $12,377,000 ($187.17)
Central Staff Services: $12,267,000 ($185.51)
Solid Waste Management: $11,282,000 ($170.61)
Parks and Recreation: $10,756,000 ($162.66)
Sewerage: $8,485,000 ($128.31)
Protective Inspection and Regulation - Other: $3,589,000 ($54.27)
Housing and Community Development: $2,252,000 ($34.06)
Financial Administration: $1,635,000 ($24.73)
General - Other: $197,000 ($2.98)
Libraries: $110,000 ($1.66)
Local Fire Protection: $4,000 ($0.06)
- General - Interest on Debt: $6,474,000 ($97.90)
- Intergovernmental to Local - Other - Police Protection: $712,000 ($10.77)
Other - Health - Other: $324,000 ($4.90)
- Other Capital Outlay - Water Utilities: $5,318,000 ($80.42)
General Public Building: $2,404,000 ($36.35)
- Water Utilities - Interest on Debt: $2,126,000 ($32.15)
Brentwood government finances - Revenue in 2017 (per resident):
- Charges - Other: $39,860,000 ($602.78)
Solid Waste Management: $11,376,000 ($172.03)
Sewerage: $11,261,000 ($170.29)
Regular Highways: $5,917,000 ($89.48)
Parks and Recreation: $1,039,000 ($15.71)
Housing and Community Development: $285,000 ($4.31)
- Federal Intergovernmental - Other: $1,113,000 ($16.83)
- Local Intergovernmental - Other: $1,591,000 ($24.06)
- Miscellaneous - Special Assessments: $11,864,000 ($179.41)
General Revenue - Other: $4,662,000 ($70.50)
Donations From Private Sources: $1,750,000 ($26.46)
Rents: $632,000 ($9.56)
Interest Earnings: $560,000 ($8.47)
Fines and Forfeits: $132,000 ($2.00)
- Revenue - Water Utilities: $17,897,000 ($270.65)
- State Intergovernmental - Other: $1,265,000 ($19.13)
Highways: $1,157,000 ($17.50)
General Local Government Support: $95,000 ($1.44)
- Tax - Property: $19,385,000 ($293.15)
Other: $11,162,000 ($168.80)
General Sales and Gross Receipts: $9,076,000 ($137.25)
Other License: $3,903,000 ($59.02)
Public Utilities Sales: $1,487,000 ($22.49)
Occupation and Business License - Other: $888,000 ($13.43)
Documentary and Stock Transfer: $548,000 ($8.29)
Other Selective Sales: $397,000 ($6.00)
Brentwood government finances - Debt in 2017 (per resident):
- Long Term Debt - Beginning Outstanding - Unspecified Public Purpose: $185,277,000 ($2801.84)
Outstanding Unspecified Public Purpose: $177,308,000 ($2681.33)
Retired Unspecified Public Purpose: $8,303,000 ($125.56)
Issue, Unspecified Public Purpose: $333,000 ($5.04)
Brentwood government finances - Cash and Securities in 2017 (per resident):
- Bond Funds - Cash and Securities: $52,605,000 ($795.51)
- Other Funds - Cash and Securities: $132,648,000 ($2005.96)
- Sinking Funds - Cash and Securities: $16,792,000 ($253.94)
6.37% of this county's 2021 resident taxpayers lived in other counties in 2020 ($134,084 average adjusted gross income)
| Here: | 6.37% |
| California average: | 5.19% |
0.01% of residents moved from foreign countries ($98 average AGI)
Contra Costa County: 0.01% California average: 0.03%
Top counties from which taxpayers relocated into this county between 2020 and 2021:
| from Alameda County, CA | |
| from San Francisco County, CA | |
| from Santa Clara County, CA |
7.09% of this county's 2020 resident taxpayers moved to other counties in 2021 ($123,334 average adjusted gross income)
| Here: | 7.09% |
| California average: | 6.14% |
0.01% of residents moved to foreign countries ($92 average AGI)
Contra Costa County: 0.01% California average: 0.02%
Top counties to which taxpayers relocated from this county between 2020 and 2021:
| to Alameda County, CA | |
| to Solano County, CA | |
| to San Francisco County, CA |
| Businesses in Brentwood, CA | ||||
| Name | Count | Name | Count | |
|---|---|---|---|---|
| AT&T | 3 | Home Depot | 1 | |
| Ace Hardware | 2 | J. Jill | 1 | |
| Aeropostale | 1 | Jack In The Box | 2 | |
| American Eagle Outfitters | 1 | Jamba Juice | 1 | |
| Ann Taylor | 1 | JoS. A. Bank | 1 | |
| Banana Republic | 1 | Jones New York | 3 | |
| Baskin-Robbins | 1 | Justice | 2 | |
| Bath & Body Works | 1 | KFC | 2 | |
| Big O Tires | 1 | Kohl's | 1 | |
| Blockbuster | 1 | Kroger | 1 | |
| Burger King | 1 | Lane Furniture | 1 | |
| CVS | 2 | LensCrafters | 1 | |
| Carl\s Jr. | 1 | Little Caesars Pizza | 2 | |
| Chico's | 1 | McDonald's | 2 | |
| Chuck E. Cheese's | 1 | Nike | 6 | |
| Circle K | 1 | Pac Sun | 1 | |
| Cold Stone Creamery | 1 | Panda Express | 1 | |
| Coldwater Creek | 1 | Penske | 1 | |
| Curves | 1 | Quiznos | 1 | |
| Discount Tire | 1 | Red Robin | 1 | |
| Domino's Pizza | 1 | Sprint Nextel | 1 | |
| Express | 1 | Starbucks | 4 | |
| Famous Footwear | 1 | T.J.Maxx | 1 | |
| FedEx | 6 | Taco Bell | 1 | |
| Firestone Complete Auto Care | 1 | Talbots | 1 | |
| Ford | 1 | Toys"R"Us | 1 | |
| GNC | 1 | Trader Joe's | 1 | |
| GameStop | 1 | U-Haul | 2 | |
| Gymboree | 1 | UPS | 7 | |
| H&R Block | 2 | Verizon Wireless | 1 | |
| Haagen-Dazs | 1 | Victoria's Secret | 1 | |
| Hilton | 1 | Vons | 2 | |
| Holiday Inn | 1 | Walgreens | 3 | |
| Hollister Co. | 1 | Wendy's | 1 | |
Strongest AM radio stations in Brentwood:
- KATD (990 AM; 10 kW; PITTSBURG, CA; Owner: RADIO UNICA OF SACRAMENTO LICENSE CORP.)
- KTRB (860 AM; 50 kW; MODESTO, CA; Owner: PAPPAS RADIO OF CALIFORNIA, A CALIFORNIA LIMITED PARTNERSHIP)
- KTCT (1050 AM; 50 kW; SAN MATEO, CA; Owner: SUSQUEHANNA RADIO CORP.)
- KGO (810 AM; 50 kW; SAN FRANCISCO, CA; Owner: KGO-AM RADIO, INC.)
- KFAX (1100 AM; 50 kW; SAN FRANCISCO, CA; Owner: GOLDEN GATE BROADCASTING CO, INC.)
- KNBR (680 AM; 50 kW; SAN FRANCISCO, CA; Owner: KNBR LICO, INC.)
- KIQI (1010 AM; 35 kW; SAN FRANCISCO, CA; Owner: RADIO UNICA OF SAN FRANCISCO LICENSE CORP.)
- KCBS (740 AM; 50 kW; SAN FRANCISCO, CA; Owner: INFINITY BROADCASTING OPERATIONS, INC.)
- KCBC (770 AM; 50 kW; RIVERBANK, CA; Owner: KIERTRON, INC.)
- KHTK (1140 AM; 50 kW; SACRAMENTO, CA; Owner: INFINITY RADIO SUBSIDIARY OPERATIONS INC.)
- KLOK (1170 AM; 50 kW; SAN JOSE, CA; Owner: ENTRAVISION HOLDINGS, LLC)
- KNEW (910 AM; 20 kW; OAKLAND, CA; Owner: AMFM RADIO LICENSES, L.L.C.)
- KYCY (1550 AM; 50 kW; SAN FRANCISCO, CA; Owner: INFINITY BROADCASTING OPERATIONS, INC.)
Strongest FM radio stations in Brentwood:
- KKSF-FM1 (103.7 FM; PLEASANTON, ETC., CA; Owner: AMFM RADIO LICENSES, L.L.C.)
- KMEL-FM1 (106.1 FM; CONCORD, CA; Owner: AMFM RADIO LICENSES, L.L.C.)
- KBLX-FM2 (102.9 FM; PLEASANTON, CA; Owner: ICBC BROADCAST HOLDINGS -CA, INC.)
- KSOL-FM3 (98.9 FM; PLEASANTON, CA; Owner: TMS LICENSE CALIFORNIA, INC)
- KFRC-FM3 (99.7 FM; WALNUT CREEK, CA; Owner: INFINITY KFRC-FM, INC.)
- KZBR-FM1 (95.7 FM; WALNUT CREEK, CA; Owner: BONNEVILLE HOLDING COMPANY)
- KISQ-FM3 (98.1 FM; CONCORD, CA; Owner: AMFM RADIO LICENSES, L.L.C.)
- K238AC (95.5 FM; SALIDA, CA; Owner: FAMILY STATIONS, INC.)
- KZBR-FM2 (95.7 FM; LIVERMORE, ETC., CA; Owner: BONNEVILLE HOLDING COMPANY)
- KJOY (99.3 FM; STOCKTON, CA; Owner: CITADEL BROADCASTING COMPANY)
- KFJO (92.1 FM; WALNUT CREEK, CA; Owner: CHASE RADIO PROPERTIES, L.L.C.)
- KOSO (93.1 FM; PATTERSON, CA; Owner: CAPSTAR TX LIMITED PARTNERSHIP)
- KDFC-FM1 (102.1 FM; LAFAYETTE, CA; Owner: BONNEVILLE HOLDING COMPANY)
- KOIT-FM2 (96.5 FM; MARTINEZ, ETC., CA; Owner: BONNEVILLE HOLDING CO. C/O KOIT(FM))
- KUIC (95.3 FM; VACAVILLE, CA; Owner: KUIC, INC.)
- KIOI-FM1 (101.3 FM; WALNUT CREEK, CA; Owner: AMFM RADIO LICENSES, L.L.C.)
- KUOP (91.3 FM; STOCKTON, CA; Owner: UNIVERSITY OF THE PACIFIC)
- KBAA (94.5 FM; GILROY, CA; Owner: INFINITY RADIO OPERATIONS INC.)
- KLLC (97.3 FM; SAN FRANCISCO, CA; Owner: INFINITY BROADCASTING OPERATIONS, INC.)
- KSFB-FM (100.7 FM; SAN RAFAEL, CA; Owner: GOLDEN GATE BROADCASTING COMPANY, INC.)
TV broadcast stations around Brentwood:
- KOVR (Channel 13; STOCKTON, CA; Owner: SCI - SACRAMENTO LICENSEE, LLC)
- KXTV (Channel 10; SACRAMENTO, CA; Owner: KXTV, INC.)
- KCRA-TV (Channel 3; SACRAMENTO, CA; Owner: KCRA HEARST-ARGYLE TELEVISION, INC.)
- KUVS (Channel 19; MODESTO, CA; Owner: KUVS LICENSE PARTNERSHIP, G.P.)
- KSPX (Channel 29; SACRAMENTO, CA; Owner: PAXSON SACRAMENTO LICENSE, INC.)
- KTXL (Channel 40; SACRAMENTO, CA; Owner: CHANNEL 40, INC.)
- KQCA (Channel 58; STOCKTON, CA; Owner: KCRA HEARST-ARGYLE TELEVISION, INC.)
- KVIE (Channel 6; SACRAMENTO, CA; Owner: KVIE, INC.)
- KMAX-TV (Channel 31; SACRAMENTO, CA; Owner: UPN STATIONS GROUP INC.)
- KQED (Channel 9; SAN FRANCISCO, CA; Owner: KQED, INC.)
- KTNC-TV (Channel 42; CONCORD, CA; Owner: KTNC LICENSE, LLC)
- KMMK-LP (Channel 14; SACRAMENTO, CA; Owner: CABALLERO TELEVISION TEXAS, L.L.C.)
- KGO-TV (Channel 7; SAN FRANCISCO, CA; Owner: KGO TELEVISION, INC.)
- KPIX-TV (Channel 5; SAN FRANCISCO, CA; Owner: CBS BROADCASTING INC.)
- KEZT-CA (Channel 23; SACRAMENTO, CA; Owner: TELEFUTURA SACRAMENTO LLC)
- KFTL (Channel 64; STOCKTON, CA; Owner: FAMILY STATIONS, INC.)
- KBIT-CA (Channel 28; SAN FRANCISCO, ETC., CA; Owner: POLAR BROADCASTING, INC.)
- KRON-TV (Channel 4; SAN FRANCISCO, CA; Owner: YOUNG BROADCASTING OF SAN FRANCISCO, INC.)
- KICU-TV (Channel 36; SAN JOSE, CA; Owner: KTVU PARTNERSHIP)
- KDTS-CA (Channel 52; STOCKTON, CA; Owner: WORD OF GOD FELLOWSHIP, INC.)
- National Bridge Inventory (NBI) Statistics
- 40Number of bridges
- 371ft / 113mTotal length
- $537,000Total costs
- 479,675Total average daily traffic
- 35,073Total average daily truck traffic
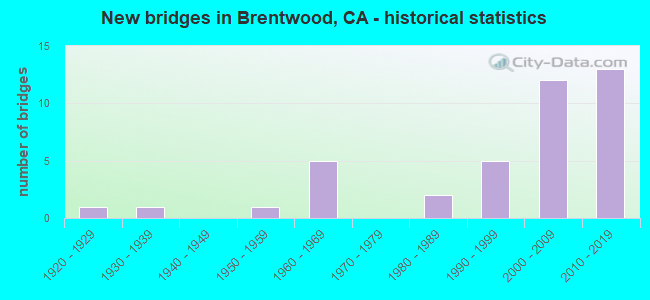
- New bridges - historical statistics
- 11920-1929
- 11930-1939
- 11950-1959
- 51960-1969
- 21980-1989
- 51990-1999
- 122000-2009
- 132010-2019
FCC Registered Broadcast Land Mobile Towers: 32 (See the full list of FCC Registered Broadcast Land Mobile Towers in Brentwood, CA)
FCC Registered Microwave Towers: 22 (See the full list of FCC Registered Microwave Towers in this town)
FCC Registered Paging Towers: 1 (See the full list of FCC Registered Paging Towers)
FCC Registered Amateur Radio Licenses: 307 (See the full list of FCC Registered Amateur Radio Licenses in Brentwood)
FAA Registered Aircraft: 38 (See the full list of FAA Registered Aircraft in Brentwood)
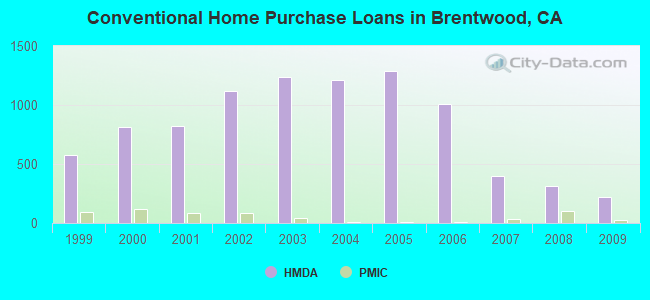
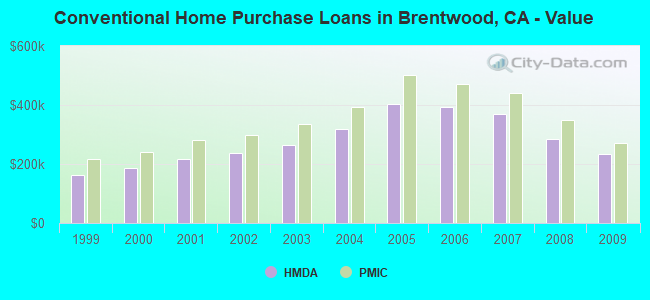
| Home Mortgage Disclosure Act Aggregated Statistics For Year 2009 (Based on 2 partial tracts) | ||||||||||||
| A) FHA, FSA/RHS & VA Home Purchase Loans | B) Conventional Home Purchase Loans | C) Refinancings | D) Home Improvement Loans | F) Non-occupant Loans on < 5 Family Dwellings (A B C & D) | G) Loans On Manufactured Home Dwelling (A B C & D) | |||||||
|---|---|---|---|---|---|---|---|---|---|---|---|---|
| Number | Average Value | Number | Average Value | Number | Average Value | Number | Average Value | Number | Average Value | Number | Average Value | |
| LOANS ORIGINATED | 236 | $280,573 | 224 | $234,690 | 400 | $258,761 | 12 | $124,897 | 86 | $198,612 | 0 | $0 |
| APPLICATIONS APPROVED, NOT ACCEPTED | 20 | $311,812 | 25 | $253,846 | 58 | $283,317 | 1 | $153,820 | 12 | $224,453 | 1 | $39,980 |
| APPLICATIONS DENIED | 41 | $308,055 | 48 | $256,673 | 195 | $322,292 | 5 | $100,682 | 25 | $212,546 | 0 | $0 |
| APPLICATIONS WITHDRAWN | 21 | $315,413 | 35 | $229,065 | 87 | $298,796 | 5 | $114,924 | 14 | $185,457 | 0 | $0 |
| FILES CLOSED FOR INCOMPLETENESS | 7 | $295,771 | 8 | $252,025 | 31 | $309,280 | 2 | $50,745 | 6 | $211,333 | 0 | $0 |
Detailed HMDA statistics for the following Tracts: 3031.00 , 3032.00
| Private Mortgage Insurance Companies Aggregated Statistics For Year 2009 (Based on 2 partial tracts) | ||||
| A) Conventional Home Purchase Loans | B) Refinancings | |||
|---|---|---|---|---|
| Number | Average Value | Number | Average Value | |
| LOANS ORIGINATED | 25 | $271,394 | 7 | $325,016 |
| APPLICATIONS APPROVED, NOT ACCEPTED | 11 | $304,109 | 4 | $303,618 |
| APPLICATIONS DENIED | 2 | $294,695 | 1 | $237,870 |
| APPLICATIONS WITHDRAWN | 2 | $226,240 | 1 | $223,600 |
| FILES CLOSED FOR INCOMPLETENESS | 2 | $291,795 | 0 | $0 |
Detailed PMIC statistics for the following Tracts: 3031.00 , 3032.00
2005 - 2018 National Fire Incident Reporting System (NFIRS) incidents
- Fire incident types reported to NFIRS in Brentwood, CA
- 69943.1%Outside Fires
- 55334.1%Structure Fires
- 21713.4%Mobile Property/Vehicle Fires
- 1539.4%Other
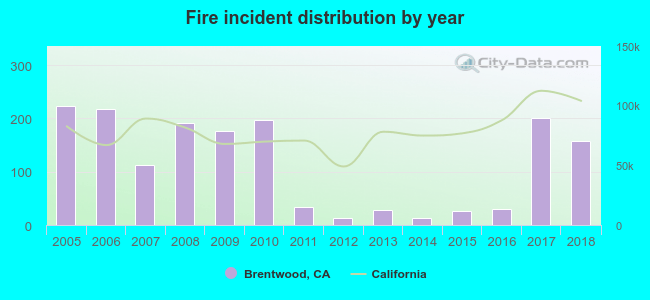 Based on the data from the years 2005 - 2018 the average number of fires per year is 116. The highest number of reported fires - 224 took place in 2005, and the least - 13 in 2014. The data has a dropping trend.
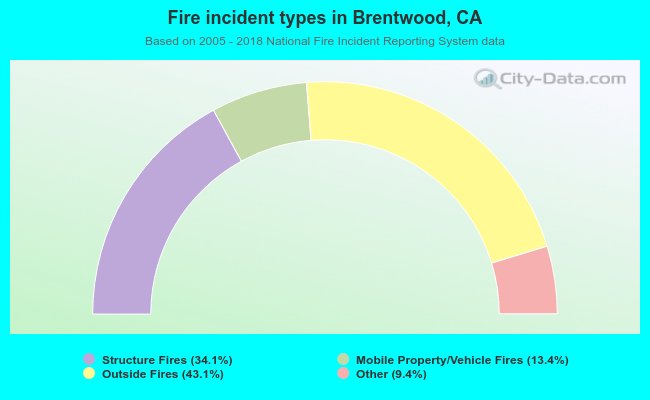 When looking into fire subcategories, the most incidents belonged to: Outside Fires (43.1%), and Structure Fires (34.1%).
Fire-safe hotels and motels in Brentwood, California:
- Holiday Inn Express, 8820 Brentwood Blvd, Brentwood, California 94513 , Phone: (925) 634-6400, Fax: (925) 634-5700
- Hampton Inn, 7605 Brentwood Blvd, Brentwood, California 94513 , Phone: (925) 513-1299, Fax: (925) 513-1280
| Most common first names in Brentwood, CA among deceased individuals | ||
| Name | Count | Lived (average) |
|---|---|---|
| Mary | 73 | 77.3 years |
| William | 73 | 74.3 years |
| Robert | 68 | 71.2 years |
| John | 64 | 76.1 years |
| James | 47 | 72.9 years |
| George | 46 | 77.0 years |
| Charles | 43 | 75.0 years |
| Dorothy | 41 | 81.6 years |
| Frank | 32 | 77.3 years |
| Joseph | 31 | 76.1 years |
| Most common last names in Brentwood, CA among deceased individuals | ||
| Last name | Count | Lived (average) |
|---|---|---|
| Smith | 34 | 80.7 years |
| Garcia | 22 | 72.7 years |
| Davis | 19 | 79.2 years |
| Martin | 16 | 81.1 years |
| Johnson | 15 | 77.0 years |
| Martinez | 15 | 74.5 years |
| Thompson | 14 | 74.4 years |
| Williams | 14 | 74.3 years |
| Miller | 14 | 76.6 years |
| Brown | 14 | 74.1 years |
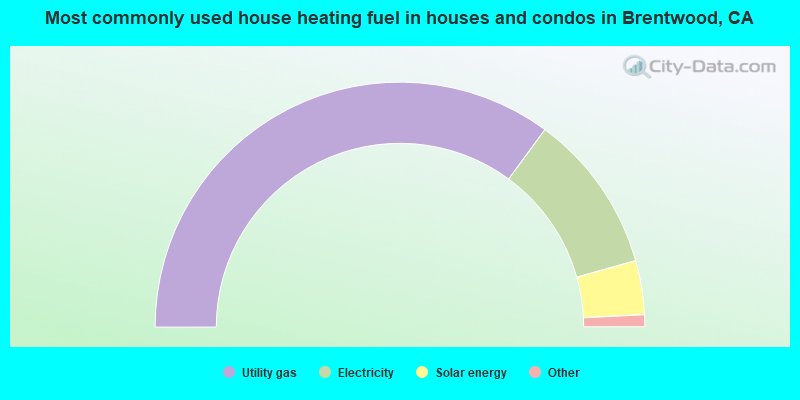
- 70.1%Utility gas
- 21.1%Electricity
- 7.1%Solar energy
- 0.8%No fuel used
- 0.5%Wood
- 0.3%Bottled, tank, or LP gas
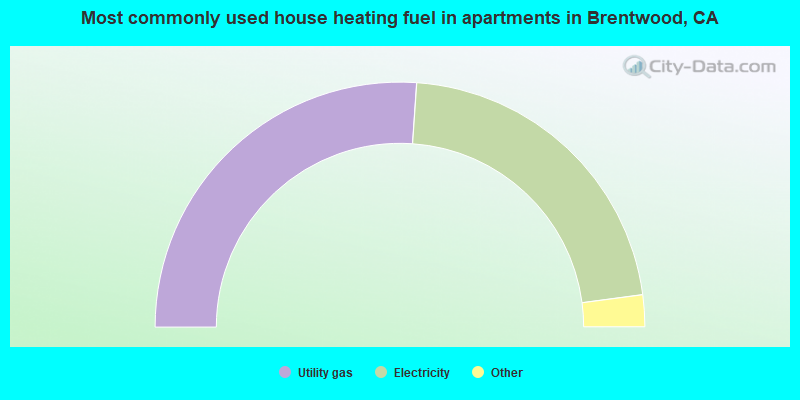
- 52.2%Utility gas
- 43.6%Electricity
- 1.6%Solar energy
- 1.1%No fuel used
- 1.0%Bottled, tank, or LP gas
- 0.4%Other fuel
Brentwood compared to California state average:
- Unemployed percentage significantly below state average.
- Black race population percentage significantly above state average.
- Hispanic race population percentage above state average.
- Foreign-born population percentage above state average.
- Renting percentage below state average.
- Length of stay since moving in significantly below state average.
- Number of rooms per house above state average.
- House age significantly below state average.
- Number of college students above state average.
- Percentage of population with a bachelor's degree or higher above state average.
Brentwood on our top lists:
- #6 on the list of "Top 101 cities with largest percentage of females in industries: real estate and rental and leasing (population 50,000+)"
- #9 on the list of "Top 101 cities with largest percentage of males in occupations: installation, maintenance, and repair occupations (population 50,000+)"
- #10 on the list of "Top 101 cities with largest percentage of females in occupations: law enforcement workers including supervisors (population 50,000+)"
- #11 on the list of "Top 101 cities with largest percentage population increases in the 1990s) (population 50,000+)"
- #11 on the list of "Top 101 cities with largest percentage of males in industries: real estate and rental and leasing (population 50,000+)"
- #12 on the list of "Top 101 cities with largest percentage of males in industries: management of companies and enterprises (population 50,000+)"
- #13 on the list of "Top 101 cities with largest percentage of females in industries: management of companies and enterprises (population 50,000+)"
- #14 on the list of "Top 100 low-educated but high-earning cities (pop. 50,000+)"
- #14 on the list of "Top 100 cities with longest commuting times (pop. 50,000+)"
- #14 on the list of "Top 101 cities with the largest percentage population increase from 2000 (population 50,000+)"
- #16 on the list of "Top 101 cities with largest percentage of workers with very short commute times (9 minutes or less) (population 50,000+)"
- #17 on the list of "Top 101 cities with largest percentage of males in industries: construction (population 50,000+)"
- #24 on the list of "Top 100 fastest growing cities from 2000 to 2014 (pop. 50,000+)"
- #25 on the list of "Top 100 cities with newest houses (pop. 50,000+)"
- #27 on the list of "Top 101 cities with the highest maximum monthly sunshine amount (population 50,000+)"
- #31 on the list of "Top 101 cities with most building permits per 10,000 residents (population 50,000+)"
- #38 on the list of "Top 100 cities with biggest houses (pop. 50,000+)"
- #40 on the list of "Top 101 cities with largest percentage of females in occupations: pipelayers, plumbers, pipefitters, and steamfitters (population 50,000+)"
- #41 on the list of "Top 101 cities with largest percentage of males in industries: farm product raw materials merchant wholesalers (population 50,000+)"
- #41 on the list of "Top 101 cities with largest percentage of females in industries: farm product raw materials merchant wholesalers (population 50,000+)"
- #10 on the list of "Top 101 counties with the largest increase in the number of infant deaths per 1000 residents 2000-2006 to 2007-2013 (pop. 50,000+)"
- #15 on the list of "Top 101 counties with the lowest Sulfur Oxides Annual air pollution readings in 2012 (µg/m3)"
- #17 on the list of "Top 101 counties with the highest Nitrogen Dioxide air pollution readings in 2012 (ppm)"
- #31 on the list of "Top 101 counties with the highest percentage of residents that drank alcohol in the past 30 days"
- #34 on the list of "Top 101 counties with the highest surface withdrawal of fresh water for public supply (pop. 50,000+)"

|
|
Total of 395 patent applications in 2008-2024.