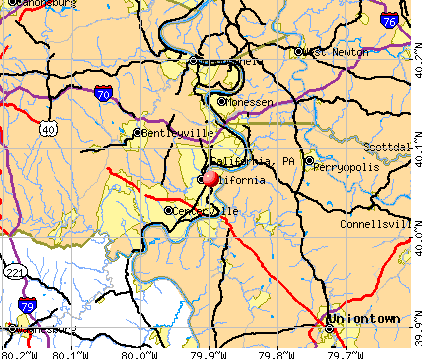
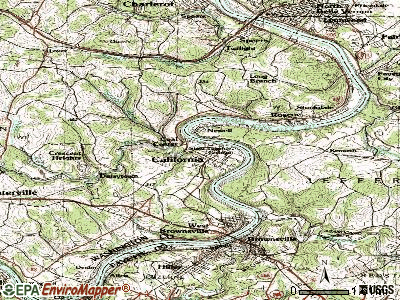
California, Pennsylvania
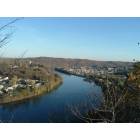
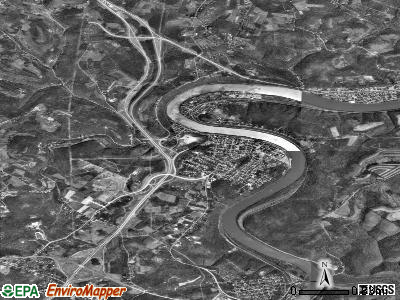
California: California from High Point
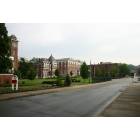
California: One of the buildings at Cal-U
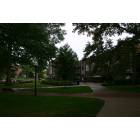
California: Courtyard at Cal-U
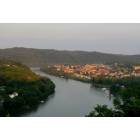
California: A scenic view
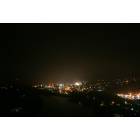
California: Looking back at Cal-U from the Highpoint
California: Coal train running through Cal-U
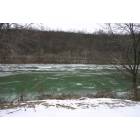
California: The "mon" River frozen over
- add
your


Submit your own pictures of this borough and show them to the world
- OSM Map
- General Map
- Google Map
- MSN Map
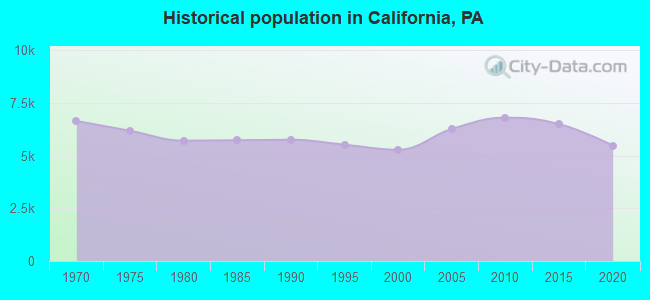
Population change since 2000: -3.8%
| Males: 2,376 | |
| Females: 2,698 |
| Median resident age: | 22.0 years |
| Pennsylvania median age: | 40.9 years |
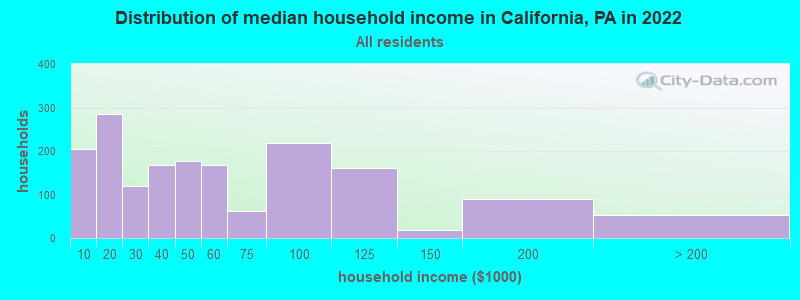
| California: | $43,910 |
| PA: | $71,798 |
Estimated per capita income in 2022: $21,406 (it was $14,412 in 2000)
California borough income, earnings, and wages data
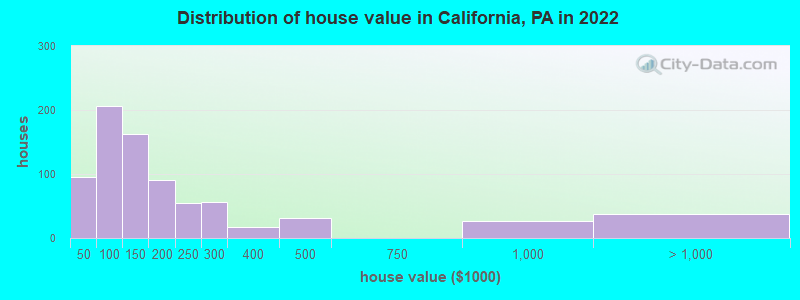
Estimated median house or condo value in 2022: $125,678 (it was $69,900 in 2000)
| California: | $125,678 |
| PA: | $245,500 |
Mean prices in 2022: all housing units: $260,709; detached houses: $274,064; townhouses or other attached units: $231,672; in 2-unit structures: $130,309; in 5-or-more-unit structures: $156,032; mobile homes: $67,133
Median gross rent in 2022: $719.
(26.1% for White Non-Hispanic residents, 27.9% for Black residents, 32.4% for Hispanic or Latino residents, 72.0% for other race residents, 29.6% for two or more races residents)
Detailed information about poverty and poor residents in California, PA
Compare current foreclosures near California, PA:
| Photo | Address | Area | Beds / Baths | Price | Details |
|---|---|---|---|---|---|

|
#1
Hillcrest Dr
California, PA 15419
|
1,677 sq. feet
|
1 baths 3 beds |
show details | |

|
#2
Green St
California, PA 15419
|
- sq. feet
|
- baths - beds |
show details | |

|
#3
Russian St Apt 6
California, PA 15419
|
- sq. feet
|
- baths - beds |
show details | |

|
#4
S Pittsburgh St
Connellsville, PA 15425
|
4,572 sq. feet
|
3 baths 5 beds |
$59,900
|
show details |

|
#5
Blind Ln
Belle Vernon, PA 15012
|
1,548 sq. feet
|
2 baths 3 beds |
$67,500
|
show details |

|
#6
Pittsburgh St
West Newton, PA 15089
|
1,193 sq. feet
|
1 baths 3 beds |
$193,500
|
show details |

|
#7
S 4th St
West Newton, PA 15089
|
1,850 sq. feet
|
1 baths 4 beds |
$207,900
|
show details |

|
#8
Casey Drive
New Salem, PA 15468
|
- sq. feet
|
1 baths 1 beds |
$244,900
|
show details |

|
#9
9th Ave
Elizabeth, PA 15037
|
1,554 sq. feet
|
1 baths 3 beds |
$180,000
|
show details |

|
#10
Coal St
Dunlevy, PA 15432
|
1,740 sq. feet
|
1 baths 3 beds |
$125,500
|
show details |
| Photo | Address | Area | Beds / Baths | Price | Details |
|---|---|---|---|---|---|

|
#11
Stevenson St
Ronco, PA 15476
|
- sq. feet
|
2 baths 4 beds |
$16,500
|
show details |

|
#12
Race St
Connellsville, PA 15425
|
2,808 sq. feet
|
3 baths 5 beds |
show details | |

|
#13
3rd Street
Isabella, PA 15447
|
854 sq. feet
|
1 baths 2 beds |
show details | |

|
#14
Columbus Dr
Monessen, PA 15062
|
925 sq. feet
|
1 baths 3 beds |
show details | |

|
#15
Barneys Run Rd
Fredericktown, PA 15333
|
- sq. feet
|
1 baths 3 beds |
show details | |

|
#16
Collins Ave
Clairton, PA 15025
|
1,170 sq. feet
|
1 baths 2 beds |
show details | |

|
#17
Oak Ave
Elizabeth, PA 15037
|
936 sq. feet
|
1 baths 3 beds |
show details | |

|
#18
N Eighty Eight Rd
Clarksville, PA 15322
|
1,691 sq. feet
|
1 baths 4 beds |
show details | |

|
#19
Main Street
Jacobs Creek, PA 15448
|
1,694 sq. feet
|
1 baths 3 beds |
show details | |

|
#20
Brothers Rd
Charleroi, PA 15022
|
- sq. feet
|
- baths - beds |
$29,900
|
show details |
| Photo | Address | Area | Beds / Baths | Price | Details |
|---|---|---|---|---|---|

|
#21
Blair St
Connellsville, PA 15425
|
1,040 sq. feet
|
1 baths 3 beds |
show details | |

|
#22
Walnut Hill Rd
Uniontown, PA 15401
|
1,014 sq. feet
|
1 baths 2 beds |
show details | |

|
#23
Scenery Dr
Elizabeth, PA 15037
|
1,113 sq. feet
|
1 baths 3 beds |
show details | |

|
#24
Collins Ave
Uniontown, PA 15401
|
1,449 sq. feet
|
1 baths 4 beds |
show details | |

|
#25
Watkins Ave
Donora, PA 15033
|
1,680 sq. feet
|
1 baths 3 beds |
show details | |

|
#26
Elizabeth Ave
Elizabeth, PA 15037
|
1,333 sq. feet
|
1 baths 3 beds |
show details | |

|
#27
Grant Ave
Monessen, PA 15062
|
1,159 sq. feet
|
1 baths 2 beds |
show details | |

|
#28
Newton Ave
Fredericktown, PA 15333
|
1,739 sq. feet
|
2 baths 3 beds |
show details | |

|
#29
Ellsworth Ave
Elizabeth, PA 15037
|
1,720 sq. feet
|
1 baths 3 beds |
show details | |

|
#30
Bethlehem Street
Fredericktown, PA 15333
|
- sq. feet
|
2 baths 3 beds |
show details |
| Photo | Address | Area | Beds / Baths | Price | Details |
|---|---|---|---|---|---|

|
#31
Circle Dr
Elizabeth, PA 15037
|
1,389 sq. feet
|
1 baths 3 beds |
show details | |

|
#32
Circle St
Brownsville, PA 15417
|
1,450 sq. feet
|
2 baths 3 beds |
show details | |

|
#33
Kennedy Street
Republic, PA 15475
|
2,072 sq. feet
|
1 baths 2 beds |
show details | |

|
#34
Wall St
Republic, PA 15475
|
868 sq. feet
|
1 baths 2 beds |
show details | |

|
#35
Scenery Dr
Elizabeth, PA 15037
|
1,072 sq. feet
|
1 baths 3 beds |
show details | |

|
#36
Cochran St
Dawson, PA 15428
|
1,836 sq. feet
|
1 baths 3 beds |
show details | |

|
#37
1st St
Uniontown, PA 15401
|
1,850 sq. feet
|
2 baths 4 beds |
show details | |

|
#38
Main St
Uniontown, PA 15401
|
1,137 sq. feet
|
1 baths 3 beds |
show details | |

|
#39
State St
Charleroi, PA 15022
|
1,976 sq. feet
|
2 baths 3 beds |
show details | |

|
#40
Fayette City Rd
Fayette City, PA 15438
|
1,164 sq. feet
|
1 baths 3 beds |
show details |
| Photo | Address | Area | Beds / Baths | Price | Details |
|---|---|---|---|---|---|

|
#41
Grant St
New Salem, PA 15468
|
1,488 sq. feet
|
1 baths 3 beds |
show details | |

|
#42
Grant Ave
New Salem, PA 15468
|
1,178 sq. feet
|
1 baths 2 beds |
show details | |

|
#43
Painter St
Everson, PA 15631
|
2,162 sq. feet
|
2 baths 3 beds |
show details | |

|
#44
Old Mcclellandtown Rd
Mc Clellandtown, PA 15458
|
- sq. feet
|
1 baths 3 beds |
show details | |

|
#45
Manown Rd
Monongahela, PA 15063
|
936 sq. feet
|
1 baths 3 beds |
show details | |

|
#46
E Main St
New Salem, PA 15468
|
1,628 sq. feet
|
1 baths 2 beds |
show details | |

|
#47
Corwin St
Roscoe, PA 15477
|
- sq. feet
|
- baths - beds |
$34,900
|
show details |

|
#48
4th St
Monongahela, PA 15063
|
1,120 sq. feet
|
1 baths 3 beds |
show details | |

|
#49
Scenery Dr
Elizabeth, PA 15037
|
1,329 sq. feet
|
1 baths 2 beds |
show details | |

|
Check over 1 million property listings on Foreclosure.com!
|
browse all offers | |||


- 3,96974.6%White alone
- 66112.4%Black alone
- 5269.9%Two or more races
- 1352.5%Hispanic
- 380.7%Asian alone
- 330.6%Other race alone
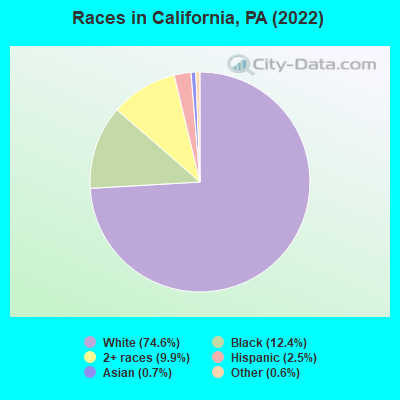
Races in California detailed stats: ancestries, foreign born residents, place of birth
According to our research of Pennsylvania and other state lists, there were 2 registered sex offenders living in California, Pennsylvania as of April 24, 2024.
The ratio of all residents to sex offenders in California is 3,282 to 1.
The ratio of registered sex offenders to all residents in this city is much lower than the state average.
Type |
2009 |
2010 |
2011 |
2012 |
2013 |
2014 |
2015 |
2016 |
2017 |
2018 |
2019 |
2020 |
2022 |
|---|---|---|---|---|---|---|---|---|---|---|---|---|---|
| Murders (per 100,000) | 0 (0.0) | 0 (0.0) | 0 (0.0) | 0 (0.0) | 0 (0.0) | 1 (14.3) | 0 (0.0) | 0 (0.0) | 0 (0.0) | 0 (0.0) | 0 (0.0) | 0 (0.0) | 0 (0.0) |
| Rapes (per 100,000) | 2 (31.3) | 0 (0.0) | 1 (14.7) | 3 (44.0) | 3 (41.3) | 0 (0.0) | 3 (42.3) | 2 (28.6) | 4 (58.5) | 5 (74.2) | 0 (0.0) | 0 (0.0) | 0 (0.0) |
| Robberies (per 100,000) | 2 (31.3) | 3 (44.2) | 1 (14.7) | 1 (14.7) | 7 (96.3) | 2 (28.7) | 0 (0.0) | 1 (14.3) | 0 (0.0) | 1 (14.8) | 0 (0.0) | 0 (0.0) | 1 (17.1) |
| Assaults (per 100,000) | 10 (156.6) | 9 (132.5) | 18 (264.0) | 17 (249.4) | 11 (151.4) | 29 (415.7) | 12 (169.3) | 8 (114.2) | 22 (321.6) | 12 (178.1) | 13 (194.0) | 5 (75.2) | 11 (188.0) |
| Burglaries (per 100,000) | 27 (422.9) | 11 (161.9) | 23 (337.4) | 27 (396.1) | 18 (247.7) | 16 (229.4) | 10 (141.1) | 6 (85.7) | 3 (43.9) | 10 (148.4) | 3 (44.8) | 3 (45.1) | 6 (102.5) |
| Thefts (per 100,000) | 79 (1,237) | 61 (897.7) | 94 (1,379) | 84 (1,232) | 87 (1,197) | 81 (1,161) | 105 (1,482) | 80 (1,142) | 86 (1,257) | 61 (905.3) | 32 (477.5) | 32 (481.0) | 32 (546.8) |
| Auto thefts (per 100,000) | 0 (0.0) | 1 (14.7) | 0 (0.0) | 1 (14.7) | 2 (27.5) | 1 (14.3) | 2 (28.2) | 1 (14.3) | 2 (29.2) | 1 (14.8) | 2 (29.8) | 1 (15.0) | 4 (68.4) |
| Arson (per 100,000) | 0 (0.0) | 0 (0.0) | 0 (0.0) | 0 (0.0) | 2 (27.5) | 0 (0.0) | 0 (0.0) | 1 (14.3) | 0 (0.0) | 0 (0.0) | 0 (0.0) | 0 (0.0) | 0 (0.0) |
| City-Data.com crime index | 144.9 | 88.2 | 147.7 | 167.7 | 159.6 | 184.1 | 139.1 | 102.8 | 166.8 | 147.2 | 63.4 | 38.6 | 77.2 |
The City-Data.com crime index weighs serious crimes and violent crimes more heavily. Higher means more crime, U.S. average is 246.1. It adjusts for the number of visitors and daily workers commuting into cities.
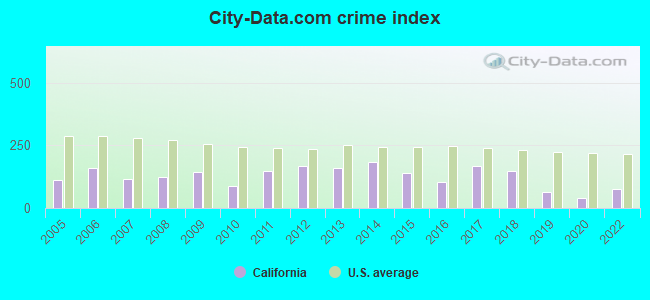
Crime rate in California detailed stats: murders, rapes, robberies, assaults, burglaries, thefts, arson
Full-time law enforcement employees in 2021, including police officers: 8 (7 officers - 6 male; 1 female).
| Officers per 1,000 residents here: | 1.05 |
| Pennsylvania average: | 2.55 |
 Recent articles from our blog. Our writers, many of them Ph.D. graduates or candidates, create easy-to-read articles on a wide variety of topics.


 | Californians planning to relocate to Philadelphia - are our expectations realistic?! (52 replies) |
| California-Kirkbride area - Confused by this listing (10 replies) |
| Four months and 10 days in… (17 replies) |
| Is PA depressing? (665 replies) |
| Looking to move from the Bay Area to southeastern PA in 1.5 years (18 replies) |
| California to Pennsylvania? (21 replies) |
Latest news from California, PA collected exclusively by city-data.com from local newspapers, TV, and radio stations
Ancestries: American (18.4%), Polish (10.3%), German (9.5%), Italian (8.2%), Irish (6.0%), Ukrainian (2.6%).
Current Local Time: EST time zone
Incorporated on 11/26/1853
Elevation: 1000 feet
Land area: 11.0 square miles.
Population density: 460 people per square mile (low).
170 residents are foreign born (1.0% Africa, 0.8% Latin America, 0.7% Asia, 0.6% Europe).
| This borough: | 3.2% |
| Pennsylvania: | 7.3% |
Median real estate property taxes paid for housing units with mortgages in 2022: $2,184 (1.7%)
Median real estate property taxes paid for housing units with no mortgage in 2022: $805 (0.8%)
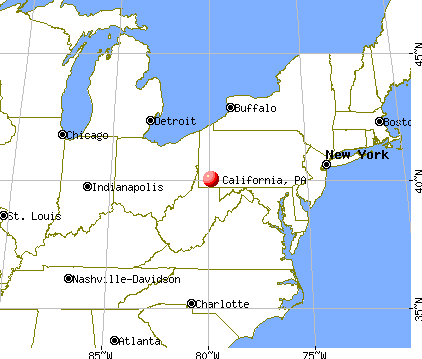
Nearest city with pop. 50,000+: Pittsburgh, PA  (26.4 miles , pop. 334,563).
Nearest city with pop. 1,000,000+: Philadelphia, PA (251.7 miles , pop. 1,517,550).
Nearest cities:
), ), Latitude: 40.07 N, Longitude: 79.90 W
Area code: 724
Property values in California, PA
California, Pennsylvania accommodation & food services, waste management - Economy and Business Data
| Here: | 2.9% |
| Pennsylvania: | 2.9% |
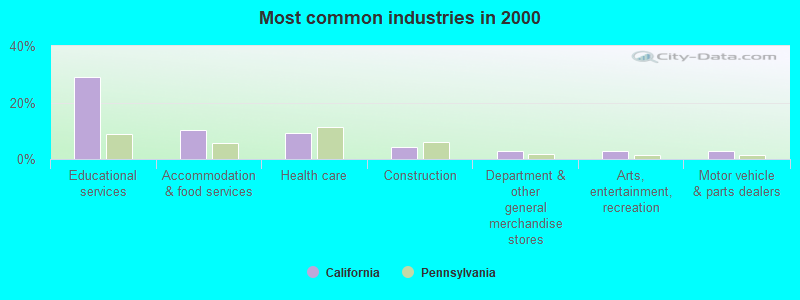
- Educational services (29.0%)
- Accommodation & food services (10.1%)
- Health care (9.2%)
- Construction (4.3%)
- Department & other general merchandise stores (2.9%)
- Arts, entertainment, recreation (2.8%)
- Motor vehicle & parts dealers (2.8%)
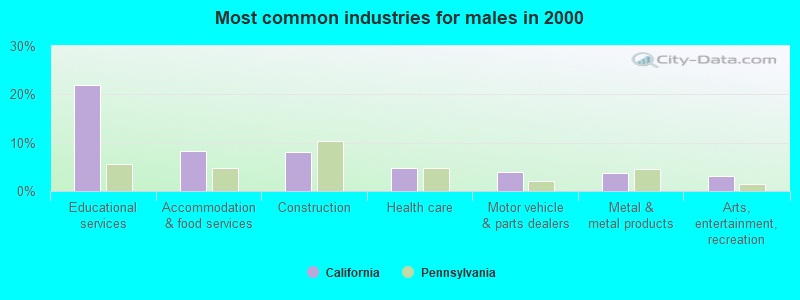
- Educational services (22.0%)
- Accommodation & food services (8.3%)
- Construction (8.0%)
- Health care (4.7%)
- Motor vehicle & parts dealers (3.9%)
- Metal & metal products (3.8%)
- Arts, entertainment, recreation (3.2%)
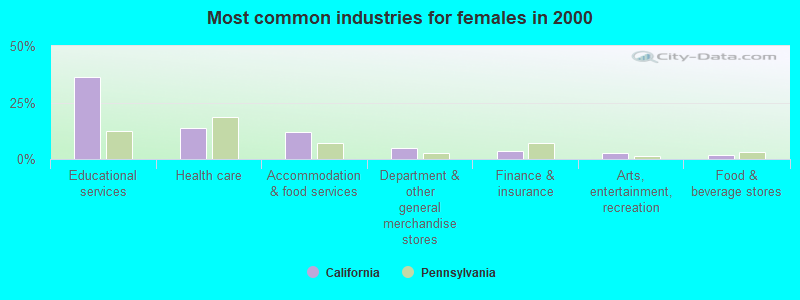
- Educational services (36.2%)
- Health care (13.7%)
- Accommodation & food services (12.0%)
- Department & other general merchandise stores (5.0%)
- Finance & insurance (3.5%)
- Arts, entertainment, recreation (2.5%)
- Food & beverage stores (1.9%)
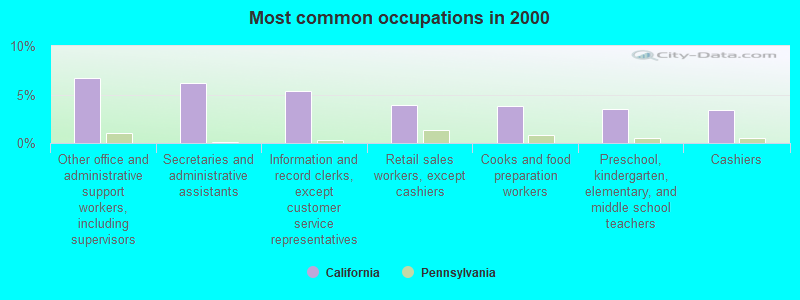
- Other office and administrative support workers, including supervisors (6.8%)
- Secretaries and administrative assistants (6.2%)
- Information and record clerks, except customer service representatives (5.3%)
- Retail sales workers, except cashiers (3.9%)
- Cooks and food preparation workers (3.8%)
- Preschool, kindergarten, elementary, and middle school teachers (3.5%)
- Cashiers (3.4%)
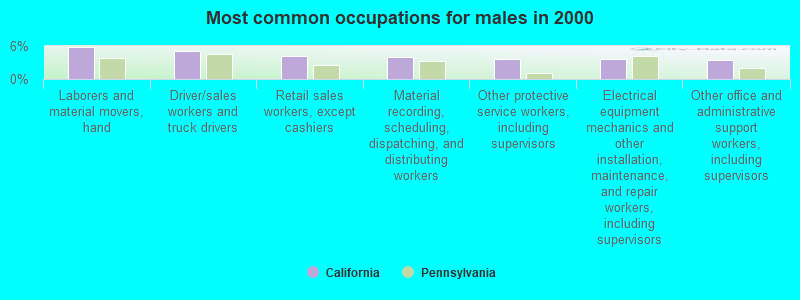
- Laborers and material movers, hand (5.8%)
- Driver/sales workers and truck drivers (5.0%)
- Retail sales workers, except cashiers (4.2%)
- Material recording, scheduling, dispatching, and distributing workers (3.9%)
- Other protective service workers, including supervisors (3.5%)
- Electrical equipment mechanics and other installation, maintenance, and repair workers, including supervisors (3.5%)
- Other office and administrative support workers, including supervisors (3.4%)
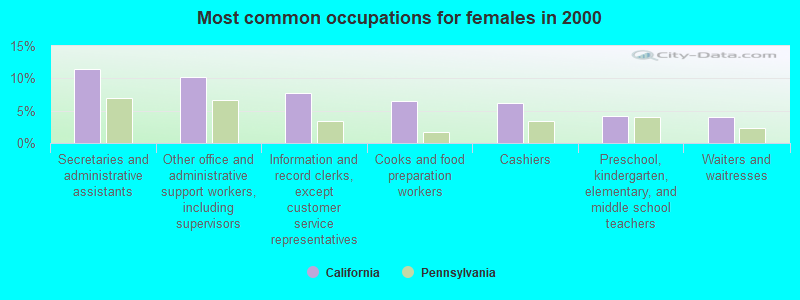
- Secretaries and administrative assistants (11.4%)
- Other office and administrative support workers, including supervisors (10.2%)
- Information and record clerks, except customer service representatives (7.8%)
- Cooks and food preparation workers (6.5%)
- Cashiers (6.1%)
- Preschool, kindergarten, elementary, and middle school teachers (4.2%)
- Waiters and waitresses (4.0%)
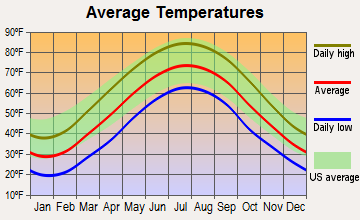
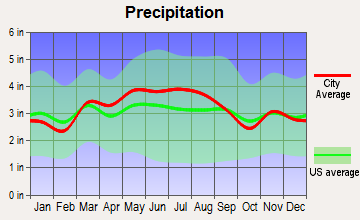
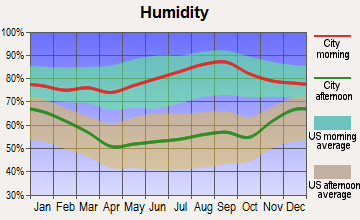
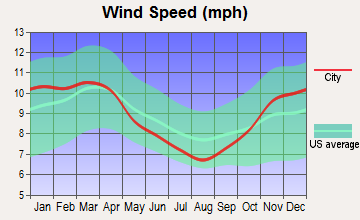
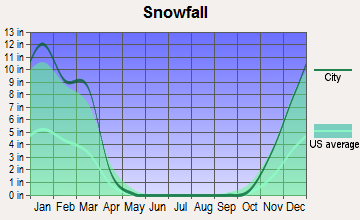
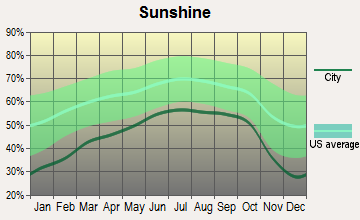
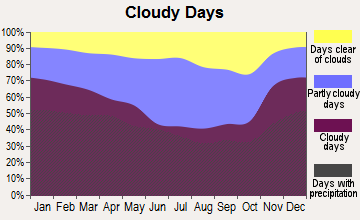
Average climate in California, Pennsylvania
Based on data reported by over 4,000 weather stations
|
|


(lower is better)
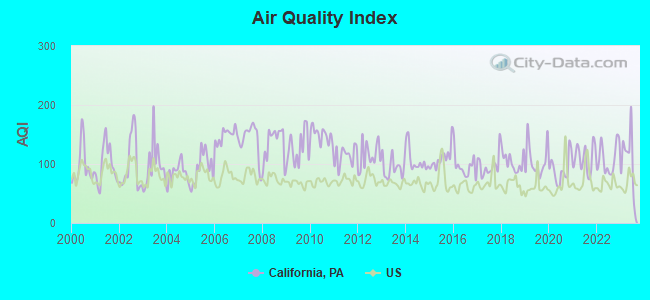
Air Quality Index (AQI) level in 2023 was 108. This is significantly worse than average.
| City: | 108 |
| U.S.: | 73 |
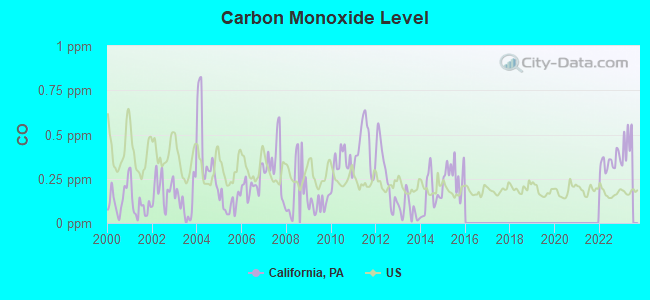
Carbon Monoxide (CO) [ppm] level in 2022 was 0.343. This is worse than average. Closest monitor was 5.6 miles away from the city center.
| City: | 0.343 |
| U.S.: | 0.251 |
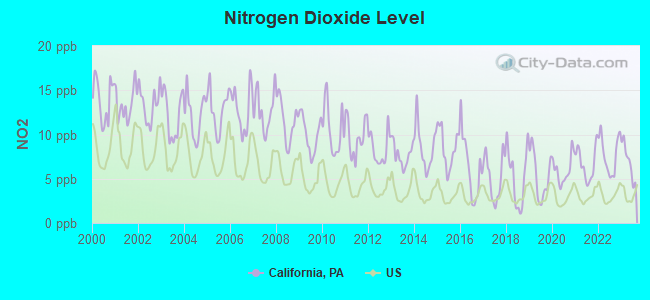
Nitrogen Dioxide (NO2) [ppb] level in 2023 was 7.00. This is worse than average. Closest monitor was 5.6 miles away from the city center.
| City: | 7.00 |
| U.S.: | 5.11 |
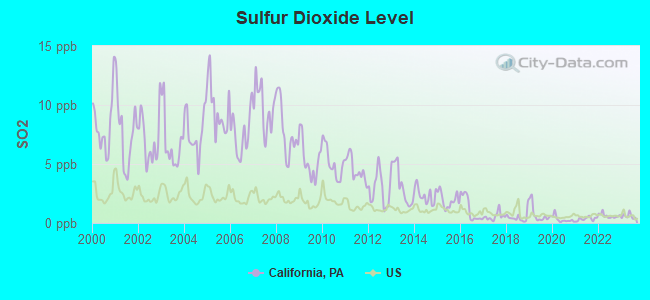
Sulfur Dioxide (SO2) [ppb] level in 2023 was 0.580. This is significantly better than average. Closest monitor was 5.6 miles away from the city center.
| City: | 0.580 |
| U.S.: | 1.515 |
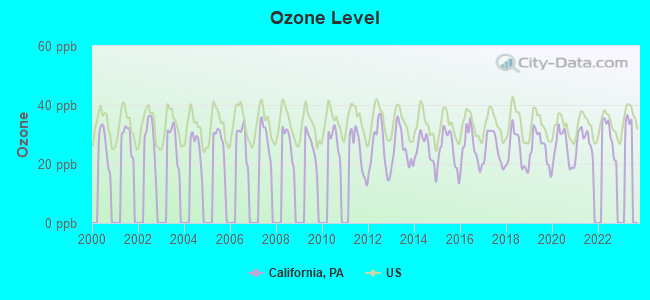
Ozone [ppb] level in 2022 was 29.8. This is about average. Closest monitor was 5.6 miles away from the city center.
| City: | 29.8 |
| U.S.: | 33.3 |
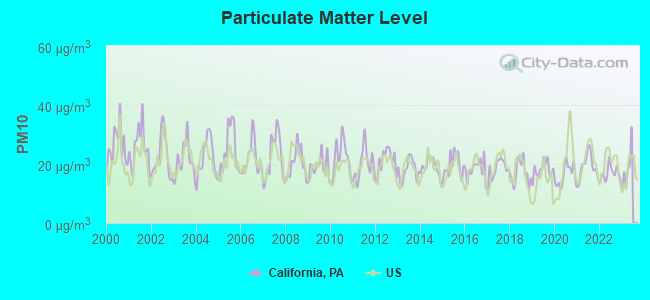
Particulate Matter (PM10) [µg/m3] level in 2022 was 16.8. This is about average. Closest monitor was 5.6 miles away from the city center.
| City: | 16.8 |
| U.S.: | 19.2 |
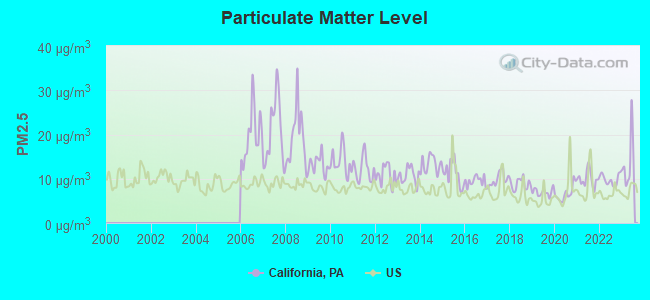
Particulate Matter (PM2.5) [µg/m3] level in 2023 was 13.7. This is significantly worse than average. Closest monitor was 5.6 miles away from the city center.
| City: | 13.7 |
| U.S.: | 8.1 |
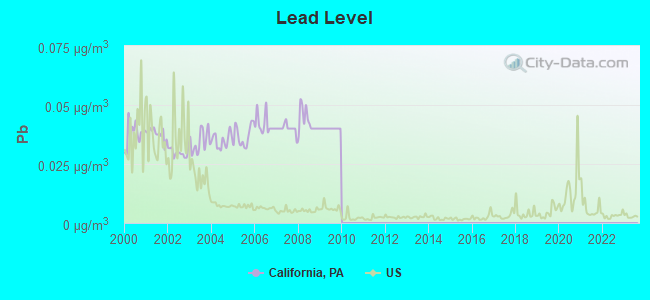
Lead (Pb) [µg/m3] level in 2009 was 0.0400. This is significantly worse than average. Closest monitor was 3.1 miles away from the city center.
| City: | 0.0400 |
| U.S.: | 0.0093 |
Tornado activity:
California-area historical tornado activity is slightly below Pennsylvania state average. It is 35% smaller than the overall U.S. average.
On 6/2/1998, a category F4 (max. wind speeds 207-260 mph) tornado 35.9 miles away from the California borough center injured 5 people and caused $6 million in damages.
On 8/3/1963, a category F3 (max. wind speeds 158-206 mph) tornado 17.6 miles away from the borough center killed 2 people and injured 70 people and caused between $5,000,000 and $50,000,000 in damages.
Earthquake activity:
California-area historical earthquake activity is significantly above Pennsylvania state average. It is 46% smaller than the overall U.S. average.On 8/23/2011 at 17:51:04, a magnitude 5.8 (5.8 MW, Depth: 3.7 mi, Class: Moderate, Intensity: VI - VII) earthquake occurred 182.6 miles away from California center
On 9/25/1998 at 19:52:52, a magnitude 5.2 (4.8 MB, 4.3 MS, 5.2 LG, 4.5 MW, Depth: 3.1 mi) earthquake occurred 102.0 miles away from California center
On 1/31/1986 at 16:46:43, a magnitude 5.0 (5.0 MB) earthquake occurred 125.2 miles away from California center
On 7/27/1980 at 18:52:21, a magnitude 5.2 (5.1 MB, 4.7 MS, 5.0 UK, 5.2 UK) earthquake occurred 252.3 miles away from the city center
On 8/9/2020 at 12:07:37, a magnitude 5.1 (5.1 MW, Depth: 4.7 mi) earthquake occurred 256.6 miles away from California center
On 8/25/2011 at 05:07:52, a magnitude 4.5 (4.5 ML, Depth: 4.2 mi, Class: Light, Intensity: IV - V) earthquake occurred 179.5 miles away from California center
Magnitude types: regional Lg-wave magnitude (LG), body-wave magnitude (MB), local magnitude (ML), surface-wave magnitude (MS), moment magnitude (MW)
Natural disasters:
The number of natural disasters in Washington County (13) is near the US average (15).Major Disasters (Presidential) Declared: 8
Emergencies Declared: 5
Causes of natural disasters: Floods: 3, Storms: 3, Hurricanes: 2, Snowstorms: 2, Tropical Depressions: 2, Winter Storms: 2, Blizzard: 1, Snowfall: 1, Tropical Storm: 1, Other: 1 (Note: some incidents may be assigned to more than one category).
Hospitals and medical centers near California:
- TARA HOSPITAL AT BROWNSVILLE (Hospital, about 6 miles away; BROWNSVILLE, PA)
- BROWNSVILLE GENERAL HOSPITAL SNF (Nursing Home, about 6 miles away; BROWNSVILLE, PA)
- WASHINGTON GREENE ALTERNATIVE (Hospital, about 8 miles away; ELLSWORTH, PA)
- FRESENIUS MEDICAL CARE DONORA (Dialysis Facility, about 8 miles away; DONORA, PA)
- HAVENCREST NURSING CENTER (Nursing Home, about 8 miles away; MONONGAHELA, PA)
- VALLEY COMMUNITY SERVICES (Hospital, about 8 miles away; BELLE VERNON, PA)
- MONONGAHELA VALLEY HOSPITAL Acute Care Hospitals (about 9 miles away; MONONGAHELA, PA)
College/University in California:
Other colleges/universities with over 2000 students near California:
- Waynesburg University (about 20 miles; Waynesburg, PA; Full-time enrollment: 2,080)
- Westmoreland County Community College (about 22 miles; Youngwood, PA; FT enrollment: 4,669)
- Seton Hill University (about 25 miles; Greensburg, PA; FT enrollment: 2,167)
- Duquesne University (about 27 miles; Pittsburgh, PA; FT enrollment: 8,211)
- Carnegie Mellon University (about 27 miles; Pittsburgh, PA; FT enrollment: 14,186)
- Point Park University (about 27 miles; Pittsburgh, PA; FT enrollment: 3,525)
- University of Pittsburgh-Pittsburgh Campus (about 27 miles; Pittsburgh, PA; FT enrollment: 27,137)
User-submitted facts and corrections:
- WVCS is now WCAL and is owned by Student Association, Inc.
Points of interest:
Notable locations in California: California Overlook (A), New Science Hall (B), Natali Student Center (C), Manderino Library (D), Longanecker Hall (E), Keystone Hall (F), Kara Alumni House (G), Herron Hall (H), Hamer Hall (I), Eberly Hall (J), Duda Hall (K), Downey-Garofalo Health Center (L), Dixon Hall (M), Coover Annex (N), Clyde Hall (O), Azorsky Hall (P), Vulcan Hall (Q), Steele Hall (R), Pollock Building (S), Noss Hall (T). Display/hide their locations on the map
Cemeteries: Eastern Cemetery (1), Highland Cemetery (2). Display/hide their locations on the map
Streams, rivers, and creeks: Gorby Run (A). Display/hide its location on the map
Tourist attraction: California Area Historical Society (Historical Places & Services; 429 Wood Street).
Birthplace of: Bruce Dal Canton - Baseball player, Bert Humphries - Baseball player.
| This borough: | 2.2 people |
| Pennsylvania: | 2.5 people |
| This borough: | 35.8% |
| Whole state: | 65.0% |
| This borough: | 5.0% |
| Whole state: | 6.6% |
Likely homosexual households (counted as self-reported same-sex unmarried-partner households)
- Lesbian couples: 0.2% of all households
- Gay men: 0.3% of all households
People in group quarters in California in 2000:
- 1,176 people in college dormitories (includes college quarters off campus)
- 8 people in other group homes
- 8 people in other noninstitutional group quarters
- 5 people in nursing homes
- 3 people in religious group quarters
Banks with branches in California (2011 data):
- First Niagara Bank, National Association: California Branch at 256 Third St., branch established on 1955/01/24. Info updated 2011/06/09: Bank assets: $32,750.6 mil, Deposits: $19,595.4 mil, headquarters in Buffalo, NY, positive income, Commercial Lending Specialization, 351 total offices, Holding Company: First Niagara Financial Group, Inc.
- PNC Bank, National Association: California Branch at 200 Wood Street, branch established on 1954/10/01. Info updated 2012/03/20: Bank assets: $263,309.6 mil, Deposits: $197,343.0 mil, headquarters in Wilmington, DE, positive income, Commercial Lending Specialization, 3085 total offices, Holding Company: Pnc Financial Services Group, Inc., The
For population 15 years and over in California:
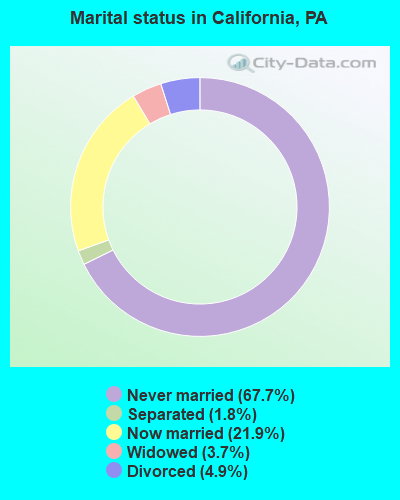
- Never married: 67.7%
- Now married: 21.9%
- Separated: 1.8%
- Widowed: 3.7%
- Divorced: 4.9%
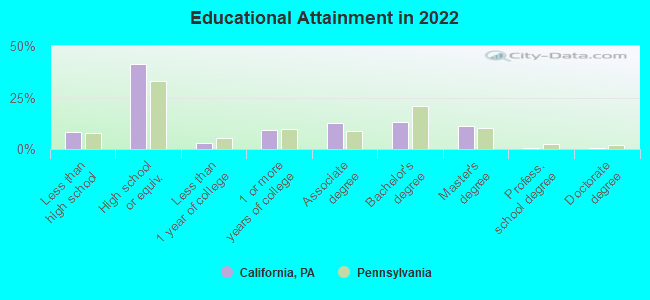
For population 25 years and over in California:
- High school or higher: 90.2%
- Bachelor's degree or higher: 24.9%
- Graduate or professional degree: 11.9%
- Unemployed: 22.8%
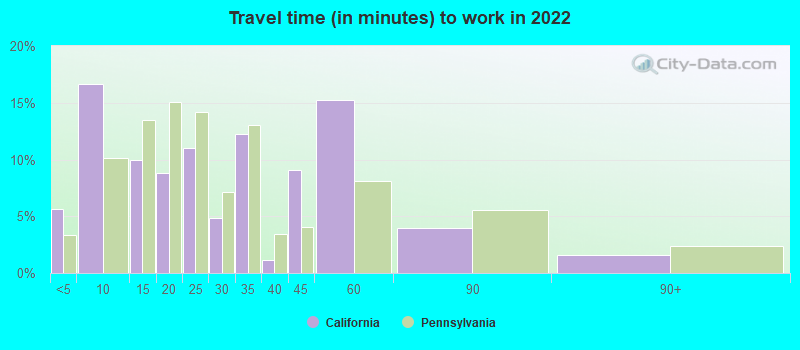
- Mean travel time to work (commute): 19.4 minutes
| Here: | 9.9 |
| Pennsylvania average: | 11.4 |

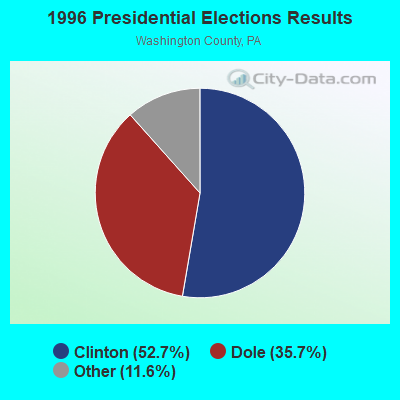
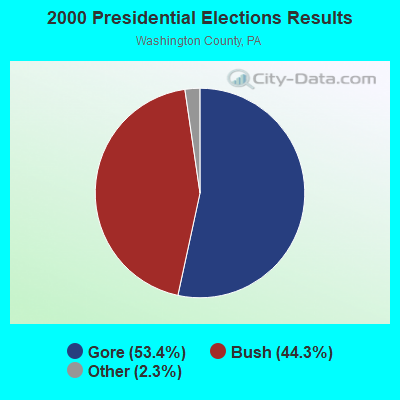
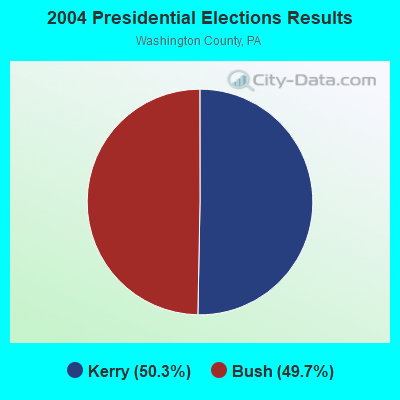
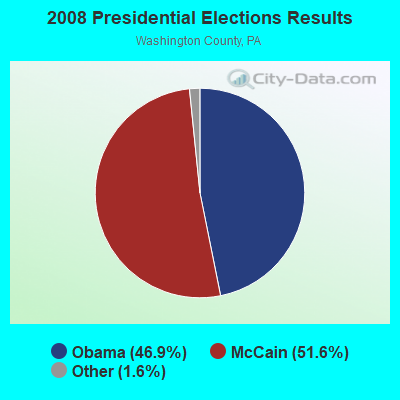
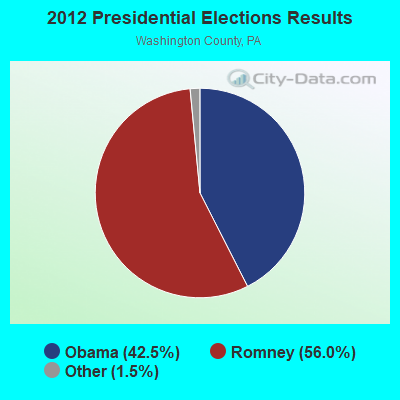
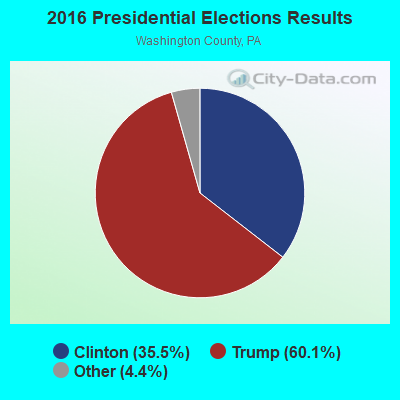
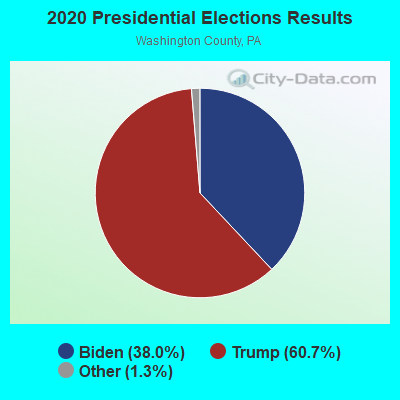
Graphs represent county-level data. Detailed 2008 Election Results
Religion statistics for California, PA (based on Washington County data)
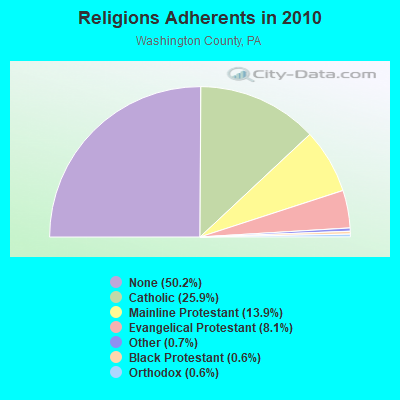
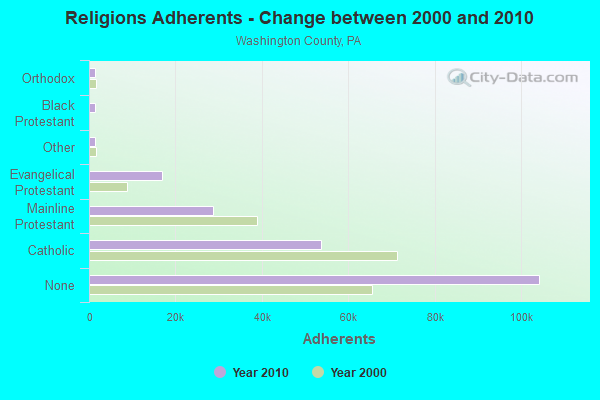
| Religion | Adherents | Congregations |
|---|---|---|
| Catholic | 53,777 | 28 |
| Mainline Protestant | 28,797 | 129 |
| Evangelical Protestant | 16,871 | 97 |
| Other | 1,459 | 8 |
| Black Protestant | 1,340 | 11 |
| Orthodox | 1,275 | 7 |
| None | 104,301 | - |
Food Environment Statistics:
| This county: | 1.66 / 10,000 pop. |
| Pennsylvania: | 2.04 / 10,000 pop. |
| Washington County: | 0.10 / 10,000 pop. |
| Pennsylvania: | 0.09 / 10,000 pop. |
| Washington County: | 0.78 / 10,000 pop. |
| Pennsylvania: | 0.88 / 10,000 pop. |
| Here: | 2.82 / 10,000 pop. |
| Pennsylvania: | 2.52 / 10,000 pop. |
| Here: | 5.79 / 10,000 pop. |
| Pennsylvania: | 7.12 / 10,000 pop. |
| This county: | 10.1% |
| Pennsylvania: | 9.1% |
| Here: | 30.9% |
| Pennsylvania: | 27.2% |
| Here: | 12.3% |
| Pennsylvania: | 11.5% |
Health and Nutrition:
| California: | 53.1% |
| State: | 50.2% |
| California: | 55.3% |
| Pennsylvania: | 47.1% |
| Here: | 27.6 |
| Pennsylvania: | 28.7 |
| This city: | 19.4% |
| Pennsylvania: | 20.8% |
| California: | 11.3% |
| State: | 10.9% |
| California: | 7.0 |
| Pennsylvania: | 6.8 |
| California: | 26.7% |
| Pennsylvania: | 34.3% |
| California: | 61.8% |
| Pennsylvania: | 56.2% |
| This city: | 80.5% |
| Pennsylvania: | 78.3% |
More about Health and Nutrition of California, PA Residents
| Local government employment and payroll (March 2022) | |||||
| Function | Full-time employees | Monthly full-time payroll | Average yearly full-time wage | Part-time employees | Monthly part-time payroll |
|---|---|---|---|---|---|
| Police Protection - Officers | 6 | $60,075 | $120,150 | 4 | $4,997 |
| Streets and Highways | 4 | $18,093 | $54,279 | 1 | $209 |
| Other Government Administration | 2 | $7,875 | $47,250 | 10 | $1,495 |
| Financial Administration | 1 | $4,040 | $48,480 | 0 | $0 |
| Sewerage | 1 | $7,617 | $91,404 | 0 | $0 |
| Police - Other | 1 | $3,073 | $36,876 | 1 | $1,612 |
| Totals for Government | 15 | $100,774 | $80,619 | 16 | $8,313 |
California government finances - Expenditure in 2017 (per resident):
- Construction - General Public Buildings: $124,000 ($24.44)
- Current Operations - Sewerage: $885,000 ($174.42)
Police Protection: $721,000 ($142.10)
Regular Highways: $475,000 ($93.61)
General - Other: $369,000 ($72.72)
Central Staff Services: $199,000 ($39.22)
Housing and Community Development: $124,000 ($24.44)
General Public Buildings: $83,000 ($16.36)
Local Fire Protection: $79,000 ($15.57)
Judicial and Legal Services: $29,000 ($5.72)
Financial Administration: $22,000 ($4.34)
Parks and Recreation: $13,000 ($2.56)
- General - Interest on Debt: $230,000 ($45.33)
- Other Capital Outlay - Regular Highways: $249,000 ($49.07)
Parks and Recreation: $42,000 ($8.28)
Central Staff Services: $21,000 ($4.14)
- Total Salaries and Wages: $970,000 ($191.17)
California government finances - Revenue in 2017 (per resident):
- Charges - Sewerage: $2,077,000 ($409.34)
Other: $197,000 ($38.83)
Parking Facilities: $108,000 ($21.28)
Regular Highways: $3,000 ($0.59)
- Miscellaneous - Donations From Private Sources: $142,000 ($27.99)
Fines and Forfeits: $83,000 ($16.36)
Rents: $50,000 ($9.85)
General Revenue - Other: $45,000 ($8.87)
Interest Earnings: $18,000 ($3.55)
Sale of Property: $8,000 ($1.58)
- State Intergovernmental - Other: $267,000 ($52.62)
Highways: $185,000 ($36.46)
General Local Government Support: $4,000 ($0.79)
- Tax - Property: $593,000 ($116.87)
Individual Income: $297,000 ($58.53)
Occupation and Business License - Other: $167,000 ($32.91)
Public Utility License: $63,000 ($12.42)
Documentary and Stock Transfer: $27,000 ($5.32)
California government finances - Debt in 2017 (per resident):
- Long Term Debt - Outstanding Unspecified Public Purpose: $6,880,000 ($1355.93)
Beginning Outstanding - Unspecified Public Purpose: $6,841,000 ($1348.25)
Issue, Unspecified Public Purpose: $223,000 ($43.95)
Retired Unspecified Public Purpose: $183,000 ($36.07)
California government finances - Cash and Securities in 2017 (per resident):
- Bond Funds - Cash and Securities: $159,000 ($31.34)
- Other Funds - Cash and Securities: $9,214,000 ($1815.92)
| Businesses in California, PA | ||||
| Name | Count | Name | Count | |
|---|---|---|---|---|
| Cricket Wireless | 1 | Goodwill | 5 | |
| Dairy Queen | 1 | Quiznos | 1 | |
| FedEx | 1 | Rite Aid | 1 | |
| GNC | 1 | Subway | 1 | |
Strongest AM radio stations in California:
- WASP (1130 AM; daytime; 5 kW; BROWNSVILLE, PA; Owner: KEYMARKET LICENSES, LLC)
- KDKA (1020 AM; 50 kW; PITTSBURGH, PA; Owner: INFINITY BROADCASTING OPERATIONS, INC.)
- WKHB (620 AM; 6 kW; IRWIN, PA; Owner: BROADCAST COMMUNICATIONS, INC.)
- WWCS (540 AM; 5 kW; CANONSBURG, PA; Owner: BIRACH BROADCASTING CORPORATION)
- WWVA (1170 AM; 53 kW; WHEELING, WV; Owner: CAPSTAR TX LIMITED PARTNERSHIP)
- WFGI (940 AM; 0 kW; CHARLEROI, PA; Owner: KEYMARKET LICENSES, LLC)
- WJAS (1320 AM; 6 kW; PITTSBURGH, PA; Owner: RENDA BROADCASTING CORP. OF NEVADA)
- WPIT (730 AM; 5 kW; PITTSBURGH, PA; Owner: PENNSYLVANIA MEDIA ASSOCIATES, INC.)
- WEAE (1250 AM; 5 kW; PITTSBURGH, PA; Owner: ABC, INC.)
- WPTT (1360 AM; 5 kW; MCKEESPORT, PA; Owner: RENDA BROADCASTING CORPORATION OF NEVADA)
- WMBS (590 AM; 1 kW; UNIONTOWN, PA; Owner: FAYETTE BROADCASTING CORP.)
- WVSC (990 AM; 10 kW; SOMERSET, PA; Owner: FOREVER OF JOHNSTOWN, INC.)
- WBGG (970 AM; 5 kW; PITTSBURGH, PA; Owner: AMFM RADIO LICENSES, L.L.C.)
Strongest FM radio stations in California:
- WVCS (91.9 FM; CALIFORNIA, PA; Owner: FOREVER OF SOMERSET, INC.)
- WOGG (94.9 FM; OLIVER, PA; Owner: KEYMARKET LICENSES, LLC)
- WVPM (90.9 FM; MORGANTOWN, WV; Owner: WEST VIRGINIA EDUCATIONAL BROADCASTING AUTHORITY)
- WLSW (103.9 FM; SCOTTDALE, PA; Owner: L. STANLEY WALL)
- WANB-FM (103.1 FM; WAYNESBURG, PA; Owner: BROADCAST COMMUNICATIONS, INC.)
- WSHH (99.7 FM; PITTSBURGH, PA; Owner: RENDA B/CING CORP. OF NEVADA)
- WRIJ (106.9 FM; MASONTOWN, PA; Owner: HE'S ALIVE INC.)
- WWSW-FM (94.5 FM; PITTSBURGH, PA; Owner: AMFM RADIO LICENSES, L.L.C.)
- WDSY-FM (107.9 FM; PITTSBURGH, PA; Owner: INFINITY RADIO SUBSIDIARY OPERATIONS INC.)
- WLTJ (92.9 FM; PITTSBURGH, PA; Owner: WPNT, INC.)
- WJJJ (104.7 FM; PITTSBURGH, PA; Owner: CAPSTAR TX LIMITED PARTNERSHIP)
- WPKL (99.3 FM; UNIONTOWN, PA; Owner: KEYMARKET LICENSES, LLC)
- WDVE (102.5 FM; PITTSBURGH, PA; Owner: CAPSTAR TX LIMITED PARTNERSHIP)
- WQED-FM (89.3 FM; PITTSBURGH, PA; Owner: WQED MULTIMEDIA)
- WZPT (100.7 FM; NEW KENSINGTON, PA; Owner: INFINITY RADIO SUBSIDIARY OPERATIONS INC.)
- WSSZ (107.1 FM; GREENSBURG, PA; Owner: MCL/MCM-INC.)
- WKST-FM (96.1 FM; PITTSBURGH, PA; Owner: CAPSTAR TX LIMITED PARTNERSHIP)
- WRRK (96.9 FM; BRADDOCK, PA; Owner: WPNT INC)
- WJPA-FM (95.3 FM; WASHINGTON, PA; Owner: WASHINGTON BROADCASTING COMPANY)
- WBZZ (93.7 FM; PITTSBURGH, PA; Owner: INFINITY RADIO SUBSIDIARY OPERATIONS INC.)
TV broadcast stations around California:
- W26AV (Channel 26; CHARLEROI, PA; Owner: DEBRA GOODWORTH)
- WTAE-TV (Channel 4; PITTSBURGH, PA; Owner: WTAE HEARST-ARGYLE TV, INC. (CA CORP.))
- WPXI (Channel 11; PITTSBURGH, PA; Owner: WPXI-TV HOLDINGS, INC.)
- WPCB-TV (Channel 40; GREENSBURG, PA; Owner: CORNERSTONE TELEVISION, INC.)
- W65CG (Channel 65; PITTSBURGH, PA; Owner: TRINITY BROADCASTING NETWORK)
- WTOV-TV (Channel 9; STEUBENVILLE, OH; Owner: WTOV-TV HOLDINGS, INC.)
- WBGN-LP (Channel 59; PITTSBURGH, PA; Owner: BRUNO GOODWORTH NETWORK, INC.)
- WPTG-LP (Channel 69; PITTSBURGH, PA; Owner: ABACUS TELEVISION)
- WQEX (Channel 16; PITTSBURGH, PA; Owner: WQED MULTIMEDIA)
- WCWB (Channel 22; PITTSBURGH, PA; Owner: WCWB LICENSEE, LLC)
- KDKA-TV (Channel 2; PITTSBURGH, PA; Owner: CBS BROADCASTING INC.)
- WPGH-TV (Channel 53; PITTSBURGH, PA; Owner: WPGH LICENSEE, LLC)
- WQED (Channel 13; PITTSBURGH, PA; Owner: WQED MULTIMEDIA)
- W61CC (Channel 61; PITTSBURGH, PA; Owner: THE VIDEOHOUSE, INC.)
- WIIC-LP (Channel 29; PITTSBURGH, PA; Owner: ABACUS TELEVISION)
- WWAT-CA (Channel 45; UNIONTOWN, PA; Owner: ABACUS TELEVISION)
- WBPA-LP (Channel 29; PITTSBURGH, PA; Owner: VENTURE TECHNOLOGIES GROUP, LLC)
- WNPB-TV (Channel 24; MORGANTOWN, WV; Owner: WEST VIRGINIA EDUCATIONAL BROADCASTING AUTHORITY)
- W20AN (Channel 20; WASHINGTON, PA; Owner: TURNPIKE TELEVISION)
- W35AW (Channel 35; UNIONTOWN, PA; Owner: DEBRA GOODWORTH)
- National Bridge Inventory (NBI) Statistics
- 54Number of bridges
- 538ft / 164mTotal length
- $4,525,000Total costs
- 256,510Total average daily traffic
- 46,374Total average daily truck traffic
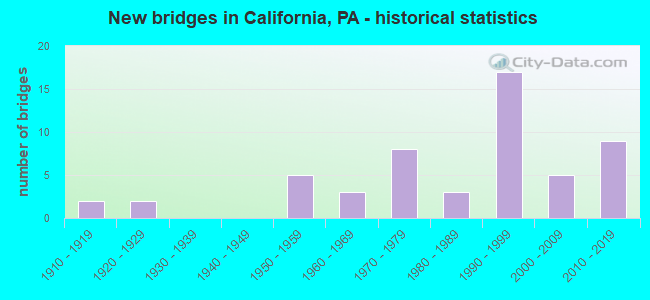
- New bridges - historical statistics
- 21910-1919
- 21920-1929
- 51950-1959
- 31960-1969
- 81970-1979
- 31980-1989
- 171990-1999
- 52000-2009
- 92010-2019
FCC Registered Antenna Towers:
26 (See the full list of FCC Registered Antenna Towers in California)FCC Registered Broadcast Land Mobile Towers:
3- 101 Wood St (Lat: 40.068139 Lon: -79.888389), Call Sign: KGE841,
Assigned Frequencies: 46.4600 MHz, Grant Date: 03/09/1996, Expiration Date: 03/25/2001, Cancellation Date: 05/27/2001, Registrant: California Volunteer Fire Dept, 101 Wood St, California, PA 15419, Phone: (412) 938-3567
- Lat: 40.065000 Lon: -79.886667, Call Sign: WNZU558,
Assigned Frequencies: 451.400 MHz, 461.825 MHz, 464.825 MHz, 462.375 MHz, Grant Date: 10/23/2012, Expiration Date: 06/26/2022, Cancellation Date: 08/27/2022, Registrant: Washington Radio Reports, 1588 Fairfield Rd Ste 7, Gettysburg, PA 17325, Phone: (717) 334-0668, Fax: (717) 334-6440, Email:
- 1.7 Mi Ese Of Int Of Sr 481 & Leg Rt 62196 (Lat: 40.055361 Lon: -79.937556), Call Sign: KLF857, Licensee ID: L00067330,
Assigned Frequencies: 48.1600 MHz, Grant Date: 12/10/1997, Expiration Date: 01/25/2003, Cancellation Date: 04/27/2003, Registrant: Redstone Water Company Inc, 3 Main Street, Daisytown, PA 15427
FCC Registered Microwave Towers:
3- 293 Malden Rd (Lat: 40.045889 Lon: -79.923083), Structure height: 7.3 m, Overall height: 12.2 m, Call Sign: WPNL776,
Assigned Frequencies: 943.375 MHz, Grant Date: 03/09/2018, Expiration Date: 05/28/2028, Registrant: Washington County Department Of Public Safety, 100 West Beau Street, Suite C-1, Washington, PA 15301, Phone: (724) 228-6911, Email:
- WPQR Studio, North Twr - 1.65 Mi Nw Of Brownsville Pa Btwn Pa Rt 88 & Us 40 (Lat: 40.043056 Lon: -79.905000), Type: Other, Structure height: 68.9 m, Call Sign: WPSS426,
Assigned Frequencies: 950.000 MHz, Grant Date: 07/23/2001, Expiration Date: 08/01/2030, Certifier: Lynn A Deppen, Registrant: Forever Media, Inc., 274 Lakemont Park Blvd, Altoona, PA 16602, Phone: (412) 951-1525, Fax: (814) 943-2754, Email:
- CALIFORNIA, 875 Highpoint Drive (Lat: 40.077778 Lon: -79.906389), Type: Ltower, Structure height: 82.3 m, Call Sign: WQQR596,
Assigned Frequencies: 11265.0 MHz, 11385.0 MHz, 11345.0 MHz, 11465.0 MHz, Grant Date: 01/18/2023, Expiration Date: 02/19/2033, Certifier: John Monday, Registrant: At&t Services, Inc., 208 S Akard St, 20f, Dallas, TX 75202, Phone: (855) 699-7073, Email:
FCC Registered Amateur Radio Licenses:
14 (See the full list of FCC Registered Amateur Radio Licenses in California)FAA Registered Aircraft:
1- Aircraft: DJI SPREADING WINGS S900 (Category: Land, Engines: 6), Engine: Electric
N-Number: 1851P, N1851P, N-1851P, Serial Number: 0370050312, Certificate Issue Date: 11/10/2016
Registrant (Government): California University Of Pennsylvania, 250 University Ave, California, PA 15419
Deregistered: Cancel Date: 07/09/2009
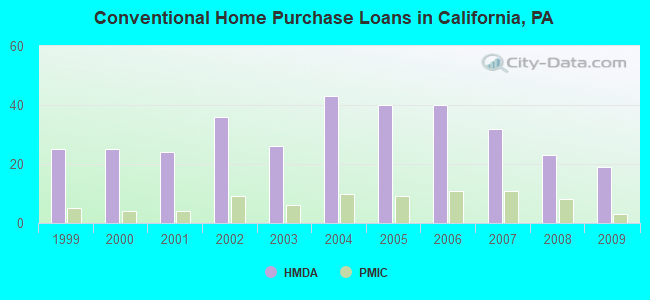
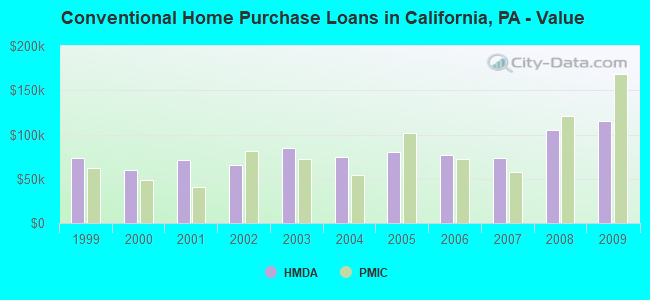
| Home Mortgage Disclosure Act Aggregated Statistics For Year 2009 (Based on 2 full tracts) | ||||||||||||||
| A) FHA, FSA/RHS & VA Home Purchase Loans | B) Conventional Home Purchase Loans | C) Refinancings | D) Home Improvement Loans | E) Loans on Dwellings For 5+ Families | F) Non-occupant Loans on < 5 Family Dwellings (A B C & D) | G) Loans On Manufactured Home Dwelling (A B C & D) | ||||||||
|---|---|---|---|---|---|---|---|---|---|---|---|---|---|---|
| Number | Average Value | Number | Average Value | Number | Average Value | Number | Average Value | Number | Average Value | Number | Average Value | Number | Average Value | |
| LOANS ORIGINATED | 11 | $101,518 | 19 | $115,129 | 36 | $98,339 | 5 | $33,170 | 2 | $252,655 | 10 | $93,844 | 0 | $0 |
| APPLICATIONS APPROVED, NOT ACCEPTED | 0 | $0 | 2 | $70,035 | 9 | $95,192 | 3 | $19,117 | 0 | $0 | 2 | $45,905 | 0 | $0 |
| APPLICATIONS DENIED | 4 | $155,505 | 3 | $151,717 | 26 | $106,405 | 4 | $74,062 | 0 | $0 | 4 | $84,238 | 1 | $172,380 |
| APPLICATIONS WITHDRAWN | 0 | $0 | 1 | $95,000 | 10 | $128,193 | 1 | $55,000 | 1 | $90,000 | 1 | $95,000 | 0 | $0 |
| FILES CLOSED FOR INCOMPLETENESS | 0 | $0 | 0 | $0 | 2 | $120,660 | 0 | $0 | 0 | $0 | 0 | $0 | 0 | $0 |
Detailed HMDA statistics for the following Tracts: 7921.00 , 7922.00
| Private Mortgage Insurance Companies Aggregated Statistics For Year 2009 (Based on 2 full tracts) | ||||||
| A) Conventional Home Purchase Loans | B) Refinancings | C) Non-occupant Loans on < 5 Family Dwellings (A & B) | ||||
|---|---|---|---|---|---|---|
| Number | Average Value | Number | Average Value | Number | Average Value | |
| LOANS ORIGINATED | 3 | $168,553 | 1 | $280,730 | 1 | $98,000 |
| APPLICATIONS APPROVED, NOT ACCEPTED | 1 | $61,070 | 1 | $287,620 | 0 | $0 |
| APPLICATIONS DENIED | 0 | $0 | 0 | $0 | 0 | $0 |
| APPLICATIONS WITHDRAWN | 0 | $0 | 1 | $276,780 | 0 | $0 |
| FILES CLOSED FOR INCOMPLETENESS | 0 | $0 | 0 | $0 | 0 | $0 |
Detailed PMIC statistics for the following Tracts: 7921.00 , 7922.00
| Most common first names in California, PA among deceased individuals | ||
| Name | Count | Lived (average) |
|---|---|---|
| John | 70 | 76.1 years |
| Mary | 49 | 81.9 years |
| William | 39 | 75.9 years |
| Joseph | 35 | 76.5 years |
| Margaret | 29 | 79.5 years |
| Anna | 28 | 83.8 years |
| Charles | 25 | 75.8 years |
| James | 24 | 71.5 years |
| George | 22 | 79.3 years |
| Elizabeth | 18 | 80.9 years |
| Most common last names in California, PA among deceased individuals | ||
| Last name | Count | Lived (average) |
|---|---|---|
| Harris | 16 | 75.4 years |
| Edwards | 13 | 81.0 years |
| Powell | 13 | 77.9 years |
| Campbell | 12 | 79.2 years |
| Smith | 11 | 79.1 years |
| Miller | 11 | 75.0 years |
| Coatsworth | 9 | 76.8 years |
| Encapera | 8 | 74.2 years |
| Williams | 8 | 73.1 years |
| Letrick | 8 | 78.4 years |
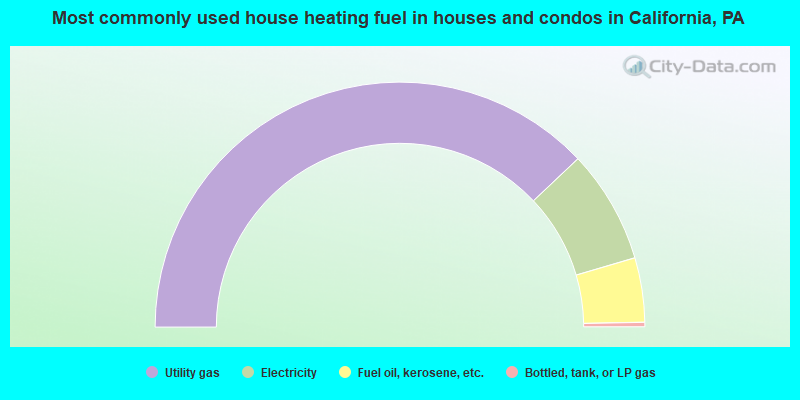
- 75.9%Utility gas
- 15.0%Electricity
- 8.5%Fuel oil, kerosene, etc.
- 0.6%Bottled, tank, or LP gas
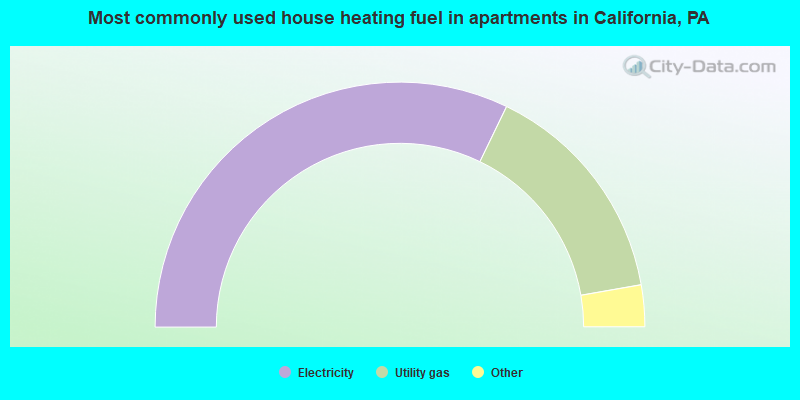
- 64.4%Electricity
- 30.2%Utility gas
- 3.6%No fuel used
- 1.0%Fuel oil, kerosene, etc.
- 0.8%Bottled, tank, or LP gas
California compared to Pennsylvania state average:
- Median household income below state average.
- Median house value below state average.
- Hispanic race population percentage significantly below state average.
- Median age significantly below state average.
- Foreign-born population percentage significantly below state average.
- Renting percentage above state average.
- Length of stay since moving in significantly above state average.
- Number of college students significantly above state average.
California on our top lists:
- #37 on the list of "Top 100 cities with highest percentage of college students (pop. 5,000+)"
- #43 on the list of "Top 100 cities with youngest residents (pop. 5,000+)"
- #48 on the list of "Top 101 cities with largest percentage of males in occupations: community and social service occupations (population 5,000+)"
- #66 on the list of "Top 101 cities with the lowest percentage of family households, population 1,000+"
- #78 on the list of "Top 101 cities with the most people taking a bicycle to work (population 5,000+)"
- #94 on the list of "Top 101 cities with largest percentage of males in industries: educational services (population 5,000+)"
- #95 on the list of "Top 101 cities with the most residents born in Other South Central Asia (population 500+)"
- #101 on the list of "Top 101 cities with the largest percentage of people in dormitories (population 1,000+)"
- #101 on the list of "Top 101 cities with the largest percentage of people in group homes (population 1,000+)"
- #101 on the list of "Top 101 cities with the largest percentage of people in hospitals/wards, hospices, and schools for the handicapped (population 1,000+)"
- #101 on the list of "Top 101 cities with the largest percentage of people in long-term care (population 1,000+)"
- #101 on the list of "Top 101 cities with the largest percentage of people in military quarters (population 1,000+)"
- #101 on the list of "Top 101 cities with the largest percentage of people in noninstitutionalized settings (population 1,000+)"
- #101 on the list of "Top 101 cities with the largest percentage of people in on base quarters (population 1,000+)"
- #101 on the list of "Top 101 cities with the largest percentage of people in schools, hospitals, or wards for the physically handicapped (population 1,000+)"
- #82 (15427) on the list of "Top 101 zip codes with the smallest percentage of taxpayers reporting profit/loss from business in 2012 (pop 1,000+)"
- #10 on the list of "Top 101 counties with the lowest ground withdrawal of fresh water for public supply (pop. 50,000+)"
- #14 on the list of "Top 101 counties with the highest Sulfur Oxides Annual air pollution readings in 2012 (µg/m3)"
- #21 on the list of "Top 101 counties with the lowest percentage of residents relocating to foreign countries in 2011 (pop. 50,000+)"
- #37 on the list of "Top 101 counties with the lowest number of births per 1000 residents 2007-2013"
- #54 on the list of "Top 101 counties with the lowest percentage of residents relocating to other counties in 2011 (pop. 50,000+)"

|
Total of 8 patent applications in 2008-2024.