La Palma, California Submit your own pictures of this city and show them to the world
OSM Map
General Map
Google Map
MSN Map
OSM Map
General Map
Google Map
MSN Map
OSM Map
General Map
Google Map
MSN Map
OSM Map
General Map
Google Map
MSN Map
Please wait while loading the map...
Population in 2022: 15,194 (100% urban, 0% rural). Population change since 2000: -1.4%Males: 7,133 Females: 8,061
March 2022 cost of living index in La Palma: 88.5 (less than average, U.S. average is 100) Percentage of residents living in poverty in 2022: 6.2%for White Non-Hispanic residents , 12.6% for Black residents , 3.9% for Hispanic or Latino residents , 25.6% for American Indian residents , 0.5% for two or more races residents )
Profiles of local businesses
Business Search - 14 Million verified businesses
Data:
Median household income ($)
Median household income (% change since 2000)
Household income diversity
Ratio of average income to average house value (%)
Ratio of average income to average rent
Median household income ($) - White
Median household income ($) - Black or African American
Median household income ($) - Asian
Median household income ($) - Hispanic or Latino
Median household income ($) - American Indian and Alaska Native
Median household income ($) - Multirace
Median household income ($) - Other Race
Median household income for houses/condos with a mortgage ($)
Median household income for apartments without a mortgage ($)
Races - White alone (%)
Races - White alone (% change since 2000)
Races - Black alone (%)
Races - Black alone (% change since 2000)
Races - American Indian alone (%)
Races - American Indian alone (% change since 2000)
Races - Asian alone (%)
Races - Asian alone (% change since 2000)
Races - Hispanic (%)
Races - Hispanic (% change since 2000)
Races - Native Hawaiian and Other Pacific Islander alone (%)
Races - Native Hawaiian and Other Pacific Islander alone (% change since 2000)
Races - Two or more races (%)
Races - Two or more races (% change since 2000)
Races - Other race alone (%)
Races - Other race alone (% change since 2000)
Racial diversity
Unemployment (%)
Unemployment (% change since 2000)
Unemployment (%) - White
Unemployment (%) - Black or African American
Unemployment (%) - Asian
Unemployment (%) - Hispanic or Latino
Unemployment (%) - American Indian and Alaska Native
Unemployment (%) - Multirace
Unemployment (%) - Other Race
Population density (people per square mile)
Population - Males (%)
Population - Females (%)
Population - Males (%) - White
Population - Males (%) - Black or African American
Population - Males (%) - Asian
Population - Males (%) - Hispanic or Latino
Population - Males (%) - American Indian and Alaska Native
Population - Males (%) - Multirace
Population - Males (%) - Other Race
Population - Females (%) - White
Population - Females (%) - Black or African American
Population - Females (%) - Asian
Population - Females (%) - Hispanic or Latino
Population - Females (%) - American Indian and Alaska Native
Population - Females (%) - Multirace
Population - Females (%) - Other Race
Coronavirus confirmed cases (Apr 24, 2024)
Deaths caused by coronavirus (Apr 24, 2024)
Coronavirus confirmed cases (per 100k population) (Apr 24, 2024)
Deaths caused by coronavirus (per 100k population) (Apr 24, 2024)
Daily increase in number of cases (Apr 24, 2024)
Weekly increase in number of cases (Apr 24, 2024)
Cases doubled (in days) (Apr 24, 2024)
Hospitalized patients (Apr 18, 2022)
Negative test results (Apr 18, 2022)
Total test results (Apr 18, 2022)
COVID Vaccine doses distributed (per 100k population) (Sep 19, 2023)
COVID Vaccine doses administered (per 100k population) (Sep 19, 2023)
COVID Vaccine doses distributed (Sep 19, 2023)
COVID Vaccine doses administered (Sep 19, 2023)
Likely homosexual households (%)
Likely homosexual households (% change since 2000)
Likely homosexual households - Lesbian couples (%)
Likely homosexual households - Lesbian couples (% change since 2000)
Likely homosexual households - Gay men (%)
Likely homosexual households - Gay men (% change since 2000)
Cost of living index
Median gross rent ($)
Median contract rent ($)
Median monthly housing costs ($)
Median house or condo value ($)
Median house or condo value ($ change since 2000)
Mean house or condo value by units in structure - 1, detached ($)
Mean house or condo value by units in structure - 1, attached ($)
Mean house or condo value by units in structure - 2 ($)
Mean house or condo value by units in structure by units in structure - 3 or 4 ($)
Mean house or condo value by units in structure - 5 or more ($)
Mean house or condo value by units in structure - Boat, RV, van, etc. ($)
Mean house or condo value by units in structure - Mobile home ($)
Median house or condo value ($) - White
Median house or condo value ($) - Black or African American
Median house or condo value ($) - Asian
Median house or condo value ($) - Hispanic or Latino
Median house or condo value ($) - American Indian and Alaska Native
Median house or condo value ($) - Multirace
Median house or condo value ($) - Other Race
Median resident age
Resident age diversity
Median resident age - Males
Median resident age - Females
Median resident age - White
Median resident age - Black or African American
Median resident age - Asian
Median resident age - Hispanic or Latino
Median resident age - American Indian and Alaska Native
Median resident age - Multirace
Median resident age - Other Race
Median resident age - Males - White
Median resident age - Males - Black or African American
Median resident age - Males - Asian
Median resident age - Males - Hispanic or Latino
Median resident age - Males - American Indian and Alaska Native
Median resident age - Males - Multirace
Median resident age - Males - Other Race
Median resident age - Females - White
Median resident age - Females - Black or African American
Median resident age - Females - Asian
Median resident age - Females - Hispanic or Latino
Median resident age - Females - American Indian and Alaska Native
Median resident age - Females - Multirace
Median resident age - Females - Other Race
Commute - mean travel time to work (minutes)
Travel time to work - Less than 5 minutes (%)
Travel time to work - Less than 5 minutes (% change since 2000)
Travel time to work - 5 to 9 minutes (%)
Travel time to work - 5 to 9 minutes (% change since 2000)
Travel time to work - 10 to 19 minutes (%)
Travel time to work - 10 to 19 minutes (% change since 2000)
Travel time to work - 20 to 29 minutes (%)
Travel time to work - 20 to 29 minutes (% change since 2000)
Travel time to work - 30 to 39 minutes (%)
Travel time to work - 30 to 39 minutes (% change since 2000)
Travel time to work - 40 to 59 minutes (%)
Travel time to work - 40 to 59 minutes (% change since 2000)
Travel time to work - 60 to 89 minutes (%)
Travel time to work - 60 to 89 minutes (% change since 2000)
Travel time to work - 90 or more minutes (%)
Travel time to work - 90 or more minutes (% change since 2000)
Marital status - Never married (%)
Marital status - Now married (%)
Marital status - Separated (%)
Marital status - Widowed (%)
Marital status - Divorced (%)
Median family income ($)
Median family income (% change since 2000)
Median non-family income ($)
Median non-family income (% change since 2000)
Median per capita income ($)
Median per capita income (% change since 2000)
Median family income ($) - White
Median family income ($) - Black or African American
Median family income ($) - Asian
Median family income ($) - Hispanic or Latino
Median family income ($) - American Indian and Alaska Native
Median family income ($) - Multirace
Median family income ($) - Other Race
Median year house/condo built
Median year apartment built
Year house built - Built 2005 or later (%)
Year house built - Built 2000 to 2004 (%)
Year house built - Built 1990 to 1999 (%)
Year house built - Built 1980 to 1989 (%)
Year house built - Built 1970 to 1979 (%)
Year house built - Built 1960 to 1969 (%)
Year house built - Built 1950 to 1959 (%)
Year house built - Built 1940 to 1949 (%)
Year house built - Built 1939 or earlier (%)
Average household size
Household density (households per square mile)
Average household size - White
Average household size - Black or African American
Average household size - Asian
Average household size - Hispanic or Latino
Average household size - American Indian and Alaska Native
Average household size - Multirace
Average household size - Other Race
Occupied housing units (%)
Vacant housing units (%)
Owner occupied housing units (%)
Renter occupied housing units (%)
Vacancy status - For rent (%)
Vacancy status - For sale only (%)
Vacancy status - Rented or sold, not occupied (%)
Vacancy status - For seasonal, recreational, or occasional use (%)
Vacancy status - For migrant workers (%)
Vacancy status - Other vacant (%)
Residents with income below the poverty level (%)
Residents with income below 50% of the poverty level (%)
Children below poverty level (%)
Poor families by family type - Married-couple family (%)
Poor families by family type - Male, no wife present (%)
Poor families by family type - Female, no husband present (%)
Poverty status for native-born residents (%)
Poverty status for foreign-born residents (%)
Poverty among high school graduates not in families (%)
Poverty among people who did not graduate high school not in families (%)
Residents with income below the poverty level (%) - White
Residents with income below the poverty level (%) - Black or African American
Residents with income below the poverty level (%) - Asian
Residents with income below the poverty level (%) - Hispanic or Latino
Residents with income below the poverty level (%) - American Indian and Alaska Native
Residents with income below the poverty level (%) - Multirace
Residents with income below the poverty level (%) - Other Race
Air pollution - Air Quality Index (AQI)
Air pollution - CO
Air pollution - NO2
Air pollution - SO2
Air pollution - Ozone
Air pollution - PM10
Air pollution - PM25
Air pollution - Pb
Crime - Murders per 100,000 population
Crime - Rapes per 100,000 population
Crime - Robberies per 100,000 population
Crime - Assaults per 100,000 population
Crime - Burglaries per 100,000 population
Crime - Thefts per 100,000 population
Crime - Auto thefts per 100,000 population
Crime - Arson per 100,000 population
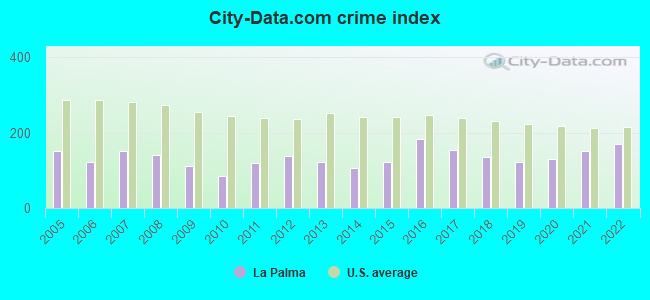
Crime - City-data.com crime index
Crime - Violent crime index
Crime - Property crime index
Crime - Murders per 100,000 population (5 year average)
Crime - Rapes per 100,000 population (5 year average)
Crime - Robberies per 100,000 population (5 year average)
Crime - Assaults per 100,000 population (5 year average)
Crime - Burglaries per 100,000 population (5 year average)
Crime - Thefts per 100,000 population (5 year average)
Crime - Auto thefts per 100,000 population (5 year average)
Crime - Arson per 100,000 population (5 year average)
Crime - City-data.com crime index (5 year average)
Crime - Violent crime index (5 year average)
Crime - Property crime index (5 year average)
1996 Presidential Elections Results (%) - Democratic Party (Clinton)
1996 Presidential Elections Results (%) - Republican Party (Dole)
1996 Presidential Elections Results (%) - Other
2000 Presidential Elections Results (%) - Democratic Party (Gore)
2000 Presidential Elections Results (%) - Republican Party (Bush)
2000 Presidential Elections Results (%) - Other
2004 Presidential Elections Results (%) - Democratic Party (Kerry)
2004 Presidential Elections Results (%) - Republican Party (Bush)
2004 Presidential Elections Results (%) - Other
2008 Presidential Elections Results (%) - Democratic Party (Obama)
2008 Presidential Elections Results (%) - Republican Party (McCain)
2008 Presidential Elections Results (%) - Other
2012 Presidential Elections Results (%) - Democratic Party (Obama)
2012 Presidential Elections Results (%) - Republican Party (Romney)
2012 Presidential Elections Results (%) - Other
2016 Presidential Elections Results (%) - Democratic Party (Clinton)
2016 Presidential Elections Results (%) - Republican Party (Trump)
2016 Presidential Elections Results (%) - Other
2020 Presidential Elections Results (%) - Democratic Party (Biden)
2020 Presidential Elections Results (%) - Republican Party (Trump)
2020 Presidential Elections Results (%) - Other
Ancestries Reported - Arab (%)
Ancestries Reported - Czech (%)
Ancestries Reported - Danish (%)
Ancestries Reported - Dutch (%)
Ancestries Reported - English (%)
Ancestries Reported - French (%)
Ancestries Reported - French Canadian (%)
Ancestries Reported - German (%)
Ancestries Reported - Greek (%)
Ancestries Reported - Hungarian (%)
Ancestries Reported - Irish (%)
Ancestries Reported - Italian (%)
Ancestries Reported - Lithuanian (%)
Ancestries Reported - Norwegian (%)
Ancestries Reported - Polish (%)
Ancestries Reported - Portuguese (%)
Ancestries Reported - Russian (%)
Ancestries Reported - Scotch-Irish (%)
Ancestries Reported - Scottish (%)
Ancestries Reported - Slovak (%)
Ancestries Reported - Subsaharan African (%)
Ancestries Reported - Swedish (%)
Ancestries Reported - Swiss (%)
Ancestries Reported - Ukrainian (%)
Ancestries Reported - United States (%)
Ancestries Reported - Welsh (%)
Ancestries Reported - West Indian (%)
Ancestries Reported - Other (%)
Educational Attainment - No schooling completed (%)
Educational Attainment - Less than high school (%)
Educational Attainment - High school or equivalent (%)
Educational Attainment - Less than 1 year of college (%)
Educational Attainment - 1 or more years of college (%)
Educational Attainment - Associate degree (%)
Educational Attainment - Bachelor's degree (%)
Educational Attainment - Master's degree (%)
Educational Attainment - Professional school degree (%)
Educational Attainment - Doctorate degree (%)
School Enrollment - Nursery, preschool (%)
School Enrollment - Kindergarten (%)
School Enrollment - Grade 1 to 4 (%)
School Enrollment - Grade 5 to 8 (%)
School Enrollment - Grade 9 to 12 (%)
School Enrollment - College undergrad (%)
School Enrollment - Graduate or professional (%)
School Enrollment - Not enrolled in school (%)
School enrollment - Public schools (%)
School enrollment - Private schools (%)
School enrollment - Not enrolled (%)
Median number of rooms in houses and condos
Median number of rooms in apartments
Housing units lacking complete plumbing facilities (%)
Housing units lacking complete kitchen facilities (%)
Density of houses
Urban houses (%)
Rural houses (%)
Households with people 60 years and over (%)
Households with people 65 years and over (%)
Households with people 75 years and over (%)
Households with one or more nonrelatives (%)
Households with no nonrelatives (%)
Population in households (%)
Family households (%)
Nonfamily households (%)
Population in families (%)
Family households with own children (%)
Median number of bedrooms in owner occupied houses
Mean number of bedrooms in owner occupied houses
Median number of bedrooms in renter occupied houses
Mean number of bedrooms in renter occupied houses
Median number of vehichles in owner occupied houses
Mean number of vehichles in owner occupied houses
Median number of vehichles in renter occupied houses
Mean number of vehichles in renter occupied houses
Mortgage status - with mortgage (%)
Mortgage status - with second mortgage (%)
Mortgage status - with home equity loan (%)
Mortgage status - with both second mortgage and home equity loan (%)
Mortgage status - without a mortgage (%)
Average family size
Average family size - White
Average family size - Black or African American
Average family size - Asian
Average family size - Hispanic or Latino
Average family size - American Indian and Alaska Native
Average family size - Multirace
Average family size - Other Race
Geographical mobility - Same house 1 year ago (%)
Geographical mobility - Moved within same county (%)
Geographical mobility - Moved from different county within same state (%)
Geographical mobility - Moved from different state (%)
Geographical mobility - Moved from abroad (%)
Place of birth - Born in state of residence (%)
Place of birth - Born in other state (%)
Place of birth - Native, outside of US (%)
Place of birth - Foreign born (%)
Housing units in structures - 1, detached (%)
Housing units in structures - 1, attached (%)
Housing units in structures - 2 (%)
Housing units in structures - 3 or 4 (%)
Housing units in structures - 5 to 9 (%)
Housing units in structures - 10 to 19 (%)
Housing units in structures - 20 to 49 (%)
Housing units in structures - 50 or more (%)
Housing units in structures - Mobile home (%)
Housing units in structures - Boat, RV, van, etc. (%)
House/condo owner moved in on average (years ago)
Renter moved in on average (years ago)
Year householder moved into unit - Moved in 1999 to March 2000 (%)
Year householder moved into unit - Moved in 1995 to 1998 (%)
Year householder moved into unit - Moved in 1990 to 1994 (%)
Year householder moved into unit - Moved in 1980 to 1989 (%)
Year householder moved into unit - Moved in 1970 to 1979 (%)
Year householder moved into unit - Moved in 1969 or earlier (%)
Means of transportation to work - Drove car alone (%)
Means of transportation to work - Carpooled (%)
Means of transportation to work - Public transportation (%)
Means of transportation to work - Bus or trolley bus (%)
Means of transportation to work - Streetcar or trolley car (%)
Means of transportation to work - Subway or elevated (%)
Means of transportation to work - Railroad (%)
Means of transportation to work - Ferryboat (%)
Means of transportation to work - Taxicab (%)
Means of transportation to work - Motorcycle (%)
Means of transportation to work - Bicycle (%)
Means of transportation to work - Walked (%)
Means of transportation to work - Other means (%)
Working at home (%)
Industry diversity
Most Common Industries - Agriculture, forestry, fishing and hunting, and mining (%)
Most Common Industries - Agriculture, forestry, fishing and hunting (%)
Most Common Industries - Mining, quarrying, and oil and gas extraction (%)
Most Common Industries - Construction (%)
Most Common Industries - Manufacturing (%)
Most Common Industries - Wholesale trade (%)
Most Common Industries - Retail trade (%)
Most Common Industries - Transportation and warehousing, and utilities (%)
Most Common Industries - Transportation and warehousing (%)
Most Common Industries - Utilities (%)
Most Common Industries - Information (%)
Most Common Industries - Finance and insurance, and real estate and rental and leasing (%)
Most Common Industries - Finance and insurance (%)
Most Common Industries - Real estate and rental and leasing (%)
Most Common Industries - Professional, scientific, and management, and administrative and waste management services (%)
Most Common Industries - Professional, scientific, and technical services (%)
Most Common Industries - Management of companies and enterprises (%)
Most Common Industries - Administrative and support and waste management services (%)
Most Common Industries - Educational services, and health care and social assistance (%)
Most Common Industries - Educational services (%)
Most Common Industries - Health care and social assistance (%)
Most Common Industries - Arts, entertainment, and recreation, and accommodation and food services (%)
Most Common Industries - Arts, entertainment, and recreation (%)
Most Common Industries - Accommodation and food services (%)
Most Common Industries - Other services, except public administration (%)
Most Common Industries - Public administration (%)
Occupation diversity
Most Common Occupations - Management, business, science, and arts occupations (%)
Most Common Occupations - Management, business, and financial occupations (%)
Most Common Occupations - Management occupations (%)
Most Common Occupations - Business and financial operations occupations (%)
Most Common Occupations - Computer, engineering, and science occupations (%)
Most Common Occupations - Computer and mathematical occupations (%)
Most Common Occupations - Architecture and engineering occupations (%)
Most Common Occupations - Life, physical, and social science occupations (%)
Most Common Occupations - Education, legal, community service, arts, and media occupations (%)
Most Common Occupations - Community and social service occupations (%)
Most Common Occupations - Legal occupations (%)
Most Common Occupations - Education, training, and library occupations (%)
Most Common Occupations - Arts, design, entertainment, sports, and media occupations (%)
Most Common Occupations - Healthcare practitioners and technical occupations (%)
Most Common Occupations - Health diagnosing and treating practitioners and other technical occupations (%)
Most Common Occupations - Health technologists and technicians (%)
Most Common Occupations - Service occupations (%)
Most Common Occupations - Healthcare support occupations (%)
Most Common Occupations - Protective service occupations (%)
Most Common Occupations - Fire fighting and prevention, and other protective service workers including supervisors (%)
Most Common Occupations - Law enforcement workers including supervisors (%)
Most Common Occupations - Food preparation and serving related occupations (%)
Most Common Occupations - Building and grounds cleaning and maintenance occupations (%)
Most Common Occupations - Personal care and service occupations (%)
Most Common Occupations - Sales and office occupations (%)
Most Common Occupations - Sales and related occupations (%)
Most Common Occupations - Office and administrative support occupations (%)
Most Common Occupations - Natural resources, construction, and maintenance occupations (%)
Most Common Occupations - Farming, fishing, and forestry occupations (%)
Most Common Occupations - Construction and extraction occupations (%)
Most Common Occupations - Installation, maintenance, and repair occupations (%)
Most Common Occupations - Production, transportation, and material moving occupations (%)
Most Common Occupations - Production occupations (%)
Most Common Occupations - Transportation occupations (%)
Most Common Occupations - Material moving occupations (%)
People in Group quarters - Institutionalized population (%)
People in Group quarters - Correctional institutions (%)
People in Group quarters - Federal prisons and detention centers (%)
People in Group quarters - Halfway houses (%)
People in Group quarters - Local jails and other confinement facilities (including police lockups) (%)
People in Group quarters - Military disciplinary barracks (%)
People in Group quarters - State prisons (%)
People in Group quarters - Other types of correctional institutions (%)
People in Group quarters - Nursing homes (%)
People in Group quarters - Hospitals/wards, hospices, and schools for the handicapped (%)
People in Group quarters - Hospitals/wards and hospices for chronically ill (%)
People in Group quarters - Hospices or homes for chronically ill (%)
People in Group quarters - Military hospitals or wards for chronically ill (%)
People in Group quarters - Other hospitals or wards for chronically ill (%)
People in Group quarters - Hospitals or wards for drug/alcohol abuse (%)
People in Group quarters - Mental (Psychiatric) hospitals or wards (%)
People in Group quarters - Schools, hospitals, or wards for the mentally retarded (%)
People in Group quarters - Schools, hospitals, or wards for the physically handicapped (%)
People in Group quarters - Institutions for the deaf (%)
People in Group quarters - Institutions for the blind (%)
People in Group quarters - Orthopedic wards and institutions for the physically handicapped (%)
People in Group quarters - Wards in general hospitals for patients who have no usual home elsewhere (%)
People in Group quarters - Wards in military hospitals for patients who have no usual home elsewhere (%)
People in Group quarters - Juvenile institutions (%)
People in Group quarters - Long-term care (%)
People in Group quarters - Homes for abused, dependent, and neglected children (%)
People in Group quarters - Residential treatment centers for emotionally disturbed children (%)
People in Group quarters - Training schools for juvenile delinquents (%)
People in Group quarters - Short-term care, detention or diagnostic centers for delinquent children (%)
People in Group quarters - Type of juvenile institution unknown (%)
People in Group quarters - Noninstitutionalized population (%)
People in Group quarters - College dormitories (includes college quarters off campus) (%)
People in Group quarters - Military quarters (%)
People in Group quarters - On base (%)
People in Group quarters - Barracks, unaccompanied personnel housing (UPH), (Enlisted/Officer), ;and similar group living quarters for military personnel (%)
People in Group quarters - Transient quarters for temporary residents (%)
People in Group quarters - Military ships (%)
People in Group quarters - Group homes (%)
People in Group quarters - Homes or halfway houses for drug/alcohol abuse (%)
People in Group quarters - Homes for the mentally ill (%)
People in Group quarters - Homes for the mentally retarded (%)
People in Group quarters - Homes for the physically handicapped (%)
People in Group quarters - Other group homes (%)
People in Group quarters - Religious group quarters (%)
People in Group quarters - Dormitories (%)
People in Group quarters - Agriculture workers' dormitories on farms (%)
People in Group quarters - Job Corps and vocational training facilities (%)
People in Group quarters - Other workers' dormitories (%)
People in Group quarters - Crews of maritime vessels (%)
People in Group quarters - Other nonhousehold living situations (%)
People in Group quarters - Other noninstitutional group quarters (%)
Residents speaking English at home (%)
Residents speaking English at home - Born in the United States (%)
Residents speaking English at home - Native, born elsewhere (%)
Residents speaking English at home - Foreign born (%)
Residents speaking Spanish at home (%)
Residents speaking Spanish at home - Born in the United States (%)
Residents speaking Spanish at home - Native, born elsewhere (%)
Residents speaking Spanish at home - Foreign born (%)
Residents speaking other language at home (%)
Residents speaking other language at home - Born in the United States (%)
Residents speaking other language at home - Native, born elsewhere (%)
Residents speaking other language at home - Foreign born (%)
Class of Workers - Employee of private company (%)
Class of Workers - Self-employed in own incorporated business (%)
Class of Workers - Private not-for-profit wage and salary workers (%)
Class of Workers - Local government workers (%)
Class of Workers - State government workers (%)
Class of Workers - Federal government workers (%)
Class of Workers - Self-employed workers in own not incorporated business and Unpaid family workers (%)
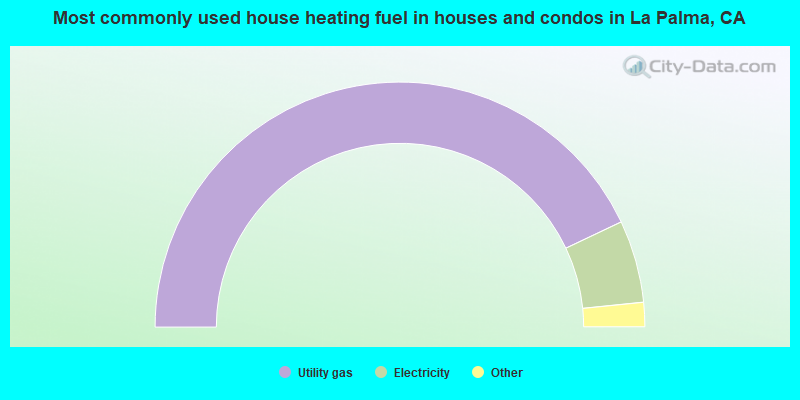
House heating fuel used in houses and condos - Utility gas (%)
House heating fuel used in houses and condos - Bottled, tank, or LP gas (%)
House heating fuel used in houses and condos - Electricity (%)
House heating fuel used in houses and condos - Fuel oil, kerosene, etc. (%)
House heating fuel used in houses and condos - Coal or coke (%)
House heating fuel used in houses and condos - Wood (%)
House heating fuel used in houses and condos - Solar energy (%)
House heating fuel used in houses and condos - Other fuel (%)
House heating fuel used in houses and condos - No fuel used (%)
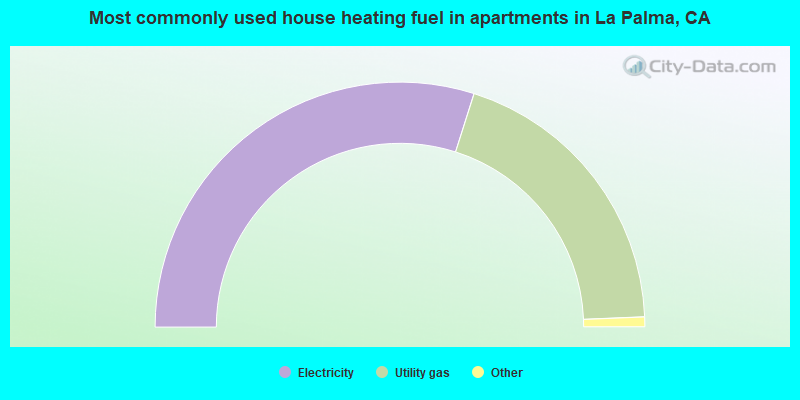
House heating fuel used in apartments - Utility gas (%)
House heating fuel used in apartments - Bottled, tank, or LP gas (%)
House heating fuel used in apartments - Electricity (%)
House heating fuel used in apartments - Fuel oil, kerosene, etc. (%)
House heating fuel used in apartments - Coal or coke (%)
House heating fuel used in apartments - Wood (%)
House heating fuel used in apartments - Solar energy (%)
House heating fuel used in apartments - Other fuel (%)
House heating fuel used in apartments - No fuel used (%)
Armed forces status - In Armed Forces (%)
Armed forces status - Civilian (%)
Armed forces status - Civilian - Veteran (%)
Armed forces status - Civilian - Nonveteran (%)
Fatal accidents locations in years 2005-2021
Fatal accidents locations in 2005
Fatal accidents locations in 2006
Fatal accidents locations in 2007
Fatal accidents locations in 2008
Fatal accidents locations in 2009
Fatal accidents locations in 2010
Fatal accidents locations in 2011
Fatal accidents locations in 2012
Fatal accidents locations in 2013
Fatal accidents locations in 2014
Fatal accidents locations in 2015
Fatal accidents locations in 2016
Fatal accidents locations in 2017
Fatal accidents locations in 2018
Fatal accidents locations in 2019
Fatal accidents locations in 2020
Fatal accidents locations in 2021
Alcohol use - People drinking some alcohol every month (%)
Alcohol use - People not drinking at all (%)
Alcohol use - Average days/month drinking alcohol
Alcohol use - Average drinks/week
Alcohol use - Average days/year people drink much
Audiometry - Average condition of hearing (%)
Audiometry - People that can hear a whisper from across a quiet room (%)
Audiometry - People that can hear normal voice from across a quiet room (%)
Audiometry - Ears ringing, roaring, buzzing (%)
Audiometry - Had a job exposure to loud noise (%)
Audiometry - Had off-work exposure to loud noise (%)
Blood Pressure & Cholesterol - Has high blood pressure (%)
Blood Pressure & Cholesterol - Checking blood pressure at home (%)
Blood Pressure & Cholesterol - Frequently checking blood cholesterol (%)
Blood Pressure & Cholesterol - Has high cholesterol level (%)
Consumer Behavior - Money monthly spent on food at supermarket/grocery store
Consumer Behavior - Money monthly spent on food at other stores
Consumer Behavior - Money monthly spent on eating out
Consumer Behavior - Money monthly spent on carryout/delivered foods
Consumer Behavior - Income spent on food at supermarket/grocery store (%)
Consumer Behavior - Income spent on food at other stores (%)
Consumer Behavior - Income spent on eating out (%)
Consumer Behavior - Income spent on carryout/delivered foods (%)
Current Health Status - General health condition (%)
Current Health Status - Blood donors (%)
Current Health Status - Has blood ever tested for HIV virus (%)
Current Health Status - Left-handed people (%)
Dermatology - People using sunscreen (%)
Diabetes - Diabetics (%)
Diabetes - Had a blood test for high blood sugar (%)
Diabetes - People taking insulin (%)
Diet Behavior & Nutrition - Diet health (%)
Diet Behavior & Nutrition - Milk product consumption (# of products/month)
Diet Behavior & Nutrition - Meals not home prepared (#/week)
Diet Behavior & Nutrition - Meals from fast food or pizza place (#/week)
Diet Behavior & Nutrition - Ready-to-eat foods (#/month)
Diet Behavior & Nutrition - Frozen meals/pizza (#/month)
Drug Use - People that ever used marijuana or hashish (%)
Drug Use - Ever used hard drugs (%)
Drug Use - Ever used any form of cocaine (%)
Drug Use - Ever used heroin (%)
Drug Use - Ever used methamphetamine (%)
Health Insurance - People covered by health insurance (%)
Kidney Conditions-Urology - Avg. # of times urinating at night
Medical Conditions - People with asthma (%)
Medical Conditions - People with anemia (%)
Medical Conditions - People with psoriasis (%)
Medical Conditions - People with overweight (%)
Medical Conditions - Elderly people having difficulties in thinking or remembering (%)
Medical Conditions - People who ever received blood transfusion (%)
Medical Conditions - People having trouble seeing even with glass/contacts (%)
Medical Conditions - People with arthritis (%)
Medical Conditions - People with gout (%)
Medical Conditions - People with congestive heart failure (%)
Medical Conditions - People with coronary heart disease (%)
Medical Conditions - People with angina pectoris (%)
Medical Conditions - People who ever had heart attack (%)
Medical Conditions - People who ever had stroke (%)
Medical Conditions - People with emphysema (%)
Medical Conditions - People with thyroid problem (%)
Medical Conditions - People with chronic bronchitis (%)
Medical Conditions - People with any liver condition (%)
Medical Conditions - People who ever had cancer or malignancy (%)
Mental Health - People who have little interest in doing things (%)
Mental Health - People feeling down, depressed, or hopeless (%)
Mental Health - People who have trouble sleeping or sleeping too much (%)
Mental Health - People feeling tired or having little energy (%)
Mental Health - People with poor appetite or overeating (%)
Mental Health - People feeling bad about themself (%)
Mental Health - People who have trouble concentrating on things (%)
Mental Health - People moving or speaking slowly or too fast (%)
Mental Health - People having thoughts they would be better off dead (%)
Oral Health - Average years since last visit a dentist
Oral Health - People embarrassed because of mouth (%)
Oral Health - People with gum disease (%)
Oral Health - General health of teeth and gums (%)
Oral Health - Average days a week using dental floss/device
Oral Health - Average days a week using mouthwash for dental problem
Oral Health - Average number of teeth
Pesticide Use - Households using pesticides to control insects (%)
Pesticide Use - Households using pesticides to kill weeds (%)
Physical Activity - People doing vigorous-intensity work activities (%)
Physical Activity - People doing moderate-intensity work activities (%)
Physical Activity - People walking or bicycling (%)
Physical Activity - People doing vigorous-intensity recreational activities (%)
Physical Activity - People doing moderate-intensity recreational activities (%)
Physical Activity - Average hours a day doing sedentary activities
Physical Activity - Average hours a day watching TV or videos
Physical Activity - Average hours a day using computer
Physical Functioning - People having limitations keeping them from working (%)
Physical Functioning - People limited in amount of work they can do (%)
Physical Functioning - People that need special equipment to walk (%)
Physical Functioning - People experiencing confusion/memory problems (%)
Physical Functioning - People requiring special healthcare equipment (%)
Prescription Medications - Average number of prescription medicines taking
Preventive Aspirin Use - Adults 40+ taking low-dose aspirin (%)
Reproductive Health - Vaginal deliveries (%)
Reproductive Health - Cesarean deliveries (%)
Reproductive Health - Deliveries resulted in a live birth (%)
Reproductive Health - Pregnancies resulted in a delivery (%)
Reproductive Health - Women breastfeeding newborns (%)
Reproductive Health - Women that had a hysterectomy (%)
Reproductive Health - Women that had both ovaries removed (%)
Reproductive Health - Women that have ever taken birth control pills (%)
Reproductive Health - Women taking birth control pills (%)
Reproductive Health - Women that have ever used Depo-Provera or injectables (%)
Reproductive Health - Women that have ever used female hormones (%)
Sexual Behavior - People 18+ that ever had sex (vaginal, anal, or oral) (%)
Sexual Behavior - Males 18+ that ever had vaginal sex with a woman (%)
Sexual Behavior - Males 18+ that ever performed oral sex on a woman (%)
Sexual Behavior - Males 18+ that ever had anal sex with a woman (%)
Sexual Behavior - Males 18+ that ever had any sex with a man (%)
Sexual Behavior - Females 18+ that ever had vaginal sex with a man (%)
Sexual Behavior - Females 18+ that ever performed oral sex on a man (%)
Sexual Behavior - Females 18+ that ever had anal sex with a man (%)
Sexual Behavior - Females 18+ that ever had any kind of sex with a woman (%)
Sexual Behavior - Average age people first had sex
Sexual Behavior - Average number of female sex partners in lifetime (males 18+)
Sexual Behavior - Average number of female vaginal sex partners in lifetime (males 18+)
Sexual Behavior - Average age people first performed oral sex on a woman (18+)
Sexual Behavior - Average number of woman performed oral sex on in lifetime (18+)
Sexual Behavior - Average number of male sex partners in lifetime (males 18+)
Sexual Behavior - Average number of male anal sex partners in lifetime (males 18+)
Sexual Behavior - Average age people first performed oral sex on a man (18+)
Sexual Behavior - Average number of male oral sex partners in lifetime (18+)
Sexual Behavior - People using protection when performing oral sex (%)
Sexual Behavior - Average number of times people have vaginal or anal sex a year
Sexual Behavior - People having sex without condom (%)
Sexual Behavior - Average number of male sex partners in lifetime (females 18+)
Sexual Behavior - Average number of male vaginal sex partners in lifetime (females 18+)
Sexual Behavior - Average number of female sex partners in lifetime (females 18+)
Sexual Behavior - Circumcised males 18+ (%)
Sleep Disorders - Average hours sleeping at night
Sleep Disorders - People that has trouble sleeping (%)
Smoking-Cigarette Use - People smoking cigarettes (%)
Taste & Smell - People 40+ having problems with smell (%)
Taste & Smell - People 40+ having problems with taste (%)
Taste & Smell - People 40+ that ever had wisdom teeth removed (%)
Taste & Smell - People 40+ that ever had tonsils teeth removed (%)
Taste & Smell - People 40+ that ever had a loss of consciousness because of a head injury (%)
Taste & Smell - People 40+ that ever had a broken nose or other serious injury to face or skull (%)
Taste & Smell - People 40+ that ever had two or more sinus infections (%)
Weight - Average height (inches)
Weight - Average weight (pounds)
Weight - Average BMI
Weight - People that are obese (%)
Weight - People that ever were obese (%)
Weight - People trying to lose weight (%)
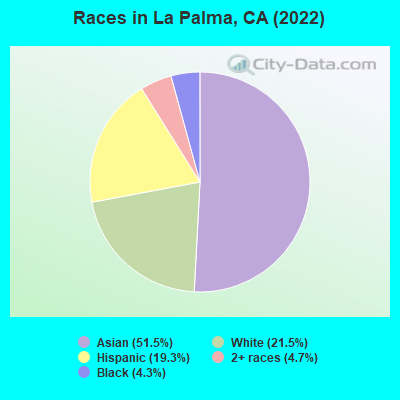
7,927 51.5% Asian alone 3,316 21.5% White alone 2,977 19.3% Hispanic 723 4.7% Two or more races 661 4.3% Black alone 5 0.03% American Indian alone
According to our research of California and other state lists, there were 7 registered sex offenders living in La Palma, California as of April 24, 2024 . The ratio of all residents to sex offenders in La Palma is 2,291 to 1.The ratio of registered sex offenders to all residents in this city is lower than the state average.
Officers per 1,000 residents here:
1.30California average:
2.30
Latest news from La Palma, CA collected exclusively by city-data.com from local newspapers, TV, and radio stations
Ancestries: American (6.2%), English (3.5%), German (2.1%), Italian (1.3%), Portuguese (1.0%).
Current Local Time:
Land area: 1.81 square miles.
Population density: 8,381 people per square mile (high).
5,624 residents are foreign born (29.4% Asia ).
This city:
36.5%California:
26.5%
Median real estate property taxes paid for housing units with mortgages in 2022: $5,705 (0.6%)Median real estate property taxes paid for housing units with no mortgage in 2022: $4,824 (0.5%)
Nearest city with pop. 50,000+: Cerritos, CA
Nearest city with pop. 200,000+: Long Beach, CA
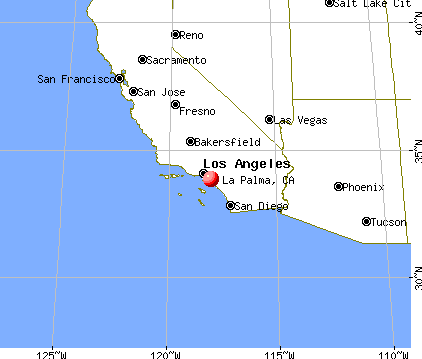
Nearest city with pop. 1,000,000+: Los Angeles, CA
Nearest cities:
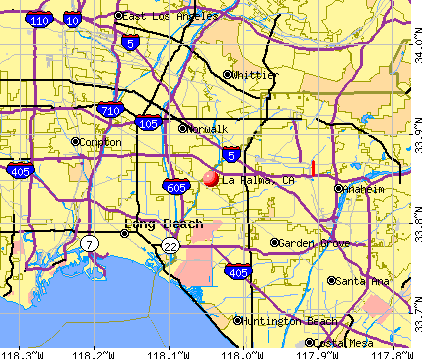
Latitude: 33.85 N, Longitude: 118.04 W
Daytime population change due to commuting: -2,102 (-13.6%)Workers who live and work in this city: 1,172 (15.4%)
Area code commonly used in this area: 714
Single-family new house construction building permits:
2021: 2 buildings , average cost: $400,0002020: 1 building , cost: $45,0002016: 10 buildings , average cost: $356,6002008: 26 buildings , average cost: $155,1002002: 5 buildings , average cost: $209,7001998: 3 buildings , average cost: $193,2001997: 29 buildings , average cost: $242,100Unemployment in December 2023:
Population change in the 1990s: +42 (+0.3%).
Most common occupations in La Palma, CA (%)
Both Males Females
Other office and administrative support workers, including supervisors (5.3%)
Other sales and related occupations, including supervisors (5.2%)
Other management occupations, except farmers and farm managers (5.2%)
Sales representatives, services, wholesale and manufacturing (4.6%)
Engineers (4.5%)
Preschool, kindergarten, elementary, and middle school teachers (3.8%)
Computer specialists (3.7%)
Engineers (8.2%)
Sales representatives, services, wholesale and manufacturing (6.2%)
Other management occupations, except farmers and farm managers (6.1%)
Computer specialists (4.7%)
Other sales and related occupations, including supervisors (4.5%)
Top executives (4.4%)
Electrical equipment mechanics and other installation, maintenance, and repair workers, including supervisors (3.3%)
Other office and administrative support workers, including supervisors (9.6%)
Preschool, kindergarten, elementary, and middle school teachers (6.7%)
Other sales and related occupations, including supervisors (6.0%)
Registered nurses (5.3%)
Other management occupations, except farmers and farm managers (4.1%)
Cashiers (3.9%)
Information and record clerks, except customer service representatives (3.7%)
Earthquake activity:
La Palma-area historical earthquake activity is significantly above California state average. It is 6884% greater than the overall U.S. average. On 7/21/1952 at 11:52:14, a magnitude 7.7 (7.7 UK, Class: Major, Intensity: VIII - XII) earthquake occurred 96.5 miles away from La Palma center, causing $50,000,000 total damage On 6/28/1992 at 11:57:34, a magnitude 7.6 (6.2 MB, 7.6 MS, 7.3 MW, Depth: 0.7 mi) earthquake occurred 89.7 miles away from the city center, causing 3 deaths ( 1 shaking deaths, 2 other deaths) and 400 injuries, causing $100,000,000 total damage and $40,000,000 insured lossesOn 10/16/1999 at 09:46:44, a magnitude 7.4 (6.3 MB, 7.4 MS, 7.2 MW, 7.3 ML) earthquake occurred 102.9 miles away from La Palma center On 11/4/1927 at 13:51:53, a magnitude 7.5 (7.5 UK) earthquake occurred 185.7 miles away from La Palma center On 4/21/1918 at 22:32:30, a magnitude 6.8 (6.8 UK, Class: Strong, Intensity: VII - IX) earthquake occurred 34.8 miles away from the city center On 1/17/1994 at 12:30:55, a magnitude 6.8 (6.4 MB, 6.8 MS, 6.7 MW, Depth: 11.4 mi) earthquake occurred 37.1 miles away from the city center, causing 60 deaths ( 60 shaking deaths) and 7000 injuriesMagnitude types: body-wave magnitude (MB), local magnitude (ML), surface-wave magnitude (MS), moment magnitude (MW) Natural disasters: The number of natural disasters in Orange County (32) is a lot greater than the US average (15).Major Disasters (Presidential) Declared: 22Emergencies Declared: 2Floods: 15, Fires: 13, Storms: 9, Landslides: 6, Winter Storms: 6, Mudslides: 5, Earthquakes: 2, Heavy Rain: 1, Hurricane: 1, Snow: 1, Tornado: 1, Wind: 1, Other: 1 (Note: some incidents may be assigned to more than one category). Hospitals and medical centers in La Palma: LA PALMA INTERCOMMUNITY HOSPITAL (Proprietary, provides emergency services, 7901 WALKER STREET) LA PALMA DIALYSIS CENTER, LLC (5451 LA PALMA AVENUE, SUITE 35)
EMC HOME HEALTH PROVIDERS, INC (7851 WALKER STREET, SUITE 108)
Amtrak stations near La Palma: 8 miles: FULLERTON (120 E. SANTA FE AVE.) Services: ticket office, fully wheelchair accessible, enclosed waiting area, public restrooms, public payphones, full-service food facilities, free short-term parking, paid long-term parking, taxi stand, public transit connection.
10 miles: ANAHEIM (2150 KATELLA AVE.) Services: ticket office, fully wheelchair accessible, enclosed waiting area, public restrooms, public payphones, vending machines, free short-term parking, free long-term parking, call for car rental service, call for taxi service.
10 miles: LONG BEACH (601 N. LONG BEACH BLVD.) - Bus Station Services: fully wheelchair accessible, public restrooms, public payphones, full-service food facilities, paid short-term parking, paid long-term parking, call for taxi service, public transit connection.
Colleges/universities with over 2000 students nearest to La Palma:
Cypress College (about 2 miles; Cypress, CA ; Full-time enrollment: 8,732)
Trident University International (about 4 miles; Cypress, CA ; FT enrollment: 5,974)
Cerritos College (about 4 miles; Norwalk, CA ; FT enrollment: 13,090)
Biola University (about 5 miles; La Mirada, CA ; FT enrollment: 5,325)
Long Beach City College (about 6 miles; Long Beach, CA ; FT enrollment: 15,602)
California State University-Long Beach (about 7 miles; Long Beach, CA ; FT enrollment: 28,287)
Fullerton College (about 8 miles; Fullerton, CA ; FT enrollment: 11,124)
Public high school in La Palma:
Private high schools in La Palma: LA PALMA CHRISTIAN Students: 143, Location: 8082 WALKER ST, Grades: PK-10)
BEACON DAY SCHOOL Students: 38, Location: 24 CENTERPOINTE DR, Grades: UG-12)
Public elementary/middle schools in La Palma:
See full list of schools located in La Palma Birthplace of: Nathan Baesel - Actor.
Orange County has a predicted average indoor radon screening level less than 2 pCi/L (pico curies per liter) - Low Potential Average household size: This city:
3.1 peopleCalifornia:
2.9 people
Percentage of family households: This city:
82.9%Whole state:
68.7%
Percentage of households with unmarried partners: This city:
3.1%Whole state:
7.2%
Likely homosexual households (counted as self-reported same-sex unmarried-partner households)
Lesbian couples: 0.3% of all households Gay men: 0.3% of all households
14 people in workers' group living quarters and job corps centers in 2010people in group homes for juveniles (non-correctional) in 2010people in mental (psychiatric) hospitals or wards in 2000people in unknown juvenile institutions in 2000
Banks with branches in La Palma (2011 data):
BBCN Bank: Cerritos Branch at 4875 La Palma Avenue, branch established on 2001/09/14. Info updated 2011/12/12: Bank assets: $5,170.7 mil, Deposits: $3,989.4 mil, headquarters in Los Angeles, CA, positive income , Commercial Lending Specialization, 49 total offices , Holding Company: Bbcn Bancorp, Inc.
California Bank & Trust: La Palma Branch at 5471 Orangethorpe Avenue, branch established on 1981/08/26. Info updated 2009/07/20: Bank assets: $10,894.1 mil, Deposits: $9,193.9 mil, headquarters in San Diego, CA, positive income , Commercial Lending Specialization, 109 total offices , Holding Company: Zions Bancorporation
City National Bank: La Palma Branch at One Centerpointe Drive, branch established on 1983/05/09. Info updated 2011/04/11: Bank assets: $23,303.6 mil, Deposits: $20,475.9 mil, headquarters in Los Angeles, CA, positive income , Commercial Lending Specialization, 86 total offices , Holding Company: City National Corporation
Bank of America, National Association: La Palma Branch at 5531 La Palma Avenue, branch established on 1967/09/07. Info updated 2009/11/18: Bank assets: $1,451,969.3 mil, Deposits: $1,077,176.8 mil, headquarters in Charlotte, NC, positive income , 5782 total offices , Holding Company: Bank Of America Corporation
For population 15 years and over in La Palma:
Never married: 29.2%Now married: 55.3%Separated: 1.1%Widowed: 7.3%Divorced: 7.0% For population 25 years and over in La Palma:
High school or higher: 95.3%Bachelor's degree or higher: 50.3%Graduate or professional degree: 17.5%Unemployed: 5.2%Mean travel time to work (commute): 28.8 minutes
Education Gini index (Inequality in education) Here:
9.9California average:
15.5
Religion statistics for La Palma, CA (based on Orange County data)
Religion Adherents Congregations Catholic 797,473 67 Evangelical Protestant 345,893 894 Other 141,815 329 Mainline Protestant 76,574 202 Orthodox 13,406 19 Black Protestant 2,424 8 None 1,632,647 -
Source: Clifford Grammich, Kirk Hadaway, Richard Houseal, Dale E.Jones, Alexei Krindatch, Richie Stanley and Richard H.Taylor. 2012. 2010 U.S.Religion Census: Religious Congregations & Membership Study. Association of Statisticians of American Religious Bodies. Jones, Dale E., et al. 2002. Congregations and Membership in the United States 2000. Nashville, TN: Glenmary Research Center. Graphs represent county-level data
Food Environment Statistics: Number of grocery stores : 530This county :
1.78 / 10,000 pop.California :
2.14 / 10,000 pop.
Number of supercenters and club stores : 18Orange County :
0.06 / 10,000 pop.State :
0.04 / 10,000 pop.
Number of convenience stores (no gas) : 147Here :
0.49 / 10,000 pop.State :
0.62 / 10,000 pop.
Number of convenience stores (with gas) : 434Orange County :
1.46 / 10,000 pop.California :
1.49 / 10,000 pop.
Number of full-service restaurants : 2,438This county :
8.19 / 10,000 pop.State :
7.42 / 10,000 pop.
Adult diabetes rate : This county :
6.3%California :
7.3%
Adult obesity rate : Orange County :
18.5%California :
21.3%
Low-income preschool obesity rate : Orange County :
16.4%State :
17.9%
Health and Nutrition: Healthy diet rate : La Palma:
55.7%California:
49.4%
Average overall health of teeth and gums : This city:
51.6%California:
48.0%
Average BMI : La Palma:
26.7California:
28.1
People feeling badly about themselves : This city:
16.3%State:
20.2%
People not drinking alcohol at all : This city:
16.8%State:
11.2%
Average hours sleeping at night : This city:
6.8California:
6.8
Overweight people : Here:
27.2%California:
31.5%
General health condition : La Palma:
59.0%State:
56.4%
Average condition of hearing : La Palma:
81.9%State:
80.9%
More about Health and Nutrition of La Palma, CA Residents
Local government employment and payroll (March 2022)
Function
Full-time employees
Monthly full-time payroll
Average yearly full-time wage
Part-time employees
Monthly part-time payroll
Police Protection - Officers
19 $201,420 $127,213 0 $0 Police - Other
7 $41,990 $71,983 8 $14,915 Parks and Recreation
6 $39,525 $79,050 18 $20,340 Water Supply
5 $35,497 $85,193 0 $0 Other Government Administration
4 $39,022 $117,066 5 $3,321 Streets and Highways
3 $14,654 $58,616 0 $0 Financial Administration
2 $20,137 $120,822 0 $0 Housing and Community Development (Local)
2 $15,584 $93,504 0 $0
Totals for Government
48 $407,829 $101,957 31 $38,577
La Palma government finances - Expenditure in 2017 (per resident):
Construction - Regular Highways: $1,825,000 ($120.11)
Water Utilities: $213,000 ($14.02)Current Operations - Central Staff Services: $6,356,000 ($418.32)
Police Protection: $4,522,000 ($297.62)Water Utilities: $3,039,000 ($200.01)Parks and Recreation: $986,000 ($64.89)Regular Highways: $735,000 ($48.37)Financial Administration: $548,000 ($36.07)Sewerage: $474,000 ($31.20)Protective Inspection and Regulation - Other: $235,000 ($15.47)Housing and Community Development: $231,000 ($15.20)General - Interest on Debt: $281,000 ($18.49)
Other Capital Outlay - Regular Highways: $42,000 ($2.76)
Parks and Recreation: $23,000 ($1.51)Police Protection: $1,000 ($0.07)
La Palma government finances - Revenue in 2017 (per resident):
Charges - Other: $480,000 ($31.59)
Sewerage: $274,000 ($18.03)Parks and Recreation: $274,000 ($18.03)Federal Intergovernmental - Other: $630,000 ($41.46)
Housing and Community Development: $180,000 ($11.85)Local Intergovernmental - Other: $283,000 ($18.63)
Miscellaneous - Rents: $285,000 ($18.76)
Interest Earnings: $202,000 ($13.29)General Revenue - Other: $173,000 ($11.39)Fines and Forfeits: $95,000 ($6.25)Donations From Private Sources: $17,000 ($1.12)Revenue - Water Utilities: $2,735,000 ($180.01)
State Intergovernmental - Other: $496,000 ($32.64)
Highways: $314,000 ($20.67)General Local Government Support: $12,000 ($0.79)Tax - Property: $3,769,000 ($248.06)
General Sales and Gross Receipts: $3,402,000 ($223.90)Public Utilities Sales: $1,404,000 ($92.40)Other Selective Sales: $378,000 ($24.88)Other License: $260,000 ($17.11)Occupation and Business License - Other: $233,000 ($15.34)Other: $55,000 ($3.62)Documentary and Stock Transfer: $47,000 ($3.09)
La Palma government finances - Debt in 2017 (per resident):
Long Term Debt - Beginning Outstanding - Unspecified Public Purpose: $7,028,000 ($462.55)
Outstanding Unspecified Public Purpose: $6,538,000 ($430.30)Retired Unspecified Public Purpose: $490,000 ($32.25)
La Palma government finances - Cash and Securities in 2017 (per resident):
Bond Funds - Cash and Securities: $5,562,000 ($366.07)
Other Funds - Cash and Securities: $27,116,000 ($1784.65)
4.86% of this county's 2021 resident taxpayers lived in other counties in 2020 ($95,983 average adjusted gross income )
Here:
4.86%California average:
5.19%
0.01% of residents moved from foreign countries ($132 average AGI )Orange County:
0.01%California average:
0.03%
Top counties from which taxpayers relocated into this county between 2020 and 2021:
5.71% of this county's 2020 resident taxpayers moved to other counties in 2021 ($106,828 average adjusted gross income )
Here:
5.71%California average:
6.14%
0.01% of residents moved to foreign countries ($180 average AGI )Orange County:
0.01%California average:
0.02%
Top counties to which taxpayers relocated from this county between 2020 and 2021:
Businesses in La Palma, CA
Name Count Name Count
7-Eleven 2 La Quinta 1 Carl\s Jr. 1 McDonald's 1 FedEx 3 Quiznos 1 Jones New York 1 UPS 1 Kroger 1 Walgreens 1
Strongest AM radio stations in La Palma:
KFI (640 AM; 50 kW; LOS ANGELES, CA; Owner: CAPSTAR TX LIMITED PARTNERSHIP)
KTNQ (1020 AM; 50 kW; LOS ANGELES, CA; Owner: KTNQ-AM LICENSE CORP.)
KXTA (1150 AM; 50 kW; LOS ANGELES, CA; Owner: CITICASTERS LICENSES, L.P.)
KLAC (570 AM; 50 kW; LOS ANGELES, CA; Owner: AMFM RADIO LICENSES, L.L.C.)
KFWB (980 AM; 50 kW; LOS ANGELES, CA; Owner: INFINITY BROADCASTING OPERATIONS, INC.)
KNX (1070 AM; 50 kW; LOS ANGELES, CA; Owner: INFINITY BROADCASTING OPERATIONS, INC.)
KDIS (1110 AM; 50 kW; PASADENA, CA; Owner: ABC,INC.)
KMPC (1540 AM; 50 kW; LOS ANGELES, CA; Owner: ROSE CITY RADIO CORPORATION)
KPLS (830 AM; 50 kW; ORANGE, CA; Owner: CRN LICENSES, LLC)
KBLA (1580 AM; 50 kW; SANTA MONICA, CA)
KSPN (710 AM; 50 kW; LOS ANGELES, CA; Owner: KABC-AM RADIO, INC.)
KXMX (1190 AM; 25 kW; ANAHEIM, CA; Owner: NEW INSPIRATION BROADCASTING COMPANY)
KLTX (1390 AM; 5 kW; LONG BEACH, CA; Owner: HI-FAVOR BROADCASTING, LLC)
Strongest FM radio stations in La Palma:
KZLA-FM (93.9 FM; LOS ANGELES, CA; Owner: EMMIS RADIO LICENSE CORPORATION)
KPWR (105.9 FM; LOS ANGELES, CA; Owner: EMMIS RADIO LICENSE CORPORATION)
KLSX (97.1 FM; LOS ANGELES, CA; Owner: INFINITY BROADCASTING OPERATIONS, INC.)
KCBS-FM (93.1 FM; LOS ANGELES, CA; Owner: INFINITY BROADCASTING OPERATIONS, INC.)
KUSC (91.5 FM; LOS ANGELES, CA; Owner: UNIVERSITY OF SOUTHERN CALIFORNIA)
KKLA-FM (99.5 FM; LOS ANGELES, CA; Owner: NEW INSPIRATION BROADCASTING CO., INC.)
KSCA (101.9 FM; GLENDALE, CA; Owner: HBC LICENSE CORPORATION)
KLOS (95.5 FM; LOS ANGELES, CA; Owner: KLOS-FM RADIO, INC.)
K212FA (90.3 FM; TEMPLE CITY, CA; Owner: EDUCATIONAL MEDIA FOUNDATION)
KOST (103.5 FM; LOS ANGELES, CA; Owner: CAPSTAR TX LIMITED PARTNERSHIP)
KLAX-FM (97.9 FM; EAST LOS ANGELES, CA; Owner: KLAX LICENSING, INC.)
KRTH-FM (101.1 FM; LOS ANGELES, CA; Owner: INFINITY BROADCASTING OPERATIONS, INC.)
KIIS-FM (102.7 FM; LOS ANGELES, CA; Owner: CITICASTERS LICENSES, L.P.)
KLVE (107.5 FM; LOS ANGELES, CA; Owner: KLVE-FM LICENSE CORP.)
KPCC (89.3 FM; PASADENA, CA; Owner: PASADENA AREA COMMUNITY COLLEGE DISTRICT)
KHHT (92.3 FM; LOS ANGELES, CA; Owner: AMFM RADIO LICENSES, L.L.C.)
KBIG-FM (104.3 FM; LOS ANGELES, CA; Owner: AMFM RADIO LICENSES, L.L.C.)
KMZT-FM (105.1 FM; LOS ANGELES, CA; Owner: MOUNT WILSON FM BROADCASTERS, INC.)
KTWV (94.7 FM; LOS ANGELES, CA; Owner: INFINITY BROADCASTING OPERATIONS, INC.)
KPFK (90.7 FM; LOS ANGELES, CA; Owner: PACIFICA FOUNDATION, INC)
TV broadcast stations around La Palma:
KTRO-LP (Channel 50; LANCASTER, CA; Owner: ROBERT D. ADELMAN)
KCBS-TV (Channel 2; LOS ANGELES, CA; Owner: CBS BROADCASTING INC.)
KTLA-TV (Channel 5; LOS ANGELES, CA; Owner: KTLA INC.)
KABC-TV (Channel 7; LOS ANGELES, CA; Owner: ABC HOLDING COMPANY, INC.)
KCAL-TV (Channel 9; LOS ANGELES, CA; Owner: VIACOM TELEVISION STATIONS GROUP OF LOS ANGELES LLC)
KNBC (Channel 4; LOS ANGELES, CA; Owner: NBC SUBSIDIARY (KNBC-TV), INC.)
KMEX-TV (Channel 34; LOS ANGELES, CA; Owner: KMEX LICENSE PARTNERSHIP, G.P.)
KAZA-TV (Channel 54; AVALON, CA; Owner: PAPPAS SOUTHERN CALIFORNIA LICENSE LLC)
KDOC-TV (Channel 56; ANAHEIM, CA; Owner: GOLDEN ORANGE BROADCASTING CO., INC.)
KOCE-TV (Channel 50; HUNTINGTON BEACH, CA; Owner: BD. OF TRUSTEES, COAST COMMUNITY COLLEGE DIST.)
KSCI (Channel 18; LONG BEACH, CA; Owner: KSLS, INC.)
FCC Registered Antenna Towers: 6
Carl E Manson, 8082 Walker Street (Lat: 33.845194 Lon: -118.036944), Type: 18.3, Structure height: 06059 m, Overall height: 18.3 m, Registrant: Los Angeles Smsa Limited Partnership, Network.Regulatory@verizonwireless.Com, Mc: Gasa5reg, Alpha-retta, Phone: (770) 797-1070 Mikhail Raznobriadsev, 8082 Walker Street (Lat: 33.845194 Lon: -118.036944), Type: 18.3, Structure height: 06059 m, Overall height: 18.3 m, Registrant: Los Angeles Smsa Limited Partnership, Network.Regulatory@verizonwireless.Com, Mc: Gasa5reg, Alpha-retta, Phone: (770) 797-1070 Sharon Yeager, 8082 Walker Street (Lat: 33.845194 Lon: -118.036944), Type: 18.3, Structure height: 06059 m, Overall height: 18.3 m, Registrant: Los Angeles Smsa Limited Partnership, Network.Regulatory@verizonwireless.Com, Mc: Gasa5reg, Alpha-retta, Phone: (770) 797-1070 Regulatory Manager, 8082 Walker Street (Lat: 33.845194 Lon: -118.036944), Type: 18.3, Structure height: 06059 m, Overall height: 18.3 m, Registrant: Los Angeles Smsa Limited Partnership, Network.Regulatory@verizonwireless.Com, Mc: Gasa5reg, Alpha-retta, Phone: (770) 797-1070 Regulatory Manager, 8082 Walker Street (Lat: 33.845194 Lon: -118.036944), Type: 18.3, Structure height: 06059 m, Overall height: 18.3 m, Registrant: Verizon Wireless, Network.Regulatory@verizonwireless.Com, Mc: Gasa5reg, Alpha-retta, Phone: (770) 797-1070 Gina Cacciatore, 8082 Walker Street (Lat: 33.845194 Lon: -118.036944), Type: 18.3, Structure height: 06059 m, Overall height: 18.3 m, Registrant: Los Angeles Smsa Limited Partnership, Network.Regulatory@verizonwireless.Com, #150 Mcgasa5reg, Alpha-retta, Phone: (770) 797-1070 FCC Registered Broadcast Land Mobile Towers: 8 (
See the full list of FCC Registered Broadcast Land Mobile Towers in La Palma, CA )
FCC Registered Microwave Towers: 12 (
See the full list of FCC Registered Microwave Towers in this town )
FCC Registered Paging Towers: 1 (
See the full list of FCC Registered Paging Towers )
FCC Registered Amateur Radio Licenses: 138 (
See the full list of FCC Registered Amateur Radio Licenses in La Palma )
FAA Registered Aircraft: 10 (
See the full list of FAA Registered Aircraft in La Palma )
Home Mortgage Disclosure Act Aggregated Statistics For Year 2009(Based on 2 full and 3 partial tracts) A) FHA, FSA/RHS & VA B) Conventional C) Refinancings D) Home Improvement Loans F) Non-occupant Loans on G) Loans On Manufactured Number Average Value Number Average Value Number Average Value Number Average Value Number Average Value Number Average Value
LOANS ORIGINATED 14 $446,541 55 $329,258 377 $307,729 17 $214,933 10 $225,030 1 $295,640 APPLICATIONS APPROVED, NOT ACCEPTED 0 $0 10 $318,072 31 $326,399 3 $44,713 4 $390,945 0 $0 APPLICATIONS DENIED 1 $593,580 8 $303,656 90 $339,229 7 $134,979 4 $311,725 0 $0 APPLICATIONS WITHDRAWN 2 $373,220 10 $315,803 65 $327,796 2 $225,760 6 $288,542 0 $0 FILES CLOSED FOR INCOMPLETENESS 0 $0 4 $308,800 19 $405,810 0 $0 3 $342,080 0 $0
Aggregated Statistics For Year 2008(Based on 2 full and 3 partial tracts) A) FHA, FSA/RHS & VA B) Conventional C) Refinancings D) Home Improvement Loans E) Loans on Dwellings For 5+ Families F) Non-occupant Loans on Number Average Value Number Average Value Number Average Value Number Average Value Number Average Value Number Average Value
LOANS ORIGINATED 10 $443,264 77 $332,695 141 $312,045 25 $164,260 1 $6,837,770 4 $239,972 APPLICATIONS APPROVED, NOT ACCEPTED 1 $625,000 12 $398,743 37 $336,760 5 $167,334 0 $0 0 $0 APPLICATIONS DENIED 0 $0 22 $373,456 92 $384,796 11 $160,715 0 $0 2 $459,010 APPLICATIONS WITHDRAWN 0 $0 17 $392,846 53 $323,315 6 $121,542 0 $0 2 $307,445 FILES CLOSED FOR INCOMPLETENESS 2 $536,390 2 $405,660 12 $320,595 2 $264,715 0 $0 1 $314,420
Aggregated Statistics For Year 2007(Based on 2 full and 3 partial tracts) A) FHA, FSA/RHS & VA B) Conventional C) Refinancings D) Home Improvement Loans F) Non-occupant Loans on G) Loans On Manufactured Number Average Value Number Average Value Number Average Value Number Average Value Number Average Value Number Average Value
LOANS ORIGINATED 1 $343,790 113 $366,629 283 $340,293 36 $155,899 11 $282,841 1 $94,720 APPLICATIONS APPROVED, NOT ACCEPTED 0 $0 37 $343,861 59 $363,814 12 $196,514 3 $363,503 2 $87,110 APPLICATIONS DENIED 0 $0 44 $392,807 120 $423,078 20 $251,366 6 $480,703 0 $0 APPLICATIONS WITHDRAWN 0 $0 25 $351,336 68 $382,095 8 $262,554 2 $299,250 0 $0 FILES CLOSED FOR INCOMPLETENESS 0 $0 5 $432,844 19 $411,338 2 $505,190 2 $312,500 0 $0
Aggregated Statistics For Year 2006(Based on 2 full and 3 partial tracts) B) Conventional C) Refinancings D) Home Improvement Loans E) Loans on Dwellings For 5+ Families F) Non-occupant Loans on Number Average Value Number Average Value Number Average Value Number Average Value Number Average Value
LOANS ORIGINATED 142 $377,192 374 $355,235 53 $234,385 2 $612,410 19 $317,635 APPLICATIONS APPROVED, NOT ACCEPTED 28 $322,311 71 $374,671 4 $414,688 0 $0 5 $314,598 APPLICATIONS DENIED 43 $375,633 143 $418,567 20 $207,245 0 $0 5 $461,614 APPLICATIONS WITHDRAWN 20 $325,803 110 $348,421 18 $279,350 0 $0 2 $327,035 FILES CLOSED FOR INCOMPLETENESS 5 $318,670 28 $356,884 2 $171,455 0 $0 0 $0
Aggregated Statistics For Year 2005(Based on 2 full and 3 partial tracts) B) Conventional C) Refinancings D) Home Improvement Loans E) Loans on Dwellings For 5+ Families F) Non-occupant Loans on G) Loans On Manufactured Number Average Value Number Average Value Number Average Value Number Average Value Number Average Value Number Average Value
LOANS ORIGINATED 214 $359,746 458 $332,400 74 $207,641 2 $1,959,705 29 $307,744 1 $57,940 APPLICATIONS APPROVED, NOT ACCEPTED 49 $331,302 70 $336,823 5 $250,360 0 $0 6 $345,140 1 $135,000 APPLICATIONS DENIED 56 $361,459 178 $358,463 31 $200,297 0 $0 15 $343,641 1 $219,000 APPLICATIONS WITHDRAWN 36 $329,591 131 $359,560 16 $161,223 0 $0 4 $314,905 0 $0 FILES CLOSED FOR INCOMPLETENESS 8 $381,241 49 $345,212 1 $106,110 0 $0 2 $299,285 0 $0
Aggregated Statistics For Year 2004(Based on 2 full and 3 partial tracts) A) FHA, FSA/RHS & VA B) Conventional C) Refinancings D) Home Improvement Loans F) Non-occupant Loans on G) Loans On Manufactured Number Average Value Number Average Value Number Average Value Number Average Value Number Average Value Number Average Value
LOANS ORIGINATED 2 $255,980 206 $320,706 571 $277,470 64 $199,079 34 $271,036 0 $0 APPLICATIONS APPROVED, NOT ACCEPTED 0 $0 32 $310,729 89 $292,997 8 $123,438 3 $170,570 0 $0 APPLICATIONS DENIED 0 $0 43 $330,153 151 $298,795 27 $157,187 9 $215,576 2 $69,565 APPLICATIONS WITHDRAWN 0 $0 28 $294,178 164 $275,879 21 $180,146 5 $303,996 0 $0 FILES CLOSED FOR INCOMPLETENESS 0 $0 10 $255,125 46 $276,312 3 $153,407 2 $179,435 0 $0
Aggregated Statistics For Year 2003(Based on 2 full and 3 partial tracts) A) FHA, FSA/RHS & VA B) Conventional C) Refinancings D) Home Improvement Loans F) Non-occupant Loans on Number Average Value Number Average Value Number Average Value Number Average Value Number Average Value
LOANS ORIGINATED 8 $224,796 262 $262,383 1,361 $219,778 32 $58,608 47 $204,979 APPLICATIONS APPROVED, NOT ACCEPTED 1 $58,510 26 $283,694 166 $226,926 7 $56,743 15 $207,169 APPLICATIONS DENIED 2 $130,220 41 $260,608 192 $231,945 12 $95,939 12 $224,672 APPLICATIONS WITHDRAWN 0 $0 30 $275,825 211 $234,780 6 $97,503 6 $233,435 FILES CLOSED FOR INCOMPLETENESS 0 $0 8 $271,104 41 $238,811 2 $40,460 2 $235,905
Aggregated Statistics For Year 2002(Based on 2 full and 3 partial tracts) A) FHA, FSA/RHS & VA B) Conventional C) Refinancings D) Home Improvement Loans E) Loans on Dwellings For 5+ Families F) Non-occupant Loans on Number Average Value Number Average Value Number Average Value Number Average Value Number Average Value Number Average Value
LOANS ORIGINATED 6 $210,868 230 $225,121 882 $206,442 18 $81,044 1 $2,787,510 36 $176,304 APPLICATIONS APPROVED, NOT ACCEPTED 0 $0 20 $247,044 117 $208,863 8 $34,296 0 $0 4 $167,715 APPLICATIONS DENIED 0 $0 26 $225,041 159 $204,881 17 $43,522 0 $0 8 $166,196 APPLICATIONS WITHDRAWN 1 $169,460 28 $206,145 147 $210,370 5 $86,378 0 $0 3 $193,640 FILES CLOSED FOR INCOMPLETENESS 0 $0 8 $236,091 73 $249,435 0 $0 0 $0 4 $223,855
Aggregated Statistics For Year 2001(Based on 2 full and 3 partial tracts) A) FHA, FSA/RHS & VA B) Conventional C) Refinancings D) Home Improvement Loans F) Non-occupant Loans on Number Average Value Number Average Value Number Average Value Number Average Value Number Average Value
LOANS ORIGINATED 23 $194,267 221 $199,362 562 $193,702 25 $44,039 24 $176,739 APPLICATIONS APPROVED, NOT ACCEPTED 2 $289,510 26 $212,825 104 $197,535 6 $67,715 1 $106,800 APPLICATIONS DENIED 0 $0 28 $184,614 143 $192,051 19 $36,408 3 $159,903 APPLICATIONS WITHDRAWN 3 $210,950 15 $173,913 118 $187,927 7 $21,901 5 $157,060 FILES CLOSED FOR INCOMPLETENESS 0 $0 8 $166,974 44 $214,601 0 $0 0 $0
Aggregated Statistics For Year 2000(Based on 2 full and 3 partial tracts) A) FHA, FSA/RHS & VA B) Conventional C) Refinancings D) Home Improvement Loans F) Non-occupant Loans on Number Average Value Number Average Value Number Average Value Number Average Value Number Average Value
LOANS ORIGINATED 11 $178,982 204 $184,930 133 $144,445 29 $40,551 11 $147,408 APPLICATIONS APPROVED, NOT ACCEPTED 1 $157,850 16 $194,743 28 $172,361 9 $28,362 1 $84,780 APPLICATIONS DENIED 3 $137,020 24 $203,390 74 $164,999 19 $30,893 3 $57,850 APPLICATIONS WITHDRAWN 3 $143,000 26 $195,598 49 $140,419 4 $62,622 1 $176,720 FILES CLOSED FOR INCOMPLETENESS 1 $364,280 9 $205,639 19 $196,913 1 $56,010 0 $0
Aggregated Statistics For Year 1999(Based on 4 partial tracts) A) FHA, FSA/RHS & VA B) Conventional C) Refinancings D) Home Improvement Loans E) Loans on Dwellings For 5+ Families F) Non-occupant Loans on Number Average Value Number Average Value Number Average Value Number Average Value Number Average Value Number Average Value
LOANS ORIGINATED 7 $160,580 169 $229,538 277 $150,874 32 $38,792 0 $0 17 $131,640 APPLICATIONS APPROVED, NOT ACCEPTED 3 $149,030 13 $211,920 48 $192,311 17 $28,768 0 $0 4 $166,118 APPLICATIONS DENIED 3 $172,500 16 $181,012 94 $171,284 14 $41,180 0 $0 2 $189,880 APPLICATIONS WITHDRAWN 1 $56,600 31 $145,884 62 $148,451 4 $30,082 1 $15,152,810 4 $140,382 FILES CLOSED FOR INCOMPLETENESS 1 $133,270 5 $169,544 25 $190,886 1 $14,140 0 $0 1 $35,160
Detailed HMDA statistics for the following Tracts:
1101.02
, 1101.15 , 1101.16 , 1103.01 , 1103.04
Private Mortgage Insurance Companies Aggregated Statistics For Year 2009(Based on 2 full and 3 partial tracts) A) Conventional B) Refinancings Number Average Value Number Average Value
LOANS ORIGINATED 8 $378,746 0 $0 APPLICATIONS APPROVED, NOT ACCEPTED 1 $475,740 1 $242,950 APPLICATIONS DENIED 0 $0 1 $493,110 APPLICATIONS WITHDRAWN 1 $493,600 1 $292,270 FILES CLOSED FOR INCOMPLETENESS 0 $0 0 $0
Aggregated Statistics For Year 2008(Based on 2 full and 3 partial tracts) A) Conventional B) Refinancings Number Average Value Number Average Value
LOANS ORIGINATED 11 $406,927 1 $496,060 APPLICATIONS APPROVED, NOT ACCEPTED 3 $335,007 3 $457,493 APPLICATIONS DENIED 0 $0 1 $630,040 APPLICATIONS WITHDRAWN 0 $0 0 $0 FILES CLOSED FOR INCOMPLETENESS 0 $0 0 $0
Aggregated Statistics For Year 2007(Based on 2 full and 3 partial tracts) A) Conventional B) Refinancings Number Average Value Number Average Value
LOANS ORIGINATED 6 $448,910 3 $466,657 APPLICATIONS APPROVED, NOT ACCEPTED 0 $0 0 $0 APPLICATIONS DENIED 0 $0 0 $0 APPLICATIONS WITHDRAWN 0 $0 1 $374,510 FILES CLOSED FOR INCOMPLETENESS 0 $0 0 $0
Aggregated Statistics For Year 2006(Based on 3 partial tracts) B) Refinancings Number Average Value
LOANS ORIGINATED 3 $481,910 APPLICATIONS APPROVED, NOT ACCEPTED 0 $0 APPLICATIONS DENIED 0 $0 APPLICATIONS WITHDRAWN 0 $0 FILES CLOSED FOR INCOMPLETENESS 0 $0
Aggregated Statistics For Year 2005(Based on 2 full and 3 partial tracts) A) Conventional B) Refinancings C) Non-occupant Loans on Number Average Value Number Average Value Number Average Value
LOANS ORIGINATED 2 $408,985 6 $383,425 1 $352,080 APPLICATIONS APPROVED, NOT ACCEPTED 1 $600,480 1 $366,880 0 $0 APPLICATIONS DENIED 0 $0 0 $0 0 $0 APPLICATIONS WITHDRAWN 0 $0 0 $0 0 $0 FILES CLOSED FOR INCOMPLETENESS 0 $0 0 $0 0 $0
Aggregated Statistics For Year 2004(Based on 2 full and 3 partial tracts) A) Conventional B) Refinancings Number Average Value Number Average Value
LOANS ORIGINATED 7 $416,200 3 $384,670 APPLICATIONS APPROVED, NOT ACCEPTED 1 $379,570 3 $272,920 APPLICATIONS DENIED 0 $0 0 $0 APPLICATIONS WITHDRAWN 1 $440,000 1 $342,870 FILES CLOSED FOR INCOMPLETENESS 0 $0 0 $0
Aggregated Statistics For Year 2003(Based on 2 full and 3 partial tracts) A) Conventional B) Refinancings C) Non-occupant Loans on Number Average Value Number Average Value Number Average Value
LOANS ORIGINATED 22 $339,516 12 $270,919 2 $212,730 APPLICATIONS APPROVED, NOT ACCEPTED 8 $286,024 11 $326,268 1 $220,470 APPLICATIONS DENIED 1 $137,690 0 $0 1 $137,690 APPLICATIONS WITHDRAWN 5 $383,000 1 $330,980 0 $0 FILES CLOSED FOR INCOMPLETENESS 0 $0 1 $432,000 0 $0
Aggregated Statistics For Year 2002(Based on 2 full and 3 partial tracts) A) Conventional B) Refinancings C) Non-occupant Loans on Number Average Value Number Average Value Number Average Value
LOANS ORIGINATED 29 $298,678 13 $247,053 1 $273,890 APPLICATIONS APPROVED, NOT ACCEPTED 9 $313,086 8 $254,685 0 $0 APPLICATIONS DENIED 0 $0 0 $0 0 $0 APPLICATIONS WITHDRAWN 4 $312,578 3 $294,457 2 $229,935 FILES CLOSED FOR INCOMPLETENESS 0 $0 0 $0 0 $0
Aggregated Statistics For Year 2001(Based on 2 full and 3 partial tracts) A) Conventional B) Refinancings C) Non-occupant Loans on Number Average Value Number Average Value Number Average Value
LOANS ORIGINATED 30 $236,410 16 $240,771 1 $144,870 APPLICATIONS APPROVED, NOT ACCEPTED 9 $260,118 10 $237,956 0 $0 APPLICATIONS DENIED 0 $0 4 $210,482 0 $0 APPLICATIONS WITHDRAWN 1 $256,000 1 $412,260 0 $0 FILES CLOSED FOR INCOMPLETENESS 0 $0 0 $0 0 $0
Aggregated Statistics For Year 2000(Based on 2 full and 3 partial tracts) A) Conventional B) Refinancings Number Average Value Number Average Value
LOANS ORIGINATED 30 $222,268 12 $229,683 APPLICATIONS APPROVED, NOT ACCEPTED 6 $238,682 1 $347,780 APPLICATIONS DENIED 2 $178,140 0 $0 APPLICATIONS WITHDRAWN 1 $182,460 1 $327,020 FILES CLOSED FOR INCOMPLETENESS 0 $0 0 $0
Aggregated Statistics For Year 1999(Based on 4 partial tracts) A) Conventional B) Refinancings C) Non-occupant Loans on Number Average Value Number Average Value Number Average Value
LOANS ORIGINATED 44 $218,299 23 $200,946 0 $0 APPLICATIONS APPROVED, NOT ACCEPTED 4 $244,608 13 $201,047 0 $0 APPLICATIONS DENIED 1 $106,290 3 $237,770 1 $166,340 APPLICATIONS WITHDRAWN 1 $370,460 3 $201,677 0 $0 FILES CLOSED FOR INCOMPLETENESS 0 $0 1 $231,350 0 $0
Detailed PMIC statistics for the following Tracts:
1101.02
, 1101.15 , 1101.16 , 1103.01 , 1103.04
Most common first names in La Palma, CA among deceased individuals Name Count Lived (average)
Mary 39 79.5 years Robert 30 69.5 years William 27 75.6 years John 26 72.3 years Richard 23 69.1 years James 20 72.1 years Margaret 19 82.1 years George 18 78.0 years Helen 17 82.8 years Joseph 14 69.8 years
Most common last names in La Palma, CA among deceased individuals Last name Count Lived (average)
Smith 9 82.5 years Kim 9 76.0 years Jones 8 72.7 years Davis 8 74.7 years Roberts 8 72.9 years Garcia 6 72.7 years Moore 6 78.2 years Park 6 72.2 years Lee 6 79.7 years Peterson 6 76.0 years
La Palma compared to California state average:
Unemployed percentage significantly below state average. Hispanic race population percentage below state average. Median age significantly above state average. Renting percentage below state average. Length of stay since moving in significantly above state average. Percentage of population with a bachelor's degree or higher above state average.
#24 on the list of "Top 101 cities with the most residents born in Korea (population 500+)"
#40 on the list of "Top 101 cities with the most residents born in Taiwan (population 500+)"
#44 on the list of "Top 101 cities with the most residents born in Eastern Asia (population 500+)"
#82 on the list of "Top 101 cities with the most residents born in Asia (population 500+)"
#4 on the list of "Top 101 counties with the highest total withdrawal of fresh water for public supply"
#5 on the list of "Top 101 counties with the most Catholic adherents"
#6 on the list of "Top 101 counties with the highest ground withdrawal of fresh water for public supply"
#7 on the list of "Top 101 counties with the most Evangelical Protestant adherents"
#8 on the list of "Top 101 counties with the highest Particulate Matter (PM2.5 ) Annual air pollution readings in 2012 (µg/m3 )"
Top Patent Applicants
Choonsup Lee (11)
Giri Natarajan (8)
Michael D. Sandoval (5)
Douglas E. Roberts (5)
Steven J. Mass (4)
Peter G. Ragay (4)
Young M. Doo (3)
Alec Michael Hale-Pletka (3)
Young Doo (3)
Niko Anthony Cvjetkovic (3)
Total of 102 patent applications in 2008-2024.


 Recent articles from our blog. Our writers, many of them Ph.D. graduates or candidates, create easy-to-read articles on a wide variety of topics.


 (1.9 miles
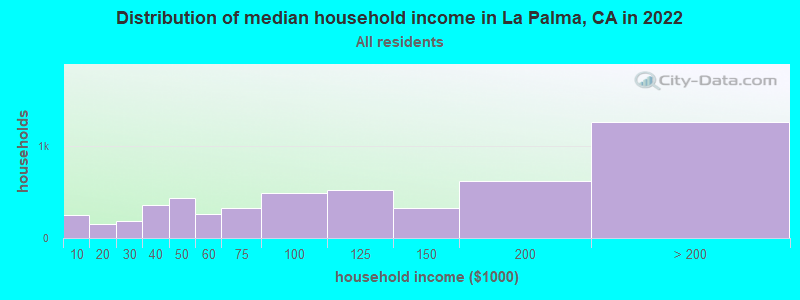
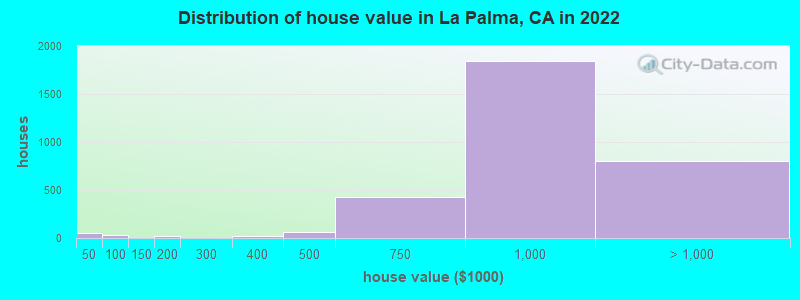
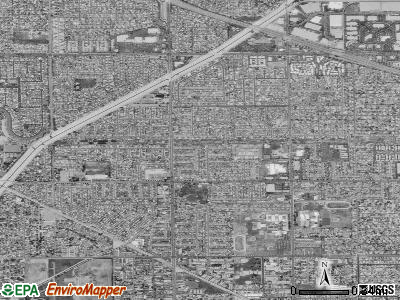
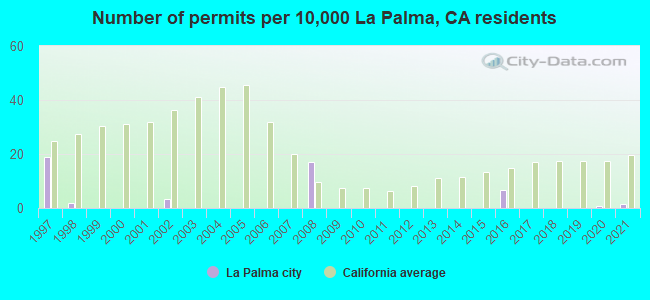
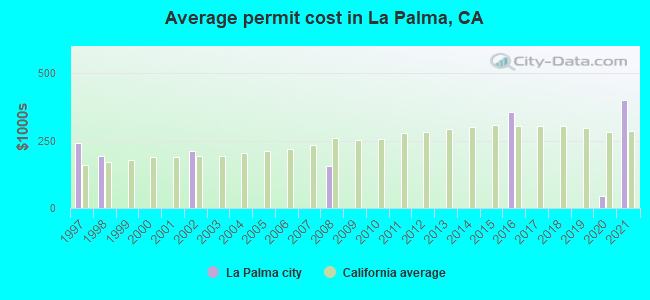
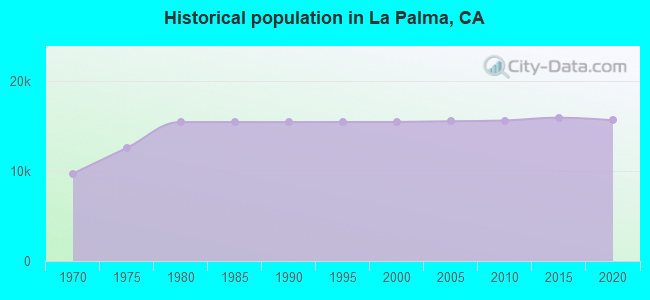
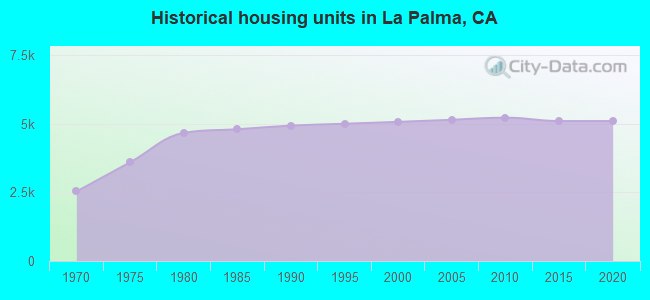
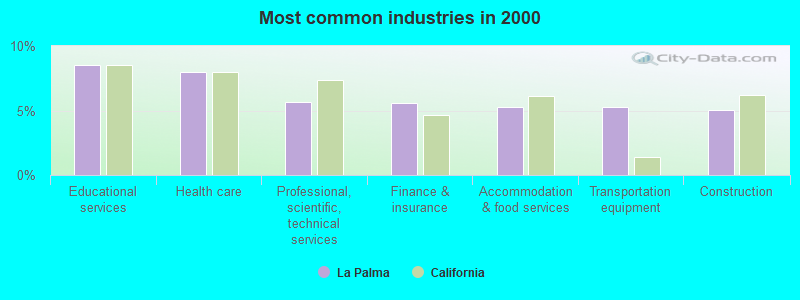
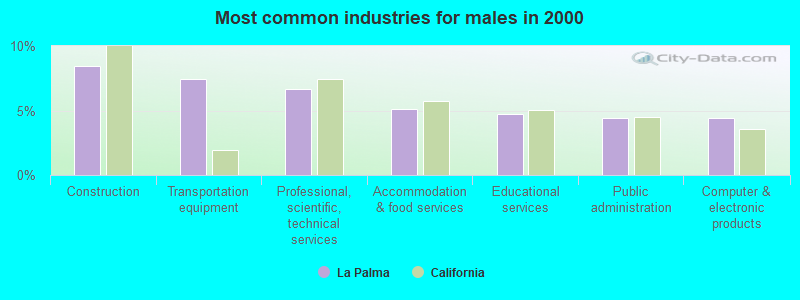
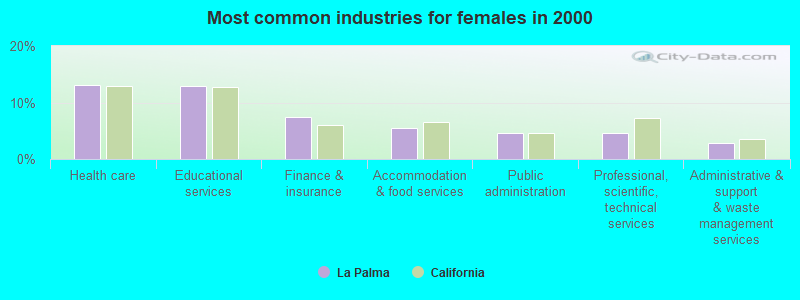
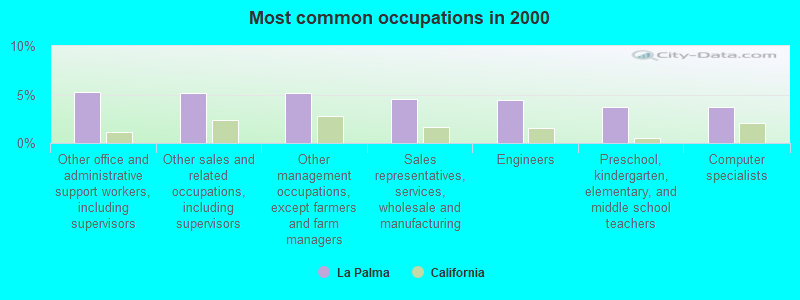
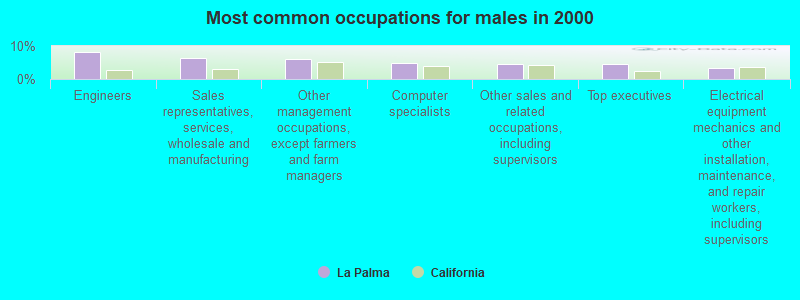
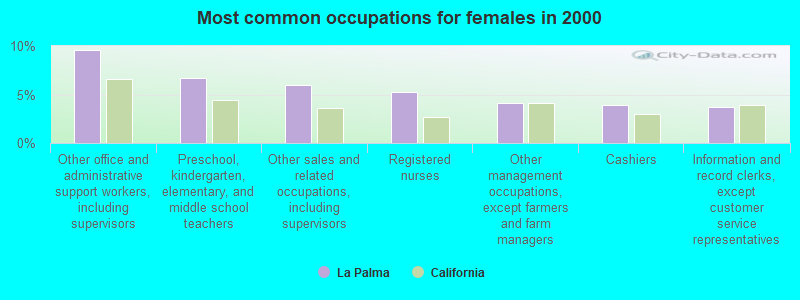
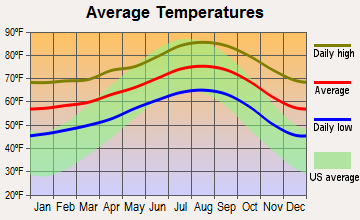
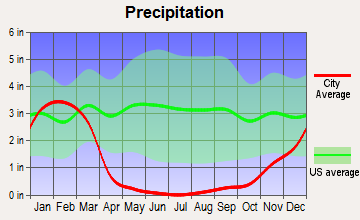
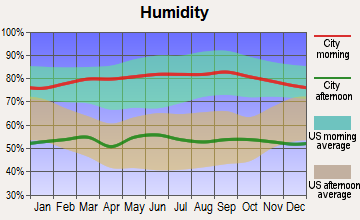
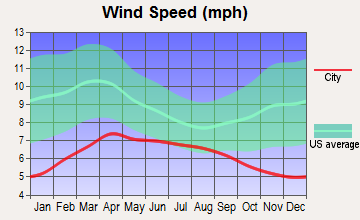
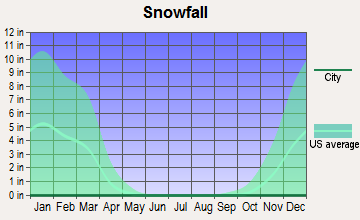
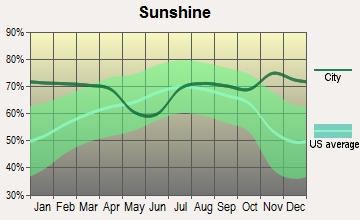
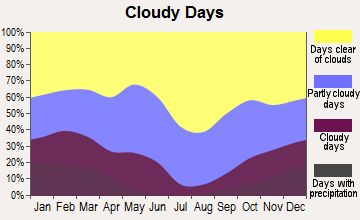
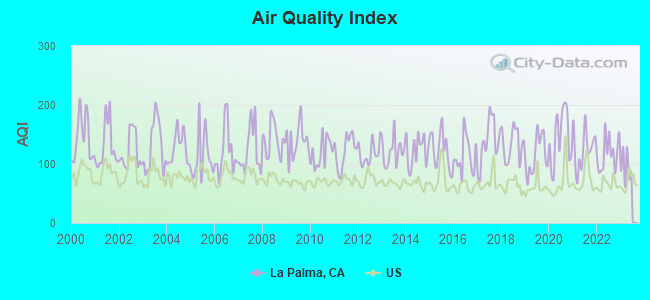
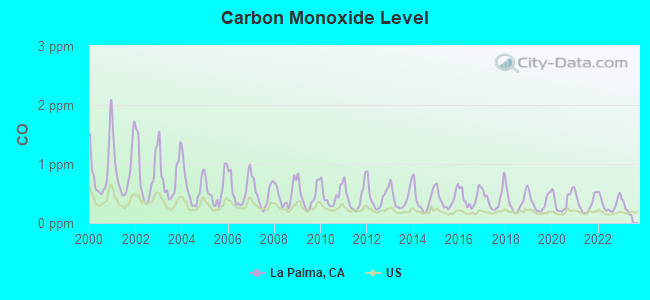
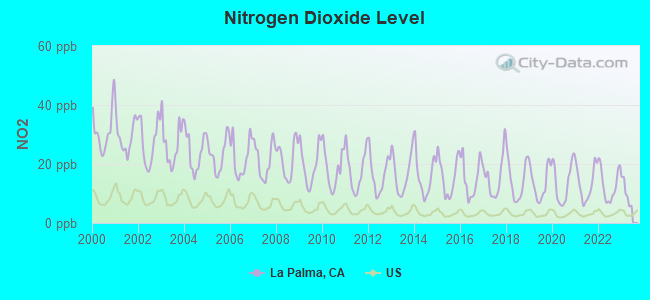
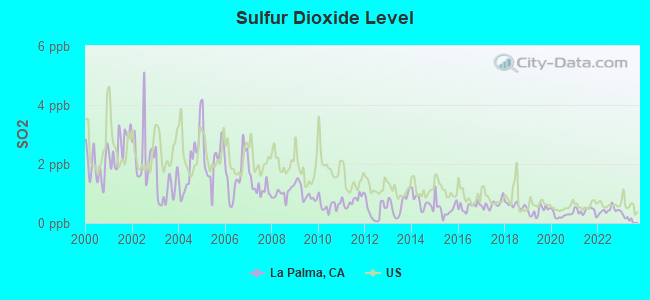
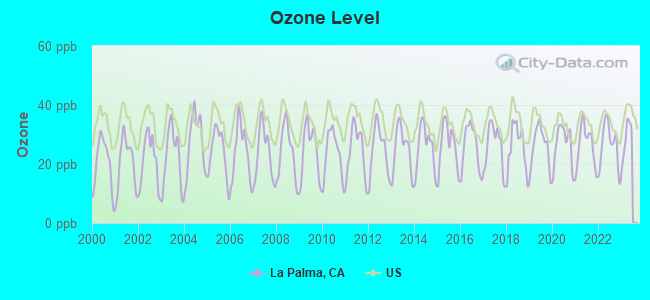
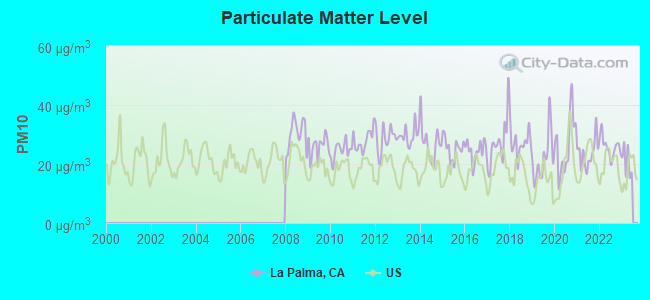
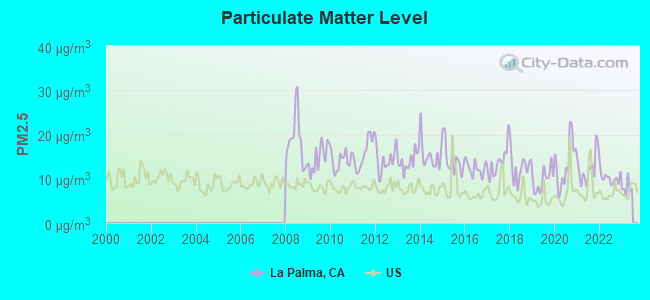
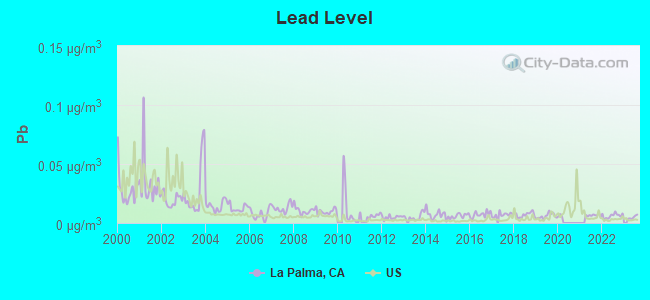
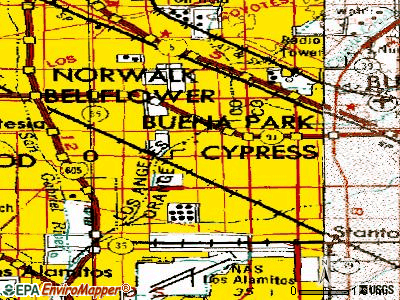
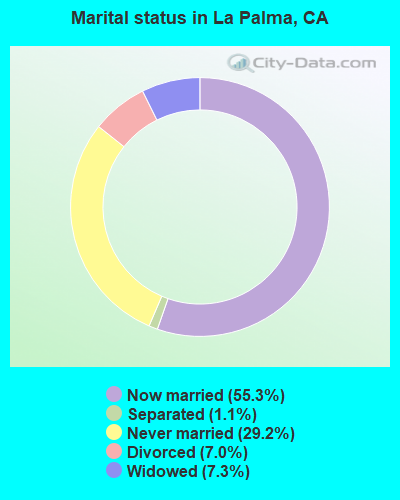
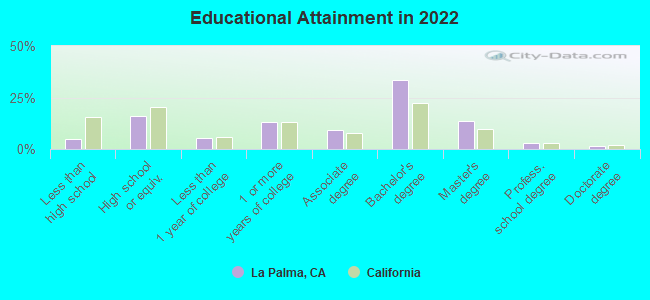
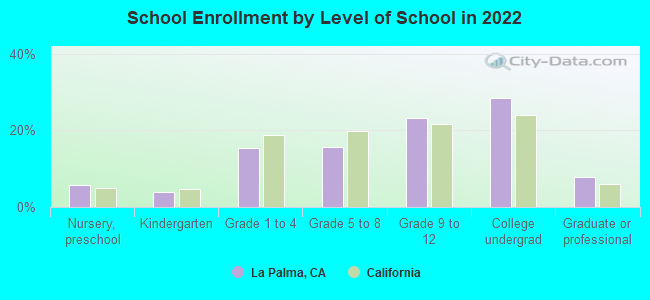
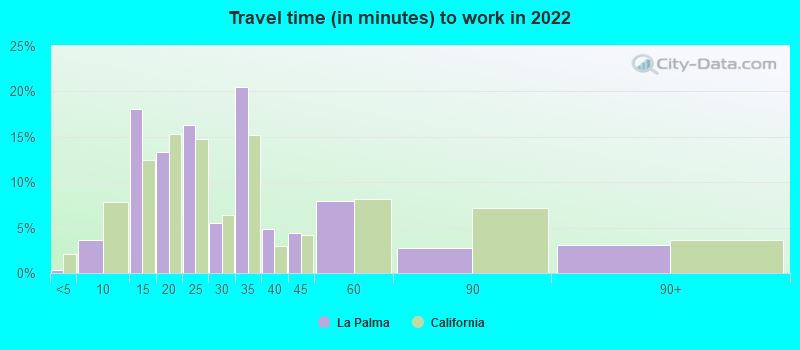
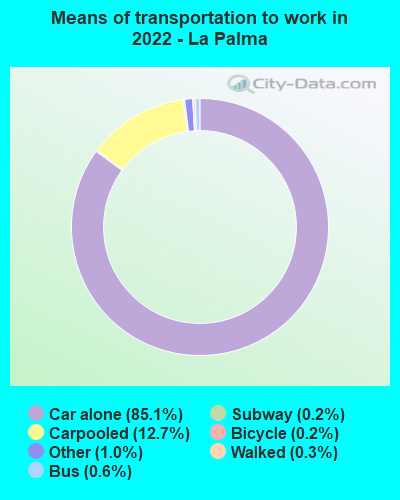


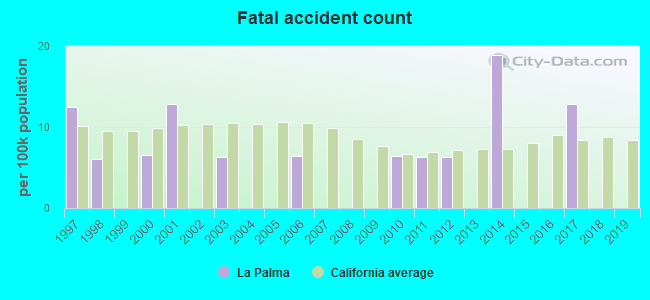
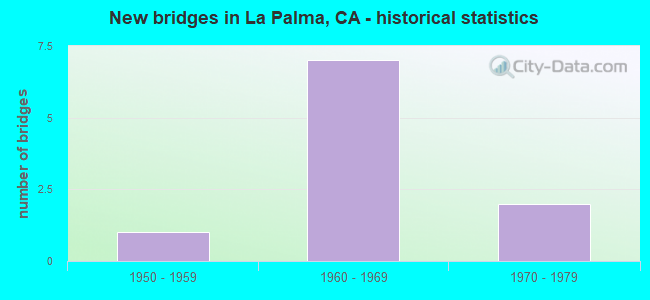

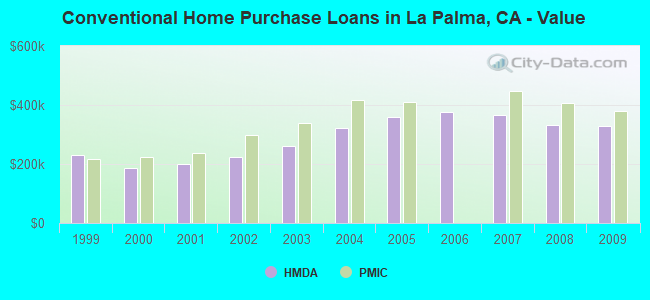
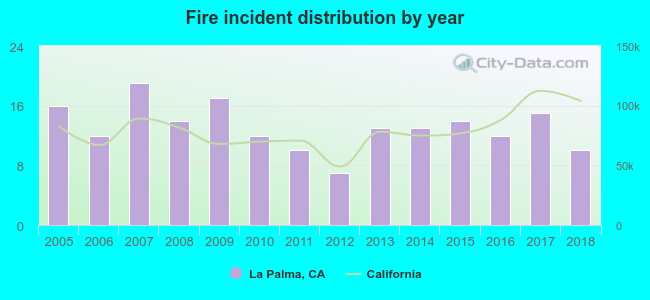 According to the data from the years 2005 - 2018 the average number of fires per year is 13. The highest number of fire incidents - 19 took place in 2007, and the least - 7 in 2012. The data has a decreasing trend.
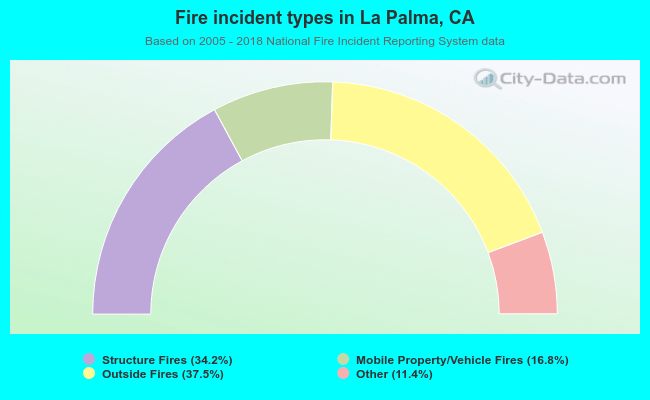 When looking into fire subcategories, the most reports belonged to: Outside Fires (37.5%), and Structure Fires (34.2%).