Martins Ferry, Ohio Submit your own pictures of this city and show them to the world
OSM Map
General Map
Google Map
MSN Map
OSM Map
General Map
Google Map
MSN Map
OSM Map
General Map
Google Map
MSN Map
OSM Map
General Map
Google Map
MSN Map
Please wait while loading the map...
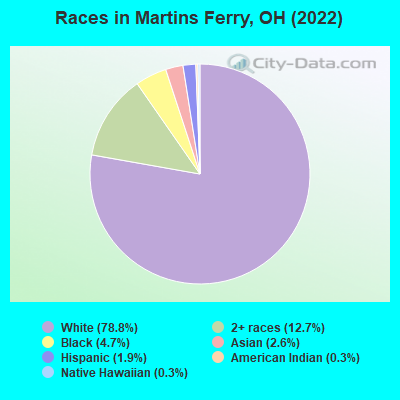
Population in 2022: 6,140 (99% urban, 1% rural). Population change since 2000: -15.0%Males: 2,908 Females: 3,232
March 2022 cost of living index in Martins Ferry: 87.7 (less than average, U.S. average is 100) Percentage of residents living in poverty in 2022: 32.4%for White Non-Hispanic residents , 10.5% for Black residents , 44.8% for Hispanic or Latino residents , 63.2% for American Indian residents , 100.0% for Native Hawaiian and other Pacific Islander residents , 100.0% for other race residents , 86.1% for two or more races residents )
Profiles of local businesses
Business Search - 14 Million verified businesses
Data:
Median household income ($)
Median household income (% change since 2000)
Household income diversity
Ratio of average income to average house value (%)
Ratio of average income to average rent
Median household income ($) - White
Median household income ($) - Black or African American
Median household income ($) - Asian
Median household income ($) - Hispanic or Latino
Median household income ($) - American Indian and Alaska Native
Median household income ($) - Multirace
Median household income ($) - Other Race
Median household income for houses/condos with a mortgage ($)
Median household income for apartments without a mortgage ($)
Races - White alone (%)
Races - White alone (% change since 2000)
Races - Black alone (%)
Races - Black alone (% change since 2000)
Races - American Indian alone (%)
Races - American Indian alone (% change since 2000)
Races - Asian alone (%)
Races - Asian alone (% change since 2000)
Races - Hispanic (%)
Races - Hispanic (% change since 2000)
Races - Native Hawaiian and Other Pacific Islander alone (%)
Races - Native Hawaiian and Other Pacific Islander alone (% change since 2000)
Races - Two or more races (%)
Races - Two or more races (% change since 2000)
Races - Other race alone (%)
Races - Other race alone (% change since 2000)
Racial diversity
Unemployment (%)
Unemployment (% change since 2000)
Unemployment (%) - White
Unemployment (%) - Black or African American
Unemployment (%) - Asian
Unemployment (%) - Hispanic or Latino
Unemployment (%) - American Indian and Alaska Native
Unemployment (%) - Multirace
Unemployment (%) - Other Race
Population density (people per square mile)
Population - Males (%)
Population - Females (%)
Population - Males (%) - White
Population - Males (%) - Black or African American
Population - Males (%) - Asian
Population - Males (%) - Hispanic or Latino
Population - Males (%) - American Indian and Alaska Native
Population - Males (%) - Multirace
Population - Males (%) - Other Race
Population - Females (%) - White
Population - Females (%) - Black or African American
Population - Females (%) - Asian
Population - Females (%) - Hispanic or Latino
Population - Females (%) - American Indian and Alaska Native
Population - Females (%) - Multirace
Population - Females (%) - Other Race
Coronavirus confirmed cases (Apr 25, 2024)
Deaths caused by coronavirus (Apr 25, 2024)
Coronavirus confirmed cases (per 100k population) (Apr 25, 2024)
Deaths caused by coronavirus (per 100k population) (Apr 25, 2024)
Daily increase in number of cases (Apr 25, 2024)
Weekly increase in number of cases (Apr 25, 2024)
Cases doubled (in days) (Apr 25, 2024)
Hospitalized patients (Apr 18, 2022)
Negative test results (Apr 18, 2022)
Total test results (Apr 18, 2022)
COVID Vaccine doses distributed (per 100k population) (Sep 19, 2023)
COVID Vaccine doses administered (per 100k population) (Sep 19, 2023)
COVID Vaccine doses distributed (Sep 19, 2023)
COVID Vaccine doses administered (Sep 19, 2023)
Likely homosexual households (%)
Likely homosexual households (% change since 2000)
Likely homosexual households - Lesbian couples (%)
Likely homosexual households - Lesbian couples (% change since 2000)
Likely homosexual households - Gay men (%)
Likely homosexual households - Gay men (% change since 2000)
Cost of living index
Median gross rent ($)
Median contract rent ($)
Median monthly housing costs ($)
Median house or condo value ($)
Median house or condo value ($ change since 2000)
Mean house or condo value by units in structure - 1, detached ($)
Mean house or condo value by units in structure - 1, attached ($)
Mean house or condo value by units in structure - 2 ($)
Mean house or condo value by units in structure by units in structure - 3 or 4 ($)
Mean house or condo value by units in structure - 5 or more ($)
Mean house or condo value by units in structure - Boat, RV, van, etc. ($)
Mean house or condo value by units in structure - Mobile home ($)
Median house or condo value ($) - White
Median house or condo value ($) - Black or African American
Median house or condo value ($) - Asian
Median house or condo value ($) - Hispanic or Latino
Median house or condo value ($) - American Indian and Alaska Native
Median house or condo value ($) - Multirace
Median house or condo value ($) - Other Race
Median resident age
Resident age diversity
Median resident age - Males
Median resident age - Females
Median resident age - White
Median resident age - Black or African American
Median resident age - Asian
Median resident age - Hispanic or Latino
Median resident age - American Indian and Alaska Native
Median resident age - Multirace
Median resident age - Other Race
Median resident age - Males - White
Median resident age - Males - Black or African American
Median resident age - Males - Asian
Median resident age - Males - Hispanic or Latino
Median resident age - Males - American Indian and Alaska Native
Median resident age - Males - Multirace
Median resident age - Males - Other Race
Median resident age - Females - White
Median resident age - Females - Black or African American
Median resident age - Females - Asian
Median resident age - Females - Hispanic or Latino
Median resident age - Females - American Indian and Alaska Native
Median resident age - Females - Multirace
Median resident age - Females - Other Race
Commute - mean travel time to work (minutes)
Travel time to work - Less than 5 minutes (%)
Travel time to work - Less than 5 minutes (% change since 2000)
Travel time to work - 5 to 9 minutes (%)
Travel time to work - 5 to 9 minutes (% change since 2000)
Travel time to work - 10 to 19 minutes (%)
Travel time to work - 10 to 19 minutes (% change since 2000)
Travel time to work - 20 to 29 minutes (%)
Travel time to work - 20 to 29 minutes (% change since 2000)
Travel time to work - 30 to 39 minutes (%)
Travel time to work - 30 to 39 minutes (% change since 2000)
Travel time to work - 40 to 59 minutes (%)
Travel time to work - 40 to 59 minutes (% change since 2000)
Travel time to work - 60 to 89 minutes (%)
Travel time to work - 60 to 89 minutes (% change since 2000)
Travel time to work - 90 or more minutes (%)
Travel time to work - 90 or more minutes (% change since 2000)
Marital status - Never married (%)
Marital status - Now married (%)
Marital status - Separated (%)
Marital status - Widowed (%)
Marital status - Divorced (%)
Median family income ($)
Median family income (% change since 2000)
Median non-family income ($)
Median non-family income (% change since 2000)
Median per capita income ($)
Median per capita income (% change since 2000)
Median family income ($) - White
Median family income ($) - Black or African American
Median family income ($) - Asian
Median family income ($) - Hispanic or Latino
Median family income ($) - American Indian and Alaska Native
Median family income ($) - Multirace
Median family income ($) - Other Race
Median year house/condo built
Median year apartment built
Year house built - Built 2005 or later (%)
Year house built - Built 2000 to 2004 (%)
Year house built - Built 1990 to 1999 (%)
Year house built - Built 1980 to 1989 (%)
Year house built - Built 1970 to 1979 (%)
Year house built - Built 1960 to 1969 (%)
Year house built - Built 1950 to 1959 (%)
Year house built - Built 1940 to 1949 (%)
Year house built - Built 1939 or earlier (%)
Average household size
Household density (households per square mile)
Average household size - White
Average household size - Black or African American
Average household size - Asian
Average household size - Hispanic or Latino
Average household size - American Indian and Alaska Native
Average household size - Multirace
Average household size - Other Race
Occupied housing units (%)
Vacant housing units (%)
Owner occupied housing units (%)
Renter occupied housing units (%)
Vacancy status - For rent (%)
Vacancy status - For sale only (%)
Vacancy status - Rented or sold, not occupied (%)
Vacancy status - For seasonal, recreational, or occasional use (%)
Vacancy status - For migrant workers (%)
Vacancy status - Other vacant (%)
Residents with income below the poverty level (%)
Residents with income below 50% of the poverty level (%)
Children below poverty level (%)
Poor families by family type - Married-couple family (%)
Poor families by family type - Male, no wife present (%)
Poor families by family type - Female, no husband present (%)
Poverty status for native-born residents (%)
Poverty status for foreign-born residents (%)
Poverty among high school graduates not in families (%)
Poverty among people who did not graduate high school not in families (%)
Residents with income below the poverty level (%) - White
Residents with income below the poverty level (%) - Black or African American
Residents with income below the poverty level (%) - Asian
Residents with income below the poverty level (%) - Hispanic or Latino
Residents with income below the poverty level (%) - American Indian and Alaska Native
Residents with income below the poverty level (%) - Multirace
Residents with income below the poverty level (%) - Other Race
Air pollution - Air Quality Index (AQI)
Air pollution - CO
Air pollution - NO2
Air pollution - SO2
Air pollution - Ozone
Air pollution - PM10
Air pollution - PM25
Air pollution - Pb
Crime - Murders per 100,000 population
Crime - Rapes per 100,000 population
Crime - Robberies per 100,000 population
Crime - Assaults per 100,000 population
Crime - Burglaries per 100,000 population
Crime - Thefts per 100,000 population
Crime - Auto thefts per 100,000 population
Crime - Arson per 100,000 population
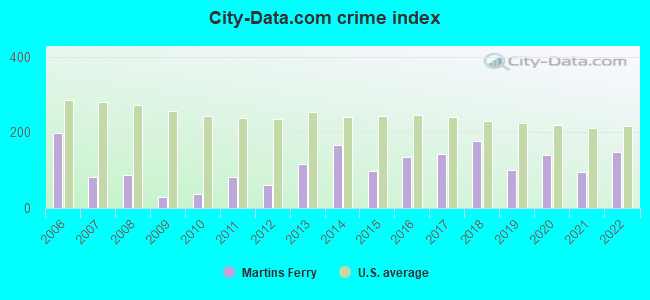
Crime - City-data.com crime index
Crime - Violent crime index
Crime - Property crime index
Crime - Murders per 100,000 population (5 year average)
Crime - Rapes per 100,000 population (5 year average)
Crime - Robberies per 100,000 population (5 year average)
Crime - Assaults per 100,000 population (5 year average)
Crime - Burglaries per 100,000 population (5 year average)
Crime - Thefts per 100,000 population (5 year average)
Crime - Auto thefts per 100,000 population (5 year average)
Crime - Arson per 100,000 population (5 year average)
Crime - City-data.com crime index (5 year average)
Crime - Violent crime index (5 year average)
Crime - Property crime index (5 year average)
1996 Presidential Elections Results (%) - Democratic Party (Clinton)
1996 Presidential Elections Results (%) - Republican Party (Dole)
1996 Presidential Elections Results (%) - Other
2000 Presidential Elections Results (%) - Democratic Party (Gore)
2000 Presidential Elections Results (%) - Republican Party (Bush)
2000 Presidential Elections Results (%) - Other
2004 Presidential Elections Results (%) - Democratic Party (Kerry)
2004 Presidential Elections Results (%) - Republican Party (Bush)
2004 Presidential Elections Results (%) - Other
2008 Presidential Elections Results (%) - Democratic Party (Obama)
2008 Presidential Elections Results (%) - Republican Party (McCain)
2008 Presidential Elections Results (%) - Other
2012 Presidential Elections Results (%) - Democratic Party (Obama)
2012 Presidential Elections Results (%) - Republican Party (Romney)
2012 Presidential Elections Results (%) - Other
2016 Presidential Elections Results (%) - Democratic Party (Clinton)
2016 Presidential Elections Results (%) - Republican Party (Trump)
2016 Presidential Elections Results (%) - Other
2020 Presidential Elections Results (%) - Democratic Party (Biden)
2020 Presidential Elections Results (%) - Republican Party (Trump)
2020 Presidential Elections Results (%) - Other
Ancestries Reported - Arab (%)
Ancestries Reported - Czech (%)
Ancestries Reported - Danish (%)
Ancestries Reported - Dutch (%)
Ancestries Reported - English (%)
Ancestries Reported - French (%)
Ancestries Reported - French Canadian (%)
Ancestries Reported - German (%)
Ancestries Reported - Greek (%)
Ancestries Reported - Hungarian (%)
Ancestries Reported - Irish (%)
Ancestries Reported - Italian (%)
Ancestries Reported - Lithuanian (%)
Ancestries Reported - Norwegian (%)
Ancestries Reported - Polish (%)
Ancestries Reported - Portuguese (%)
Ancestries Reported - Russian (%)
Ancestries Reported - Scotch-Irish (%)
Ancestries Reported - Scottish (%)
Ancestries Reported - Slovak (%)
Ancestries Reported - Subsaharan African (%)
Ancestries Reported - Swedish (%)
Ancestries Reported - Swiss (%)
Ancestries Reported - Ukrainian (%)
Ancestries Reported - United States (%)
Ancestries Reported - Welsh (%)
Ancestries Reported - West Indian (%)
Ancestries Reported - Other (%)
Educational Attainment - No schooling completed (%)
Educational Attainment - Less than high school (%)
Educational Attainment - High school or equivalent (%)
Educational Attainment - Less than 1 year of college (%)
Educational Attainment - 1 or more years of college (%)
Educational Attainment - Associate degree (%)
Educational Attainment - Bachelor's degree (%)
Educational Attainment - Master's degree (%)
Educational Attainment - Professional school degree (%)
Educational Attainment - Doctorate degree (%)
School Enrollment - Nursery, preschool (%)
School Enrollment - Kindergarten (%)
School Enrollment - Grade 1 to 4 (%)
School Enrollment - Grade 5 to 8 (%)
School Enrollment - Grade 9 to 12 (%)
School Enrollment - College undergrad (%)
School Enrollment - Graduate or professional (%)
School Enrollment - Not enrolled in school (%)
School enrollment - Public schools (%)
School enrollment - Private schools (%)
School enrollment - Not enrolled (%)
Median number of rooms in houses and condos
Median number of rooms in apartments
Housing units lacking complete plumbing facilities (%)
Housing units lacking complete kitchen facilities (%)
Density of houses
Urban houses (%)
Rural houses (%)
Households with people 60 years and over (%)
Households with people 65 years and over (%)
Households with people 75 years and over (%)
Households with one or more nonrelatives (%)
Households with no nonrelatives (%)
Population in households (%)
Family households (%)
Nonfamily households (%)
Population in families (%)
Family households with own children (%)
Median number of bedrooms in owner occupied houses
Mean number of bedrooms in owner occupied houses
Median number of bedrooms in renter occupied houses
Mean number of bedrooms in renter occupied houses
Median number of vehichles in owner occupied houses
Mean number of vehichles in owner occupied houses
Median number of vehichles in renter occupied houses
Mean number of vehichles in renter occupied houses
Mortgage status - with mortgage (%)
Mortgage status - with second mortgage (%)
Mortgage status - with home equity loan (%)
Mortgage status - with both second mortgage and home equity loan (%)
Mortgage status - without a mortgage (%)
Average family size
Average family size - White
Average family size - Black or African American
Average family size - Asian
Average family size - Hispanic or Latino
Average family size - American Indian and Alaska Native
Average family size - Multirace
Average family size - Other Race
Geographical mobility - Same house 1 year ago (%)
Geographical mobility - Moved within same county (%)
Geographical mobility - Moved from different county within same state (%)
Geographical mobility - Moved from different state (%)
Geographical mobility - Moved from abroad (%)
Place of birth - Born in state of residence (%)
Place of birth - Born in other state (%)
Place of birth - Native, outside of US (%)
Place of birth - Foreign born (%)
Housing units in structures - 1, detached (%)
Housing units in structures - 1, attached (%)
Housing units in structures - 2 (%)
Housing units in structures - 3 or 4 (%)
Housing units in structures - 5 to 9 (%)
Housing units in structures - 10 to 19 (%)
Housing units in structures - 20 to 49 (%)
Housing units in structures - 50 or more (%)
Housing units in structures - Mobile home (%)
Housing units in structures - Boat, RV, van, etc. (%)
House/condo owner moved in on average (years ago)
Renter moved in on average (years ago)
Year householder moved into unit - Moved in 1999 to March 2000 (%)
Year householder moved into unit - Moved in 1995 to 1998 (%)
Year householder moved into unit - Moved in 1990 to 1994 (%)
Year householder moved into unit - Moved in 1980 to 1989 (%)
Year householder moved into unit - Moved in 1970 to 1979 (%)
Year householder moved into unit - Moved in 1969 or earlier (%)
Means of transportation to work - Drove car alone (%)
Means of transportation to work - Carpooled (%)
Means of transportation to work - Public transportation (%)
Means of transportation to work - Bus or trolley bus (%)
Means of transportation to work - Streetcar or trolley car (%)
Means of transportation to work - Subway or elevated (%)
Means of transportation to work - Railroad (%)
Means of transportation to work - Ferryboat (%)
Means of transportation to work - Taxicab (%)
Means of transportation to work - Motorcycle (%)
Means of transportation to work - Bicycle (%)
Means of transportation to work - Walked (%)
Means of transportation to work - Other means (%)
Working at home (%)
Industry diversity
Most Common Industries - Agriculture, forestry, fishing and hunting, and mining (%)
Most Common Industries - Agriculture, forestry, fishing and hunting (%)
Most Common Industries - Mining, quarrying, and oil and gas extraction (%)
Most Common Industries - Construction (%)
Most Common Industries - Manufacturing (%)
Most Common Industries - Wholesale trade (%)
Most Common Industries - Retail trade (%)
Most Common Industries - Transportation and warehousing, and utilities (%)
Most Common Industries - Transportation and warehousing (%)
Most Common Industries - Utilities (%)
Most Common Industries - Information (%)
Most Common Industries - Finance and insurance, and real estate and rental and leasing (%)
Most Common Industries - Finance and insurance (%)
Most Common Industries - Real estate and rental and leasing (%)
Most Common Industries - Professional, scientific, and management, and administrative and waste management services (%)
Most Common Industries - Professional, scientific, and technical services (%)
Most Common Industries - Management of companies and enterprises (%)
Most Common Industries - Administrative and support and waste management services (%)
Most Common Industries - Educational services, and health care and social assistance (%)
Most Common Industries - Educational services (%)
Most Common Industries - Health care and social assistance (%)
Most Common Industries - Arts, entertainment, and recreation, and accommodation and food services (%)
Most Common Industries - Arts, entertainment, and recreation (%)
Most Common Industries - Accommodation and food services (%)
Most Common Industries - Other services, except public administration (%)
Most Common Industries - Public administration (%)
Occupation diversity
Most Common Occupations - Management, business, science, and arts occupations (%)
Most Common Occupations - Management, business, and financial occupations (%)
Most Common Occupations - Management occupations (%)
Most Common Occupations - Business and financial operations occupations (%)
Most Common Occupations - Computer, engineering, and science occupations (%)
Most Common Occupations - Computer and mathematical occupations (%)
Most Common Occupations - Architecture and engineering occupations (%)
Most Common Occupations - Life, physical, and social science occupations (%)
Most Common Occupations - Education, legal, community service, arts, and media occupations (%)
Most Common Occupations - Community and social service occupations (%)
Most Common Occupations - Legal occupations (%)
Most Common Occupations - Education, training, and library occupations (%)
Most Common Occupations - Arts, design, entertainment, sports, and media occupations (%)
Most Common Occupations - Healthcare practitioners and technical occupations (%)
Most Common Occupations - Health diagnosing and treating practitioners and other technical occupations (%)
Most Common Occupations - Health technologists and technicians (%)
Most Common Occupations - Service occupations (%)
Most Common Occupations - Healthcare support occupations (%)
Most Common Occupations - Protective service occupations (%)
Most Common Occupations - Fire fighting and prevention, and other protective service workers including supervisors (%)
Most Common Occupations - Law enforcement workers including supervisors (%)
Most Common Occupations - Food preparation and serving related occupations (%)
Most Common Occupations - Building and grounds cleaning and maintenance occupations (%)
Most Common Occupations - Personal care and service occupations (%)
Most Common Occupations - Sales and office occupations (%)
Most Common Occupations - Sales and related occupations (%)
Most Common Occupations - Office and administrative support occupations (%)
Most Common Occupations - Natural resources, construction, and maintenance occupations (%)
Most Common Occupations - Farming, fishing, and forestry occupations (%)
Most Common Occupations - Construction and extraction occupations (%)
Most Common Occupations - Installation, maintenance, and repair occupations (%)
Most Common Occupations - Production, transportation, and material moving occupations (%)
Most Common Occupations - Production occupations (%)
Most Common Occupations - Transportation occupations (%)
Most Common Occupations - Material moving occupations (%)
People in Group quarters - Institutionalized population (%)
People in Group quarters - Correctional institutions (%)
People in Group quarters - Federal prisons and detention centers (%)
People in Group quarters - Halfway houses (%)
People in Group quarters - Local jails and other confinement facilities (including police lockups) (%)
People in Group quarters - Military disciplinary barracks (%)
People in Group quarters - State prisons (%)
People in Group quarters - Other types of correctional institutions (%)
People in Group quarters - Nursing homes (%)
People in Group quarters - Hospitals/wards, hospices, and schools for the handicapped (%)
People in Group quarters - Hospitals/wards and hospices for chronically ill (%)
People in Group quarters - Hospices or homes for chronically ill (%)
People in Group quarters - Military hospitals or wards for chronically ill (%)
People in Group quarters - Other hospitals or wards for chronically ill (%)
People in Group quarters - Hospitals or wards for drug/alcohol abuse (%)
People in Group quarters - Mental (Psychiatric) hospitals or wards (%)
People in Group quarters - Schools, hospitals, or wards for the mentally retarded (%)
People in Group quarters - Schools, hospitals, or wards for the physically handicapped (%)
People in Group quarters - Institutions for the deaf (%)
People in Group quarters - Institutions for the blind (%)
People in Group quarters - Orthopedic wards and institutions for the physically handicapped (%)
People in Group quarters - Wards in general hospitals for patients who have no usual home elsewhere (%)
People in Group quarters - Wards in military hospitals for patients who have no usual home elsewhere (%)
People in Group quarters - Juvenile institutions (%)
People in Group quarters - Long-term care (%)
People in Group quarters - Homes for abused, dependent, and neglected children (%)
People in Group quarters - Residential treatment centers for emotionally disturbed children (%)
People in Group quarters - Training schools for juvenile delinquents (%)
People in Group quarters - Short-term care, detention or diagnostic centers for delinquent children (%)
People in Group quarters - Type of juvenile institution unknown (%)
People in Group quarters - Noninstitutionalized population (%)
People in Group quarters - College dormitories (includes college quarters off campus) (%)
People in Group quarters - Military quarters (%)
People in Group quarters - On base (%)
People in Group quarters - Barracks, unaccompanied personnel housing (UPH), (Enlisted/Officer), ;and similar group living quarters for military personnel (%)
People in Group quarters - Transient quarters for temporary residents (%)
People in Group quarters - Military ships (%)
People in Group quarters - Group homes (%)
People in Group quarters - Homes or halfway houses for drug/alcohol abuse (%)
People in Group quarters - Homes for the mentally ill (%)
People in Group quarters - Homes for the mentally retarded (%)
People in Group quarters - Homes for the physically handicapped (%)
People in Group quarters - Other group homes (%)
People in Group quarters - Religious group quarters (%)
People in Group quarters - Dormitories (%)
People in Group quarters - Agriculture workers' dormitories on farms (%)
People in Group quarters - Job Corps and vocational training facilities (%)
People in Group quarters - Other workers' dormitories (%)
People in Group quarters - Crews of maritime vessels (%)
People in Group quarters - Other nonhousehold living situations (%)
People in Group quarters - Other noninstitutional group quarters (%)
Residents speaking English at home (%)
Residents speaking English at home - Born in the United States (%)
Residents speaking English at home - Native, born elsewhere (%)
Residents speaking English at home - Foreign born (%)
Residents speaking Spanish at home (%)
Residents speaking Spanish at home - Born in the United States (%)
Residents speaking Spanish at home - Native, born elsewhere (%)
Residents speaking Spanish at home - Foreign born (%)
Residents speaking other language at home (%)
Residents speaking other language at home - Born in the United States (%)
Residents speaking other language at home - Native, born elsewhere (%)
Residents speaking other language at home - Foreign born (%)
Class of Workers - Employee of private company (%)
Class of Workers - Self-employed in own incorporated business (%)
Class of Workers - Private not-for-profit wage and salary workers (%)
Class of Workers - Local government workers (%)
Class of Workers - State government workers (%)
Class of Workers - Federal government workers (%)
Class of Workers - Self-employed workers in own not incorporated business and Unpaid family workers (%)
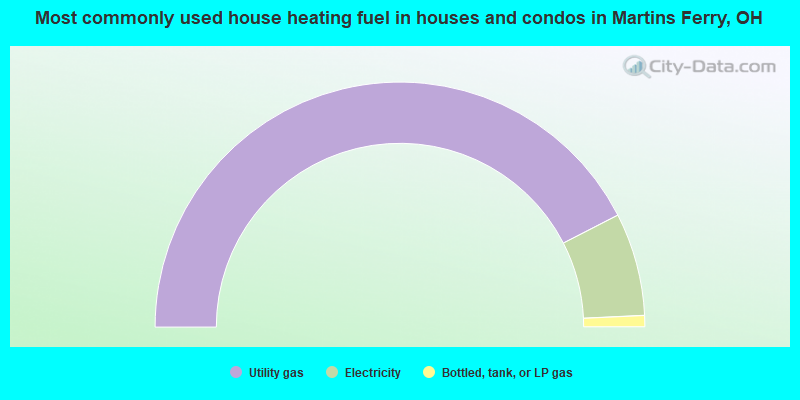
House heating fuel used in houses and condos - Utility gas (%)
House heating fuel used in houses and condos - Bottled, tank, or LP gas (%)
House heating fuel used in houses and condos - Electricity (%)
House heating fuel used in houses and condos - Fuel oil, kerosene, etc. (%)
House heating fuel used in houses and condos - Coal or coke (%)
House heating fuel used in houses and condos - Wood (%)
House heating fuel used in houses and condos - Solar energy (%)
House heating fuel used in houses and condos - Other fuel (%)
House heating fuel used in houses and condos - No fuel used (%)
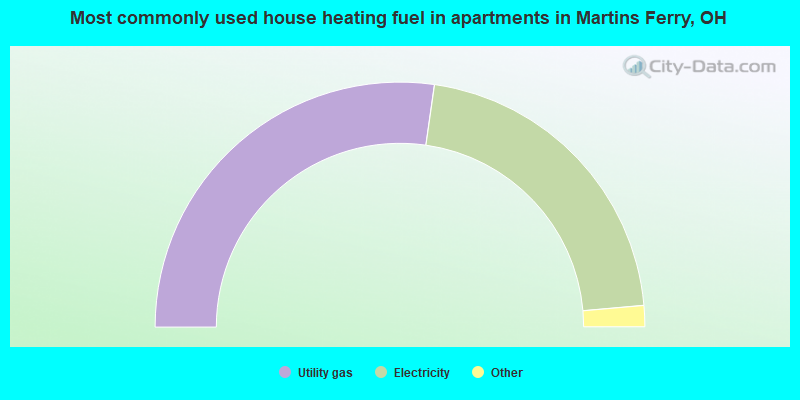
House heating fuel used in apartments - Utility gas (%)
House heating fuel used in apartments - Bottled, tank, or LP gas (%)
House heating fuel used in apartments - Electricity (%)
House heating fuel used in apartments - Fuel oil, kerosene, etc. (%)
House heating fuel used in apartments - Coal or coke (%)
House heating fuel used in apartments - Wood (%)
House heating fuel used in apartments - Solar energy (%)
House heating fuel used in apartments - Other fuel (%)
House heating fuel used in apartments - No fuel used (%)
Armed forces status - In Armed Forces (%)
Armed forces status - Civilian (%)
Armed forces status - Civilian - Veteran (%)
Armed forces status - Civilian - Nonveteran (%)
Fatal accidents locations in years 2005-2021
Fatal accidents locations in 2005
Fatal accidents locations in 2006
Fatal accidents locations in 2007
Fatal accidents locations in 2008
Fatal accidents locations in 2009
Fatal accidents locations in 2010
Fatal accidents locations in 2011
Fatal accidents locations in 2012
Fatal accidents locations in 2013
Fatal accidents locations in 2014
Fatal accidents locations in 2015
Fatal accidents locations in 2016
Fatal accidents locations in 2017
Fatal accidents locations in 2018
Fatal accidents locations in 2019
Fatal accidents locations in 2020
Fatal accidents locations in 2021
Alcohol use - People drinking some alcohol every month (%)
Alcohol use - People not drinking at all (%)
Alcohol use - Average days/month drinking alcohol
Alcohol use - Average drinks/week
Alcohol use - Average days/year people drink much
Audiometry - Average condition of hearing (%)
Audiometry - People that can hear a whisper from across a quiet room (%)
Audiometry - People that can hear normal voice from across a quiet room (%)
Audiometry - Ears ringing, roaring, buzzing (%)
Audiometry - Had a job exposure to loud noise (%)
Audiometry - Had off-work exposure to loud noise (%)
Blood Pressure & Cholesterol - Has high blood pressure (%)
Blood Pressure & Cholesterol - Checking blood pressure at home (%)
Blood Pressure & Cholesterol - Frequently checking blood cholesterol (%)
Blood Pressure & Cholesterol - Has high cholesterol level (%)
Consumer Behavior - Money monthly spent on food at supermarket/grocery store
Consumer Behavior - Money monthly spent on food at other stores
Consumer Behavior - Money monthly spent on eating out
Consumer Behavior - Money monthly spent on carryout/delivered foods
Consumer Behavior - Income spent on food at supermarket/grocery store (%)
Consumer Behavior - Income spent on food at other stores (%)
Consumer Behavior - Income spent on eating out (%)
Consumer Behavior - Income spent on carryout/delivered foods (%)
Current Health Status - General health condition (%)
Current Health Status - Blood donors (%)
Current Health Status - Has blood ever tested for HIV virus (%)
Current Health Status - Left-handed people (%)
Dermatology - People using sunscreen (%)
Diabetes - Diabetics (%)
Diabetes - Had a blood test for high blood sugar (%)
Diabetes - People taking insulin (%)
Diet Behavior & Nutrition - Diet health (%)
Diet Behavior & Nutrition - Milk product consumption (# of products/month)
Diet Behavior & Nutrition - Meals not home prepared (#/week)
Diet Behavior & Nutrition - Meals from fast food or pizza place (#/week)
Diet Behavior & Nutrition - Ready-to-eat foods (#/month)
Diet Behavior & Nutrition - Frozen meals/pizza (#/month)
Drug Use - People that ever used marijuana or hashish (%)
Drug Use - Ever used hard drugs (%)
Drug Use - Ever used any form of cocaine (%)
Drug Use - Ever used heroin (%)
Drug Use - Ever used methamphetamine (%)
Health Insurance - People covered by health insurance (%)
Kidney Conditions-Urology - Avg. # of times urinating at night
Medical Conditions - People with asthma (%)
Medical Conditions - People with anemia (%)
Medical Conditions - People with psoriasis (%)
Medical Conditions - People with overweight (%)
Medical Conditions - Elderly people having difficulties in thinking or remembering (%)
Medical Conditions - People who ever received blood transfusion (%)
Medical Conditions - People having trouble seeing even with glass/contacts (%)
Medical Conditions - People with arthritis (%)
Medical Conditions - People with gout (%)
Medical Conditions - People with congestive heart failure (%)
Medical Conditions - People with coronary heart disease (%)
Medical Conditions - People with angina pectoris (%)
Medical Conditions - People who ever had heart attack (%)
Medical Conditions - People who ever had stroke (%)
Medical Conditions - People with emphysema (%)
Medical Conditions - People with thyroid problem (%)
Medical Conditions - People with chronic bronchitis (%)
Medical Conditions - People with any liver condition (%)
Medical Conditions - People who ever had cancer or malignancy (%)
Mental Health - People who have little interest in doing things (%)
Mental Health - People feeling down, depressed, or hopeless (%)
Mental Health - People who have trouble sleeping or sleeping too much (%)
Mental Health - People feeling tired or having little energy (%)
Mental Health - People with poor appetite or overeating (%)
Mental Health - People feeling bad about themself (%)
Mental Health - People who have trouble concentrating on things (%)
Mental Health - People moving or speaking slowly or too fast (%)
Mental Health - People having thoughts they would be better off dead (%)
Oral Health - Average years since last visit a dentist
Oral Health - People embarrassed because of mouth (%)
Oral Health - People with gum disease (%)
Oral Health - General health of teeth and gums (%)
Oral Health - Average days a week using dental floss/device
Oral Health - Average days a week using mouthwash for dental problem
Oral Health - Average number of teeth
Pesticide Use - Households using pesticides to control insects (%)
Pesticide Use - Households using pesticides to kill weeds (%)
Physical Activity - People doing vigorous-intensity work activities (%)
Physical Activity - People doing moderate-intensity work activities (%)
Physical Activity - People walking or bicycling (%)
Physical Activity - People doing vigorous-intensity recreational activities (%)
Physical Activity - People doing moderate-intensity recreational activities (%)
Physical Activity - Average hours a day doing sedentary activities
Physical Activity - Average hours a day watching TV or videos
Physical Activity - Average hours a day using computer
Physical Functioning - People having limitations keeping them from working (%)
Physical Functioning - People limited in amount of work they can do (%)
Physical Functioning - People that need special equipment to walk (%)
Physical Functioning - People experiencing confusion/memory problems (%)
Physical Functioning - People requiring special healthcare equipment (%)
Prescription Medications - Average number of prescription medicines taking
Preventive Aspirin Use - Adults 40+ taking low-dose aspirin (%)
Reproductive Health - Vaginal deliveries (%)
Reproductive Health - Cesarean deliveries (%)
Reproductive Health - Deliveries resulted in a live birth (%)
Reproductive Health - Pregnancies resulted in a delivery (%)
Reproductive Health - Women breastfeeding newborns (%)
Reproductive Health - Women that had a hysterectomy (%)
Reproductive Health - Women that had both ovaries removed (%)
Reproductive Health - Women that have ever taken birth control pills (%)
Reproductive Health - Women taking birth control pills (%)
Reproductive Health - Women that have ever used Depo-Provera or injectables (%)
Reproductive Health - Women that have ever used female hormones (%)
Sexual Behavior - People 18+ that ever had sex (vaginal, anal, or oral) (%)
Sexual Behavior - Males 18+ that ever had vaginal sex with a woman (%)
Sexual Behavior - Males 18+ that ever performed oral sex on a woman (%)
Sexual Behavior - Males 18+ that ever had anal sex with a woman (%)
Sexual Behavior - Males 18+ that ever had any sex with a man (%)
Sexual Behavior - Females 18+ that ever had vaginal sex with a man (%)
Sexual Behavior - Females 18+ that ever performed oral sex on a man (%)
Sexual Behavior - Females 18+ that ever had anal sex with a man (%)
Sexual Behavior - Females 18+ that ever had any kind of sex with a woman (%)
Sexual Behavior - Average age people first had sex
Sexual Behavior - Average number of female sex partners in lifetime (males 18+)
Sexual Behavior - Average number of female vaginal sex partners in lifetime (males 18+)
Sexual Behavior - Average age people first performed oral sex on a woman (18+)
Sexual Behavior - Average number of woman performed oral sex on in lifetime (18+)
Sexual Behavior - Average number of male sex partners in lifetime (males 18+)
Sexual Behavior - Average number of male anal sex partners in lifetime (males 18+)
Sexual Behavior - Average age people first performed oral sex on a man (18+)
Sexual Behavior - Average number of male oral sex partners in lifetime (18+)
Sexual Behavior - People using protection when performing oral sex (%)
Sexual Behavior - Average number of times people have vaginal or anal sex a year
Sexual Behavior - People having sex without condom (%)
Sexual Behavior - Average number of male sex partners in lifetime (females 18+)
Sexual Behavior - Average number of male vaginal sex partners in lifetime (females 18+)
Sexual Behavior - Average number of female sex partners in lifetime (females 18+)
Sexual Behavior - Circumcised males 18+ (%)
Sleep Disorders - Average hours sleeping at night
Sleep Disorders - People that has trouble sleeping (%)
Smoking-Cigarette Use - People smoking cigarettes (%)
Taste & Smell - People 40+ having problems with smell (%)
Taste & Smell - People 40+ having problems with taste (%)
Taste & Smell - People 40+ that ever had wisdom teeth removed (%)
Taste & Smell - People 40+ that ever had tonsils teeth removed (%)
Taste & Smell - People 40+ that ever had a loss of consciousness because of a head injury (%)
Taste & Smell - People 40+ that ever had a broken nose or other serious injury to face or skull (%)
Taste & Smell - People 40+ that ever had two or more sinus infections (%)
Weight - Average height (inches)
Weight - Average weight (pounds)
Weight - Average BMI
Weight - People that are obese (%)
Weight - People that ever were obese (%)
Weight - People trying to lose weight (%)
According to our research of Ohio and other state lists, there were 13 registered sex offenders living in Martins Ferry, Ohio as of April 25, 2024 . The ratio of all residents to sex offenders in Martins Ferry is 525 to 1.The ratio of registered sex offenders to all residents in this city is near the state average.
Officers per 1,000 residents here:
1.74Ohio average:
2.11
Latest news from Martins Ferry, OH collected exclusively by city-data.com from local newspapers, TV, and radio stations
Ancestries: Irish (19.7%), American (14.9%), German (14.2%), Italian (9.7%), Polish (4.9%), English (4.8%).
Current Local Time:
Land area: 2.16 square miles.
Population density: 2,842 people per square mile (average).
156 residents are foreign born (2.1% Asia ).
Median real estate property taxes paid for housing units with mortgages in 2022: $1,256 (1.1%)Median real estate property taxes paid for housing units with no mortgage in 2022: $846 (1.0%)
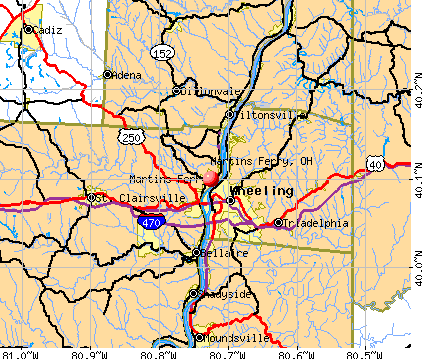
Nearest city with pop. 50,000+: Pittsburgh, PA
Nearest city with pop. 1,000,000+: Philadelphia, PA
Nearest cities:
Latitude: 40.10 N, Longitude: 80.73 W
Daytime population change due to commuting: -246 (-4.0%)Workers who live and work in this city: 497 (20.7%)
Area code commonly used in this area: 304
Single-family new house construction building permits:
2011: 1 building , cost: $295,0002010: 3 buildings , average cost: $106,7002009: 4 buildings , average cost: $106,7002007: 3 buildings , average cost: $134,8002006: 1 building , cost: $40,0002005: 1 building , cost: $100,0002004: 2 buildings , average cost: $146,2002003: 2 buildings , average cost: $41,0002002: 1 building , cost: $147,0002000: 1 building , cost: $10,0001999: 1 building , cost: $93,0001998: 3 buildings , average cost: $61,7001997: 2 buildings , average cost: $62,500Unemployment in December 2023:
Most common occupations in Martins Ferry, OH (%)
Both Males Females
Secretaries and administrative assistants (5.0%)
Other office and administrative support workers, including supervisors (4.5%)
Other production occupations, including supervisors (4.3%)
Cashiers (4.3%)
Driver/sales workers and truck drivers (4.2%)
Building and grounds cleaning and maintenance occupations (4.2%)
Electrical equipment mechanics and other installation, maintenance, and repair workers, including supervisors (3.3%)
Driver/sales workers and truck drivers (8.3%)
Other production occupations, including supervisors (7.2%)
Electrical equipment mechanics and other installation, maintenance, and repair workers, including supervisors (5.7%)
Other material moving workers, except laborers (5.2%)
Building and grounds cleaning and maintenance occupations (5.0%)
Laborers and material movers, hand (4.9%)
Material recording, scheduling, dispatching, and distributing workers (4.6%)
Secretaries and administrative assistants (9.8%)
Cashiers (7.8%)
Other office and administrative support workers, including supervisors (7.5%)
Health technologists and technicians (4.2%)
Nursing, psychiatric, and home health aides (4.2%)
Waiters and waitresses (4.0%)
Retail sales workers, except cashiers (3.9%)
Tornado activity:
Martins Ferry-area historical tornado activity is below Ohio state average. It is 33% smaller than the overall U.S. average.
On 5/8/1969, a category F3 (max. wind speeds 158-206 mph) tornado 28.7 miles away from the Martins Ferry city center killed one person and injured 14 people and caused between $50,000 and $500,000 in damages.
On 4/27/1954, a category F2 (max. wind speeds 113-157 mph) tornado 11.7 miles away from the city center injured one person and caused between $50,000 and $500,000 in damages.
Earthquake activity:
Martins Ferry-area historical earthquake activity is significantly above Ohio state average. It is 39% smaller than the overall U.S. average. On 8/23/2011 at 17:51:04, a magnitude 5.8 (5.8 MW, Depth: 3.7 mi, Class: Moderate, Intensity: VI - VII) earthquake occurred 213.1 miles away from Martins Ferry center On 9/25/1998 at 19:52:52, a magnitude 5.2 (4.8 MB, 4.3 MS, 5.2 LG, 4.5 MW, Depth: 3.1 mi) earthquake occurred 97.8 miles away from Martins Ferry center On 1/31/1986 at 16:46:43, a magnitude 5.0 (5.0 MB) earthquake occurred 106.4 miles away from Martins Ferry center On 7/27/1980 at 18:52:21, a magnitude 5.2 (5.1 MB, 4.7 MS, 5.0 UK, 5.2 UK) earthquake occurred 216.7 miles away from the city center On 8/9/2020 at 12:07:37, a magnitude 5.1 (5.1 MW, Depth: 4.7 mi) earthquake occurred 251.4 miles away from the city center On 12/31/2011 at 20:05:01, a magnitude 4.0 (4.0 ML, Depth: 3.1 mi, Class: Light, Intensity: IV - V) earthquake occurred 70.7 miles away from Martins Ferry center Magnitude types: regional Lg-wave magnitude (LG), body-wave magnitude (MB), local magnitude (ML), surface-wave magnitude (MS), moment magnitude (MW) Natural disasters: The number of natural disasters in Belmont County (19) is greater than the US average (15).Major Disasters (Presidential) Declared: 13Emergencies Declared: 3Floods: 12, Storms: 11, Tornadoes: 4, Landslides: 3, Mudslides: 3, Snowstorms: 2, Winds: 2, Blizzard: 1, Heavy Rain: 1, Hurricane: 1, Tropical Storm: 1, Winter Storm: 1, Other: 1 (Note: some incidents may be assigned to more than one category). Main business address for: UNITED BANCORP INC /OH/ STATE COMMERCIAL BANKS ).
Hospitals and medical centers in Martins Ferry: EAST OHIO REGIONAL HOSPITAL (Voluntary non-profit - Other, provides emergency services, 90 NORTH FOURTH STREET) EAST OHIO REGIONAL HOSPITAL (90 NORTH FOURTH STREET)
VALLEY VIEW NURSING HOME (56143 COLERAIN PIKE)
Amtrak station near Martins Ferry: 3 miles: WHEELING (70 12TH ST.) - Bus Station Colleges/universities with over 2000 students nearest to Martins Ferry:
West Liberty University (about 8 miles; West Liberty, WV ; Full-time enrollment: 2,728)
Franciscan University of Steubenville (about 20 miles; Steubenville, OH ; FT enrollment: 2,572)
Waynesburg University (about 32 miles; Waynesburg, PA ; FT enrollment: 2,080)
Pittsburgh Technical Institute (about 36 miles; Oakdale, PA ; FT enrollment: 2,805)
Robert Morris University (about 40 miles; Moon Township, PA ; FT enrollment: 4,823)
Community College of Allegheny County (about 45 miles; Pittsburgh, PA ; FT enrollment: 13,486)
California University of Pennsylvania (about 45 miles; California, PA ; FT enrollment: 7,773)
Public high school in Martins Ferry:
Private high school in Martins Ferry: SPEIRO ACADEMY Students: 28, Location: 500 N 5TH ST, Grades: KG-12)
Public elementary/middle school in Martins Ferry:
Private elementary/middle schools in Martins Ferry: ST MARY CENTRAL SCHOOL Students: 130, Location: 24 N 4TH ST, Grades: PK-8)
MARTINS FERRY CHRISTIAN SCHOOL Students: 71, Location: 710 S ZANE HWY, Grades: KG-7)
See full list of schools located in Martins Ferry Library in Martins Ferry: MARTINS FERRY PUBLIC LIBRARY Operating income: $1,203,037; Location: 20 JAMES WRIGHT PLACE; 173,198 books ; 339 e-books ; 8,325 audio materials ; 12,990 video materials ; 7 local licensed databases ; 266 state licensed databases ; 298 print serial subscriptions )
User-submitted facts and corrections:
Lou "The Toe" Groza was also born in Martins Ferry. He was a famous kicker for the Cleavland Browns. The NCAA kicker of the year award is also named after him.
Birthplace of: Charlie Wilson (Ohio politician) - AMericna politician, William Dean Howells - Novelist, Dino Gaudio - Basketball player-coach, Joe Niekro - Baseball player, Lou Groza - Football player, Fred Bruney - Football player and coach, John Havlicek - (born 1940), basketball star, Johnny Lipon - Baseball player and coach, Doc Reisling - Baseball player, Duke Sedgwick - Baseball player.
Belmont County has a predicted average indoor radon screening level greater than 4 pCi/L (pico curies per liter) - Highest Potential Average household size: This city:
2.3 peopleOhio:
2.4 people
Percentage of family households: This city:
59.1%Whole state:
65.0%
Percentage of households with unmarried partners: This city:
8.6%Whole state:
6.8%
Likely homosexual households (counted as self-reported same-sex unmarried-partner households)
Lesbian couples: 0.5% of all households Gay men: 0.2% of all households
82 people in nursing facilities/skilled-nursing facilities in 2010people in hospitals/wards and hospices for chronically ill in 2000people in other hospitals or wards for chronically ill in 2000
Banks with branches in Martins Ferry (2011 data):
The Citizens Savings Bank: Drive-Up Facility at Fourth And Hickory Streets, branch established on 1980/05/12; at Fourth And Hickory Streets, branch established on 1902/01/01. Info updated 2008/09/30: Bank assets: $414.5 mil, Deposits: $330.2 mil, local headquarters , positive income , Commercial Lending Specialization, 20 total offices , Holding Company: United Bancorp, Inc.
The Huntington National Bank: Martins Ferry Branch at 22 South Fourth Street, branch established on 1989/06/30. Info updated 2012/04/02: Bank assets: $54,183.4 mil, Deposits: $44,300.3 mil, headquarters in Columbus, OH, positive income , Commercial Lending Specialization, 878 total offices , Holding Company: Huntington Bancshares Incorporated
PNC Bank, National Association: Martins Ferry Branch at 30 South Fourth Street, branch established on 1891/01/01. Info updated 2012/03/20: Bank assets: $263,309.6 mil, Deposits: $197,343.0 mil, headquarters in Wilmington, DE, positive income , Commercial Lending Specialization, 3085 total offices , Holding Company: Pnc Financial Services Group, Inc., The
For population 15 years and over in Martins Ferry:
Never married: 34.7%Now married: 44.3%Separated: 3.6%Widowed: 8.6%Divorced: 8.8% For population 25 years and over in Martins Ferry:
High school or higher: 90.3%Bachelor's degree or higher: 10.7%Graduate or professional degree: 2.7%Unemployed: 5.6%Mean travel time to work (commute): 25.3 minutes
Education Gini index (Inequality in education) Here:
8.7Ohio average:
11.0
Religion statistics for Martins Ferry, OH (based on Belmont County data)
Religion Adherents Congregations Mainline Protestant 10,012 66 Catholic 8,179 16 Evangelical Protestant 7,732 53 Orthodox 463 3 Other 202 5 Black Protestant 176 1 None 43,636 -
Source: Clifford Grammich, Kirk Hadaway, Richard Houseal, Dale E.Jones, Alexei Krindatch, Richie Stanley and Richard H.Taylor. 2012. 2010 U.S.Religion Census: Religious Congregations & Membership Study. Association of Statisticians of American Religious Bodies. Jones, Dale E., et al. 2002. Congregations and Membership in the United States 2000. Nashville, TN: Glenmary Research Center. Graphs represent county-level data
Food Environment Statistics: Number of grocery stores : 18This county :
2.64 / 10,000 pop.Ohio :
1.89 / 10,000 pop.
Number of supercenters and club stores : 1Belmont County :
0.15 / 10,000 pop.Ohio :
0.13 / 10,000 pop.
Number of convenience stores (no gas) : 12Belmont County :
1.76 / 10,000 pop.State :
1.25 / 10,000 pop.
Number of convenience stores (with gas) : 32This county :
4.69 / 10,000 pop.Ohio :
2.93 / 10,000 pop.
Number of full-service restaurants : 35Here :
5.13 / 10,000 pop.Ohio :
6.25 / 10,000 pop.
Adult diabetes rate : Belmont County :
11.1%Ohio :
10.3%
Adult obesity rate : This county :
29.5%State :
29.1%
Low-income preschool obesity rate : Belmont County :
16.8%Ohio :
11.9%
Health and Nutrition: Healthy diet rate : Martins Ferry:
48.1%Ohio:
50.4%
Average overall health of teeth and gums : This city:
43.3%State:
47.8%
People feeling badly about themselves : People not drinking alcohol at all : This city:
11.1%Ohio:
10.4%
Average hours sleeping at night : Overweight people : This city:
34.6%Ohio:
34.3%
General health condition : Martins Ferry:
53.1%Ohio:
57.0%
Average condition of hearing : Martins Ferry:
75.7%State:
79.1%
More about Health and Nutrition of Martins Ferry, OH Residents
Local government employment and payroll (March 2022)
Function
Full-time employees
Monthly full-time payroll
Average yearly full-time wage
Part-time employees
Monthly part-time payroll
Water Supply
20 $83,377 $50,026 0 $0 Police Protection - Officers
13 $68,359 $63,101 3 $4,659 Streets and Highways
8 $30,887 $46,331 0 $0 Solid Waste Management
8 $29,045 $43,568 0 $0 Police - Other
4 $16,605 $49,815 1 $1,754 Health
3 $10,458 $41,832 20 $24,756 Sewerage
3 $13,786 $55,144 0 $0 Financial Administration
2 $8,091 $48,546 2 $2,390 Other Government Administration
1 $3,031 $36,372 15 $3,537 Other and Unallocable
1 $3,306 $39,672 2 $2,285 Judicial and Legal
0 $0 1 $3,822
Totals for Government
63 $266,945 $50,847 44 $43,203
Martins Ferry government finances - Expenditure in 2021 (per resident):
Current Operations - Water Utilities: $3,067,000 ($499.51)
Police Protection: $2,055,000 ($334.69)Solid Waste Management: $946,000 ($154.07)Central Staff Services: $924,000 ($150.49)Regular Highways: $812,000 ($132.25)Local Fire Protection: $578,000 ($94.14)Sewerage: $554,000 ($90.23)Health - Other: $87,000 ($14.17)Financial Administration: $60,000 ($9.77)Judicial and Legal Services: $20,000 ($3.26)General - Other: $16,000 ($2.61)General - Interest on Debt: $70,000 ($11.40)
Intergovernmental to State - Sewerage: $793,000 ($129.15)
General - Other: $61,000 ($9.93)Other Capital Outlay - Sewerage: $217,000 ($35.34)
General - Other: $174,000 ($28.34)Water Utilities: $156,000 ($25.41)Regular Highways: $26,000 ($4.23)Total Salaries and Wages: $3,242,000 ($528.01)
Water Utilities - Interest on Debt: $125,000 ($20.36)
Martins Ferry government finances - Revenue in 2021 (per resident):
Charges - Solid Waste Management: $896,000 ($145.93)
Other: $812,000 ($132.25)Sewerage: $6,000 ($0.98)Miscellaneous - General Revenue - Other: $330,000 ($53.75)
Fines and Forfeits: $115,000 ($18.73)Special Assessments: $77,000 ($12.54)Interest Earnings: $38,000 ($6.19)Sale of Property: $29,000 ($4.72)Rents: $9,000 ($1.47)Donations From Private Sources: $3,000 ($0.49)Revenue - Water Utilities: $4,621,000 ($752.61)
State Intergovernmental - Highways: $486,000 ($79.15)
General Local Government Support: $329,000 ($53.58)Other: $191,000 ($31.11)Tax - Individual Income: $1,636,000 ($266.45)
Property: $715,000 ($116.45)Other Selective Sales: $89,000 ($14.50)Other License: $86,000 ($14.01)
Martins Ferry government finances - Debt in 2021 (per resident):
Long Term Debt - Beginning Outstanding - Unspecified Public Purpose: $2,022,000 ($329.32)
Outstanding Unspecified Public Purpose: $1,632,000 ($265.80)Retired Unspecified Public Purpose: $390,000 ($63.52)
Martins Ferry government finances - Cash and Securities in 2021 (per resident):
Other Funds - Cash and Securities: $2,189,000 ($356.51)
Businesses in Martins Ferry, OH
Name Count Name Count
CVS 1 McDonald's 1 Dairy Queen 1 Subway 1 FedEx 1 True Value 1 H&R Block 1 U-Haul 1 Kroger 1 Wendy's 1 Lane Furniture 1
Strongest AM radio stations in Martins Ferry:
WKKX (1600 AM; 5 kW; WHEELING, WV; Owner: SCOTT RADIO GROUP, LLC)
WWVA (1170 AM; 53 kW; WHEELING, WV; Owner: CAPSTAR TX LIMITED PARTNERSHIP)
WBBD (1400 AM; 1 kW; WHEELING, WV; Owner: CAPSTAR TX LIMITED PARTNERSHIP)
WOMP (1290 AM; 1 kW; BELLAIRE, OH)
WVLY (1370 AM; 5 kW; MOUNDSVILLE, WV; Owner: SCOTT RADIO GROUP, LLC)
KDKA (1020 AM; 50 kW; PITTSBURGH, PA; Owner: INFINITY BROADCASTING OPERATIONS, INC.)
WWCS (540 AM; 5 kW; CANONSBURG, PA; Owner: BIRACH BROADCASTING CORPORATION)
WKNR (850 AM; 50 kW; CLEVELAND, OH; Owner: CARON BROADCASTING, INC.)
WTVN (610 AM; 50 kW; COLUMBUS, OH; Owner: CITICASTERS LICENSES, L.P.)
WTAM (1100 AM; 50 kW; CLEVELAND, OH; Owner: JACOR BROADCASTING CORPORATION)
WHK (1220 AM; 50 kW; CLEVELAND, OH; Owner: CARON BROADCASTING, INC.)
WPIT (730 AM; 5 kW; PITTSBURGH, PA; Owner: PENNSYLVANIA MEDIA ASSOCIATES, INC.)
WKHB (620 AM; 6 kW; IRWIN, PA; Owner: BROADCAST COMMUNICATIONS, INC.)
Strongest FM radio stations in Martins Ferry:
WKWK-FM (97.3 FM; WHEELING, WV; Owner: CAPSTAR TX LIMITED PARTNERSHIP)
W216AU (91.1 FM; MARTINS FERRY, OH; Owner: AMERICAN FAMILY ASSOCIATION)
WOVK (98.7 FM; WHEELING, WV; Owner: CAPSTAR TX LIMITED PARTNERSHIP)
WEGW (107.5 FM; WHEELING, WV; Owner: CAPSTAR TX LIMITED PARTNERSHIP)
WEEL (95.7 FM; SHADYSIDE, OH; Owner: OHIO VALLEY COMMUNICATIONS, INC.)
WVKF (105.5 FM; BETHLEHEM, WV; Owner: CAPSTAR TX LIMITED PARTNERSHIP)
WOMP-FM (100.5 FM; BELLAIRE, OH; Owner: KEYMARKET LICENSES, LLC)
WOGH (103.5 FM; BURGETTSTOWN, PA; Owner: KEYMARKET LICENSES, LLC)
WVNP (89.9 FM; WHEELING, WV; Owner: WEST VIRGINIA EDUCATIONAL BROADCASTING AUTHORITY)
WRKP (96.5 FM; MOUNDSVILLE, WV; Owner: RKP INTERNATIONAL CORP.)
WVBC (88.1 FM; BETHANY, WV; Owner: BETHANY COLLEGE)
WGLZ (91.5 FM; WEST LIBERTY, WV; Owner: WEST LIBERTY STATE COLLEGE)
W215BC (90.9 FM; STEUBENVILLE, OH; Owner: PENSACOLA CHRISTIAN COLLEGE, INC.)
WCDK (106.3 FM; CADIZ, OH; Owner: PRIORITY COMMUNICATIONS OHIO, LLC)
W204BE (88.7 FM; WHEELING, WV; Owner: PENSACOLA CHRISTIAN COLLEGE, INC.)
WBNV (93.5 FM; BARNESVILLE, OH; Owner: W. GRANT HAFLEY)
WOGF (104.3 FM; EAST LIVERPOOL, OH; Owner: KEYMARKET LICENSES, LLC)
WOUC-FM (89.1 FM; CAMBRIDGE, OH; Owner: OHIO UNIVERSITY)
WANB-FM (103.1 FM; WAYNESBURG, PA; Owner: BROADCAST COMMUNICATIONS, INC.)
WBJV (88.9 FM; STEUBENVILLE, OH; Owner: AMERICAN FAMILY ASSOCIATION)
TV broadcast stations around Martins Ferry:
WTRF-TV (Channel 7; WHEELING, WV; Owner: WEST VIRGINIA MEDIA HOLDINGS, LLC)
W28AS (Channel 28; BRIDGEPORT, OH; Owner: TURNPIKE TELEVISION)
W56DX (Channel 56; WHEELING,ETC., WV; Owner: ABACUS TELEVISION)
WTOV-TV (Channel 9; STEUBENVILLE, OH; Owner: WTOV-TV HOLDINGS, INC.)
WOUC-TV (Channel 44; CAMBRIDGE, OH; Owner: OHIO UNIVERSITY)
W41AA (Channel 41; WHEELING, WV; Owner: WEST VIRGINIA EDUCATIONAL BROADCASTING AUTHORITY)
W25CI (Channel 25; STEUBENVILLE, OH; Owner: ABACUS TELEVISION)
W57BH (Channel 57; WEIRTON, WV; Owner: TURNPIKE TELEVISION)
National Bridge Inventory (NBI) Statistics 15 Number of bridges125ft / 37.9m Total length88,620 Total average daily traffic8,548 Total average daily truck traffic
New bridges - historical statistics
2 1940-1949 1 1950-1959 3 1960-1969 4 1970-1979 2 1990-1999 1 2000-2009 2 2010-2019
See full National Bridge Inventory statistics for Martins Ferry, OH
FCC Registered Antenna Towers: 21 (
See the full list of FCC Registered Antenna Towers in Martins Ferry )
FCC Registered Broadcast Land Mobile Towers: 8 (
See the full list of FCC Registered Broadcast Land Mobile Towers in Martins Ferry, OH )
FCC Registered Microwave Towers: 1
STATION, Eorh 90 N 4th St (Lat: 40.067833 Lon: -80.718944), Structure height: 18.6 m, Call Sign: WNTS477, Assigned Frequencies: 22175.0 MHz, 22375.0 MHz, Grant Date: 10/04/2008, Expiration Date: 08/31/2018, Cancellation Date: 11/03/2018, Registrant: Ohio Valley Medical Center, 2000 Eoff Street, Wheeling, WV 26003, Phone: (304) 234-8650, Fax: (304) 234-8571, Email:
FCC Registered Paging Towers: 2
904 N. 4th Street (Lat: 40.098111 Lon: -80.719778), Call Sign: KSV893, Assigned Frequencies: 158.700 MHz, Grant Date: 05/11/1999, Expiration Date: 04/01/2009, Cancellation Date: 05/23/2009, Certifier: A V Lauttamus Ii, Registrant: Attorney At Law, 2154 Wisconsin Avenue, Nw, Ste 250, Washington, DC 20007-2280, Phone: (202) 223-3772, Fax: (202) 315-3587, Email:
Catv Tower On Hill, 1 Mi. N Of Martins Ferry (Lat: 40.112000 Lon: -80.718389), Overall height: 118 m, Call Sign: WXS204, Assigned Frequencies: 454.325 MHz, Grant Date: 04/16/2019, Expiration Date: 04/01/2029, Certifier: Mark Staley, Registrant: Triconnex LP, 2 - 22nd Street, Suite 100, Wheeling, WV 26003, Phone: (888) 718-0709, Email:
FCC Registered Amateur Radio Licenses: 51 (
See the full list of FCC Registered Amateur Radio Licenses in Martins Ferry )
FAA Registered Aircraft: 1
Aircraft: PIPER PA-28R-201T (Category: Land, Seats: 4, Weight: Up to 12,499 Pounds, Speed: 108 mph), Engine: CONT MOTOR TSIO-360 SER (225 HP) (Reciprocating)N-Number: 44995, N44995, N-44995, Serial Number: 28R-7703352, Year manufactured: 1977, Airworthiness Date: 09/02/1977, Certificate Issue Date: 03/06/2012Registrant (Individual): Charles E Scherich, 56122 Deep Run Rd, Martins Ferry, OH 43935Deregistered: Cancel Date: 08/10/2018
Home Mortgage Disclosure Act Aggregated Statistics For Year 2009(Based on 1 full and 2 partial tracts) A) FHA, FSA/RHS & VA B) Conventional C) Refinancings D) Home Improvement Loans F) Non-occupant Loans on G) Loans On Manufactured Number Average Value Number Average Value Number Average Value Number Average Value Number Average Value Number Average Value
LOANS ORIGINATED 13 $68,399 12 $42,091 19 $61,128 13 $22,797 7 $41,117 0 $0 APPLICATIONS APPROVED, NOT ACCEPTED 1 $80,110 0 $0 3 $90,693 2 $12,155 0 $0 1 $63,000 APPLICATIONS DENIED 3 $73,337 5 $51,922 22 $60,813 6 $14,737 5 $46,918 0 $0 APPLICATIONS WITHDRAWN 0 $0 1 $100,000 5 $88,134 0 $0 1 $100,000 0 $0 FILES CLOSED FOR INCOMPLETENESS 0 $0 1 $28,040 2 $68,205 0 $0 0 $0 0 $0
Aggregated Statistics For Year 2008(Based on 1 full and 2 partial tracts) A) FHA, FSA/RHS & VA B) Conventional C) Refinancings D) Home Improvement Loans F) Non-occupant Loans on G) Loans On Manufactured Number Average Value Number Average Value Number Average Value Number Average Value Number Average Value Number Average Value
LOANS ORIGINATED 12 $65,672 12 $54,328 25 $83,833 18 $24,748 12 $96,168 1 $17,170 APPLICATIONS APPROVED, NOT ACCEPTED 1 $41,770 1 $60,620 2 $55,710 0 $0 2 $46,310 0 $0 APPLICATIONS DENIED 4 $63,545 6 $40,767 26 $71,413 15 $24,985 4 $28,218 1 $15,450 APPLICATIONS WITHDRAWN 2 $64,445 4 $38,438 9 $64,318 2 $31,645 3 $39,147 0 $0 FILES CLOSED FOR INCOMPLETENESS 1 $49,780 0 $0 1 $46,000 0 $0 0 $0 0 $0
Aggregated Statistics For Year 2007(Based on 1 full and 2 partial tracts) A) FHA, FSA/RHS & VA B) Conventional C) Refinancings D) Home Improvement Loans F) Non-occupant Loans on G) Loans On Manufactured Number Average Value Number Average Value Number Average Value Number Average Value Number Average Value Number Average Value
LOANS ORIGINATED 9 $65,407 34 $53,431 41 $50,994 26 $24,483 20 $31,062 0 $0 APPLICATIONS APPROVED, NOT ACCEPTED 0 $0 4 $47,548 2 $74,620 1 $14,880 0 $0 0 $0 APPLICATIONS DENIED 1 $67,500 12 $50,414 41 $84,625 24 $31,996 3 $18,223 2 $29,065 APPLICATIONS WITHDRAWN 0 $0 6 $46,770 13 $59,542 4 $26,455 1 $9,160 0 $0 FILES CLOSED FOR INCOMPLETENESS 0 $0 3 $42,807 3 $116,240 0 $0 0 $0 0 $0
Aggregated Statistics For Year 2006(Based on 1 full and 2 partial tracts) A) FHA, FSA/RHS & VA B) Conventional C) Refinancings D) Home Improvement Loans E) Loans on Dwellings For 5+ Families F) Non-occupant Loans on G) Loans On Manufactured Number Average Value Number Average Value Number Average Value Number Average Value Number Average Value Number Average Value Number Average Value
LOANS ORIGINATED 8 $50,939 31 $56,029 53 $48,237 28 $25,803 0 $0 17 $36,441 0 $0 APPLICATIONS APPROVED, NOT ACCEPTED 0 $0 4 $50,228 11 $34,577 3 $25,337 0 $0 2 $34,620 0 $0 APPLICATIONS DENIED 1 $33,190 14 $55,984 35 $69,344 19 $28,452 1 $52,020 3 $55,703 2 $20,305 APPLICATIONS WITHDRAWN 0 $0 3 $54,140 15 $61,614 3 $32,593 0 $0 2 $50,315 0 $0 FILES CLOSED FOR INCOMPLETENESS 0 $0 3 $32,793 6 $70,533 0 $0 0 $0 0 $0 0 $0
Aggregated Statistics For Year 2005(Based on 1 full and 2 partial tracts) A) FHA, FSA/RHS & VA B) Conventional C) Refinancings D) Home Improvement Loans E) Loans on Dwellings For 5+ Families F) Non-occupant Loans on G) Loans On Manufactured Number Average Value Number Average Value Number Average Value Number Average Value Number Average Value Number Average Value Number Average Value
LOANS ORIGINATED 3 $63,720 28 $47,482 52 $48,693 14 $21,054 0 $0 20 $33,764 0 $0 APPLICATIONS APPROVED, NOT ACCEPTED 0 $0 5 $50,912 11 $59,140 7 $30,137 0 $0 1 $34,900 0 $0 APPLICATIONS DENIED 1 $58,180 15 $42,513 71 $55,234 19 $27,748 0 $0 11 $40,103 1 $40,000 APPLICATIONS WITHDRAWN 0 $0 8 $63,411 26 $66,476 5 $50,594 1 $569,340 2 $47,910 1 $11,440 FILES CLOSED FOR INCOMPLETENESS 0 $0 1 $79,760 5 $59,350 0 $0 0 $0 0 $0 0 $0
Aggregated Statistics For Year 2004(Based on 1 full and 2 partial tracts) A) FHA, FSA/RHS & VA B) Conventional C) Refinancings D) Home Improvement Loans F) Non-occupant Loans on G) Loans On Manufactured Number Average Value Number Average Value Number Average Value Number Average Value Number Average Value Number Average Value
LOANS ORIGINATED 3 $53,987 44 $54,677 61 $49,132 22 $23,763 27 $35,633 1 $39,000 APPLICATIONS APPROVED, NOT ACCEPTED 1 $115,000 5 $57,350 15 $47,430 3 $31,203 1 $19,150 1 $42,770 APPLICATIONS DENIED 1 $121,940 16 $44,886 64 $58,365 27 $16,165 8 $39,266 2 $27,665 APPLICATIONS WITHDRAWN 1 $6,290 3 $43,853 30 $59,803 4 $23,335 3 $38,400 0 $0 FILES CLOSED FOR INCOMPLETENESS 0 $0 1 $74,390 10 $71,700 0 $0 0 $0 0 $0
Aggregated Statistics For Year 2003(Based on 1 full and 2 partial tracts) A) FHA, FSA/RHS & VA B) Conventional C) Refinancings D) Home Improvement Loans E) Loans on Dwellings For 5+ Families F) Non-occupant Loans on Number Average Value Number Average Value Number Average Value Number Average Value Number Average Value Number Average Value
LOANS ORIGINATED 3 $59,523 34 $49,718 98 $47,214 17 $17,648 1 $70,520 20 $53,900 APPLICATIONS APPROVED, NOT ACCEPTED 0 $0 2 $33,280 23 $54,040 1 $8,080 0 $0 1 $34,900 APPLICATIONS DENIED 1 $50,030 9 $37,866 64 $53,996 10 $20,688 0 $0 7 $25,621 APPLICATIONS WITHDRAWN 0 $0 3 $32,967 27 $59,462 0 $0 0 $0 2 $33,385 FILES CLOSED FOR INCOMPLETENESS 3 $39,740 2 $41,805 3 $51,053 0 $0 0 $0 0 $0
Aggregated Statistics For Year 2002(Based on 1 full and 2 partial tracts) A) FHA, FSA/RHS & VA B) Conventional C) Refinancings D) Home Improvement Loans F) Non-occupant Loans on Number Average Value Number Average Value Number Average Value Number Average Value Number Average Value
LOANS ORIGINATED 6 $44,807 36 $51,268 65 $49,293 17 $18,478 14 $50,289 APPLICATIONS APPROVED, NOT ACCEPTED 0 $0 2 $35,190 17 $45,476 2 $15,120 1 $48,640 APPLICATIONS DENIED 1 $18,880 9 $44,518 62 $59,005 9 $13,191 5 $33,362 APPLICATIONS WITHDRAWN 0 $0 2 $45,530 20 $46,898 1 $8,080 1 $43,490 FILES CLOSED FOR INCOMPLETENESS 1 $50,260 1 $28,900 8 $49,852 1 $12,020 0 $0
Aggregated Statistics For Year 2001(Based on 1 full and 2 partial tracts) A) FHA, FSA/RHS & VA B) Conventional C) Refinancings D) Home Improvement Loans E) Loans on Dwellings For 5+ Families F) Non-occupant Loans on Number Average Value Number Average Value Number Average Value Number Average Value Number Average Value Number Average Value
LOANS ORIGINATED 0 $0 40 $40,772 78 $45,224 20 $14,588 1 $389,100 15 $25,117 APPLICATIONS APPROVED, NOT ACCEPTED 0 $0 3 $48,253 21 $49,155 7 $32,446 0 $0 0 $0 APPLICATIONS DENIED 1 $54,280 11 $39,560 74 $48,596 11 $10,907 0 $0 4 $34,638 APPLICATIONS WITHDRAWN 0 $0 6 $37,535 47 $45,115 4 $25,738 0 $0 3 $21,907 FILES CLOSED FOR INCOMPLETENESS 1 $33,000 2 $49,220 8 $45,502 0 $0 0 $0 0 $0
Aggregated Statistics For Year 2000(Based on 1 full and 2 partial tracts) A) FHA, FSA/RHS & VA B) Conventional C) Refinancings D) Home Improvement Loans E) Loans on Dwellings For 5+ Families F) Non-occupant Loans on Number Average Value Number Average Value Number Average Value Number Average Value Number Average Value Number Average Value
LOANS ORIGINATED 4 $55,352 38 $35,969 51 $43,392 29 $12,180 1 $38,000 16 $25,341 APPLICATIONS APPROVED, NOT ACCEPTED 0 $0 5 $54,942 21 $43,270 4 $19,915 0 $0 1 $23,000 APPLICATIONS DENIED 1 $89,390 20 $43,618 46 $40,481 20 $14,688 0 $0 6 $33,390 APPLICATIONS WITHDRAWN 0 $0 6 $44,600 26 $45,553 3 $19,283 0 $0 0 $0 FILES CLOSED FOR INCOMPLETENESS 0 $0 0 $0 4 $43,635 0 $0 0 $0 0 $0
Aggregated Statistics For Year 1999(Based on 1 full and 2 partial tracts) A) FHA, FSA/RHS & VA B) Conventional C) Refinancings D) Home Improvement Loans E) Loans on Dwellings For 5+ Families F) Non-occupant Loans on Number Average Value Number Average Value Number Average Value Number Average Value Number Average Value Number Average Value
LOANS ORIGINATED 3 $52,177 44 $34,353 63 $41,217 19 $14,457 1 $62,000 18 $27,370 APPLICATIONS APPROVED, NOT ACCEPTED 0 $0 5 $36,930 12 $44,667 2 $17,985 0 $0 2 $19,195 APPLICATIONS DENIED 1 $23,720 17 $53,345 32 $45,575 19 $14,917 0 $0 4 $93,658 APPLICATIONS WITHDRAWN 1 $44,750 8 $36,734 26 $38,285 4 $29,705 0 $0 1 $57,200 FILES CLOSED FOR INCOMPLETENESS 0 $0 1 $87,940 7 $45,873 0 $0 0 $0 1 $50,190
Detailed HMDA statistics for the following Tracts:
0119.00
, 0120.00 , 0121.00
Private Mortgage Insurance Companies Aggregated Statistics For Year 2009(Based on 1 full and 1 partial tracts) A) Conventional B) Refinancings Number Average Value Number Average Value
LOANS ORIGINATED 1 $53,940 1 $46,000 APPLICATIONS APPROVED, NOT ACCEPTED 0 $0 0 $0 APPLICATIONS DENIED 0 $0 0 $0 APPLICATIONS WITHDRAWN 1 $42,770 0 $0 FILES CLOSED FOR INCOMPLETENESS 0 $0 0 $0
Aggregated Statistics For Year 2008(Based on 1 full and 2 partial tracts) A) Conventional B) Refinancings C) Non-occupant Loans on Number Average Value Number Average Value Number Average Value
LOANS ORIGINATED 6 $64,442 2 $96,395 1 $16,570 APPLICATIONS APPROVED, NOT ACCEPTED 2 $31,370 2 $56,520 1 $9,160 APPLICATIONS DENIED 1 $33,760 0 $0 0 $0 APPLICATIONS WITHDRAWN 0 $0 0 $0 0 $0 FILES CLOSED FOR INCOMPLETENESS 0 $0 0 $0 0 $0
Aggregated Statistics For Year 2007(Based on 2 partial tracts) A) Conventional B) Refinancings C) Non-occupant Loans on Number Average Value Number Average Value Number Average Value
LOANS ORIGINATED 15 $65,324 5 $78,992 2 $38,290 APPLICATIONS APPROVED, NOT ACCEPTED 3 $61,777 1 $41,200 0 $0 APPLICATIONS DENIED 1 $64,640 0 $0 1 $17,720 APPLICATIONS WITHDRAWN 3 $70,147 0 $0 0 $0 FILES CLOSED FOR INCOMPLETENESS 0 $0 0 $0 0 $0
Aggregated Statistics For Year 2006(Based on 1 full and 2 partial tracts) A) Conventional B) Refinancings Number Average Value Number Average Value
LOANS ORIGINATED 13 $61,140 5 $67,080 APPLICATIONS APPROVED, NOT ACCEPTED 2 $57,610 1 $24,030 APPLICATIONS DENIED 0 $0 0 $0 APPLICATIONS WITHDRAWN 1 $38,080 0 $0 FILES CLOSED FOR INCOMPLETENESS 0 $0 0 $0
Aggregated Statistics For Year 2005(Based on 1 full and 2 partial tracts) A) Conventional B) Refinancings C) Non-occupant Loans on Number Average Value Number Average Value Number Average Value
LOANS ORIGINATED 7 $66,809 4 $64,213 1 $25,750 APPLICATIONS APPROVED, NOT ACCEPTED 2 $51,120 2 $69,360 0 $0 APPLICATIONS DENIED 0 $0 0 $0 0 $0 APPLICATIONS WITHDRAWN 1 $33,140 0 $0 0 $0 FILES CLOSED FOR INCOMPLETENESS 0 $0 1 $29,180 0 $0
Aggregated Statistics For Year 2004(Based on 1 full and 2 partial tracts) A) Conventional B) Refinancings C) Non-occupant Loans on Number Average Value Number Average Value Number Average Value
LOANS ORIGINATED 17 $54,482 4 $61,650 2 $34,815 APPLICATIONS APPROVED, NOT ACCEPTED 2 $55,215 2 $59,685 1 $34,330 APPLICATIONS DENIED 0 $0 0 $0 0 $0 APPLICATIONS WITHDRAWN 0 $0 2 $46,920 0 $0 FILES CLOSED FOR INCOMPLETENESS 0 $0 0 $0 0 $0
Aggregated Statistics For Year 2003(Based on 1 full and 2 partial tracts) A) Conventional B) Refinancings C) Non-occupant Loans on Number Average Value Number Average Value Number Average Value
LOANS ORIGINATED 14 $52,366 11 $57,565 1 $38,240 APPLICATIONS APPROVED, NOT ACCEPTED 3 $49,377 3 $47,990 1 $28,610 APPLICATIONS DENIED 0 $0 1 $34,900 0 $0 APPLICATIONS WITHDRAWN 2 $29,185 0 $0 1 $38,340 FILES CLOSED FOR INCOMPLETENESS 0 $0 0 $0 0 $0
Aggregated Statistics For Year 2002(Based on 1 full and 2 partial tracts) A) Conventional B) Refinancings C) Non-occupant Loans on Number Average Value Number Average Value Number Average Value
LOANS ORIGINATED 13 $52,453 12 $68,097 0 $0 APPLICATIONS APPROVED, NOT ACCEPTED 2 $68,415 5 $29,310 2 $22,415 APPLICATIONS DENIED 1 $55,500 0 $0 1 $26,890 APPLICATIONS WITHDRAWN 0 $0 1 $15,330 1 $8,010 FILES CLOSED FOR INCOMPLETENESS 0 $0 0 $0 0 $0
Aggregated Statistics For Year 2001(Based on 1 full and 2 partial tracts) A) Conventional B) Refinancings C) Non-occupant Loans on Number Average Value Number Average Value Number Average Value
LOANS ORIGINATED 15 $45,412 6 $69,890 2 $33,475 APPLICATIONS APPROVED, NOT ACCEPTED 0 $0 0 $0 0 $0 APPLICATIONS DENIED 1 $9,730 0 $0 0 $0 APPLICATIONS WITHDRAWN 0 $0 2 $34,905 0 $0 FILES CLOSED FOR INCOMPLETENESS 0 $0 0 $0 0 $0
Aggregated Statistics For Year 2000(Based on 1 full and 2 partial tracts) A) Conventional B) Refinancings C) Non-occupant Loans on Number Average Value Number Average Value Number Average Value
LOANS ORIGINATED 7 $44,980 2 $62,305 2 $22,205 APPLICATIONS APPROVED, NOT ACCEPTED 1 $52,250 0 $0 0 $0 APPLICATIONS DENIED 0 $0 1 $15,450 1 $15,450 APPLICATIONS WITHDRAWN 1 $29,280 0 $0 0 $0 FILES CLOSED FOR INCOMPLETENESS 0 $0 0 $0 0 $0
Aggregated Statistics For Year 1999(Based on 1 full and 2 partial tracts) A) Conventional B) Refinancings Number Average Value Number Average Value
LOANS ORIGINATED 10 $40,629 5 $65,898 APPLICATIONS APPROVED, NOT ACCEPTED 0 $0 0 $0 APPLICATIONS DENIED 0 $0 0 $0 APPLICATIONS WITHDRAWN 1 $32,350 0 $0 FILES CLOSED FOR INCOMPLETENESS 0 $0 0 $0
Detailed PMIC statistics for the following Tracts:
0119.00
, 0120.00 , 0121.00
Most common first names in Martins Ferry, OH among deceased individuals Name Count Lived (average)
Mary 204 80.0 years John 186 75.2 years William 184 75.9 years George 116 73.1 years Charles 111 75.0 years Joseph 94 74.7 years Margaret 86 78.6 years Anna 86 80.6 years James 84 73.8 years Robert 81 70.3 years
Most common last names in Martins Ferry, OH among deceased individuals Last name Count Lived (average)
Jones 44 75.4 years Smith 44 73.8 years Davis 36 74.7 years Brown 31 78.8 years Williams 29 72.0 years Miller 28 75.4 years Moore 28 71.5 years Harris 27 73.0 years Phillips 27 72.2 years Martin 25 77.3 years
Martins Ferry compared to Ohio state average:
Median household income below state average. Median house value below state average. Unemployed percentage below state average. Black race population percentage significantly below state average. Hispanic race population percentage below state average. Foreign-born population percentage significantly below state average. Length of stay since moving in significantly above state average. House age above state average. Number of college students significantly below state average. Percentage of population with a bachelor's degree or higher below state average. Martins Ferry on our top lists :
#21 on the list of "Top 101 cities with the lowest number of robberies per 100,000 residents (population 5,000+)"
#43 on the list of "Top 101 cities with the largest percentage of people in other hospitals or wards for chronically ill (population 1,000+)"
#51 on the list of "Top 101 cities with the largest percentage of people in hospitals/wards and hospices for chronically ill (population 1,000+)"
#70 (43971) on the list of "Top 101 zip codes with the smallest percentage of taxpayers reporting profit/loss from business in 2012 (pop 1,000+)"
#84 (43935) on the list of "Top 101 zip codes with the lowest charity contributions deductions as a percentage of AGI in 2012 (pop 5,000+)"
#98 (43971) on the list of "Top 101 zip codes with the largest percentage of Greek first ancestries"
#19 on the list of "Top 101 counties with the highest number of deaths per 1000 residents 2007-2013 (pop. 50,000+)"
#41 on the list of "Top 101 counties with the highest Sulfur Oxides Annual air pollution readings in 2012 (µg/m3 )"
#70 on the list of "Top 101 counties with the lowest percentage of residents relocating to other counties in 2011"
#85 on the list of "Top 101 counties with the lowest percentage of residents relocating from other counties between 2010 and 2011 (pop. 50,000+)"
#96 on the list of "Top 101 counties with the lowest surface withdrawal of fresh water for public supply (pop. 50,000+)"
Top Patent Applicants
Michael Paul (1)
William Metzner (1)
Total of 2 patent applications in 2008-2024.


 Recent articles from our blog. Our writers, many of them Ph.D. graduates or candidates, create easy-to-read articles on a wide variety of topics.


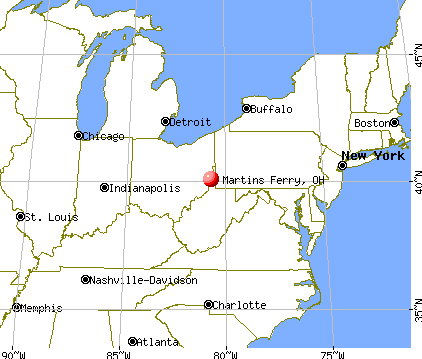
 (46.0 miles
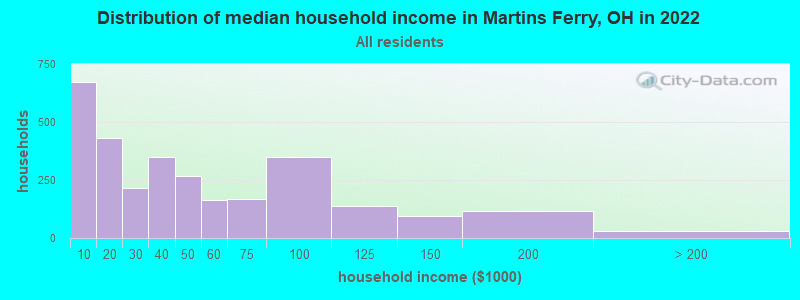
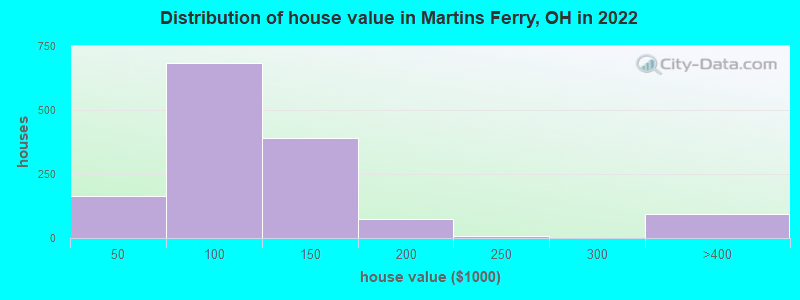
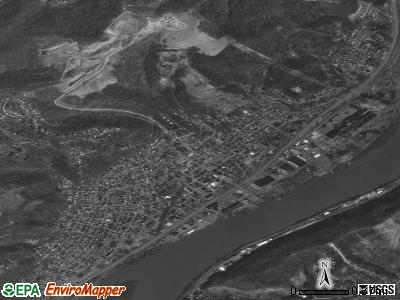
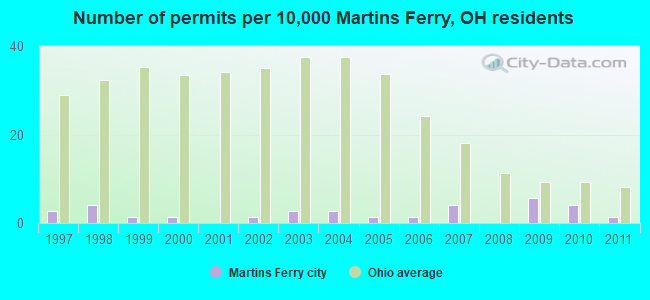
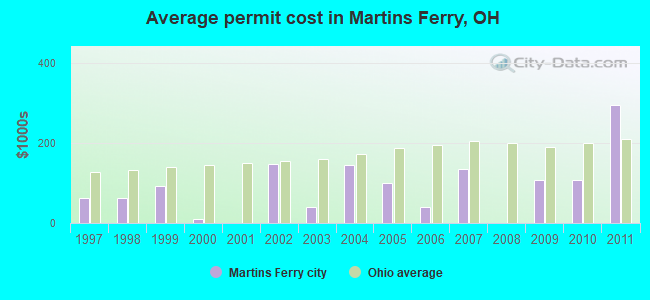
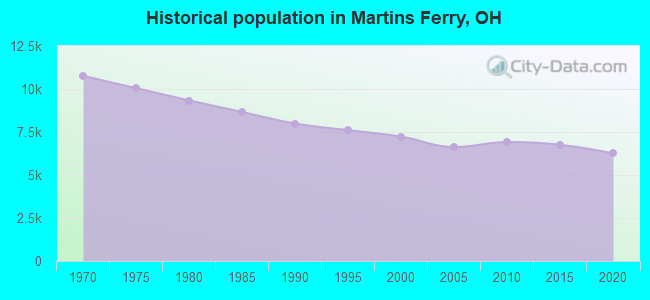
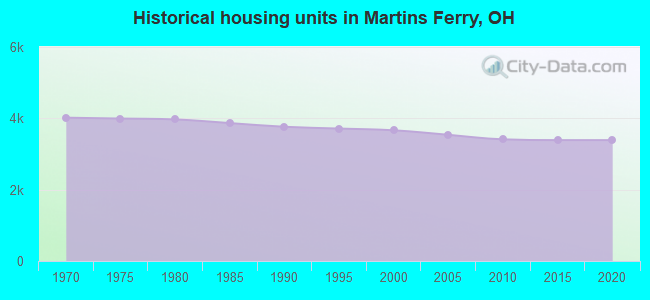
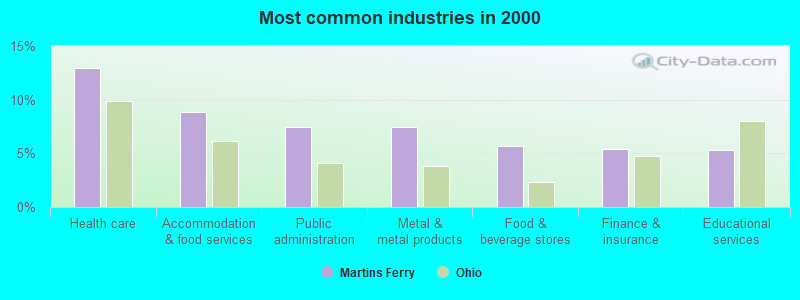
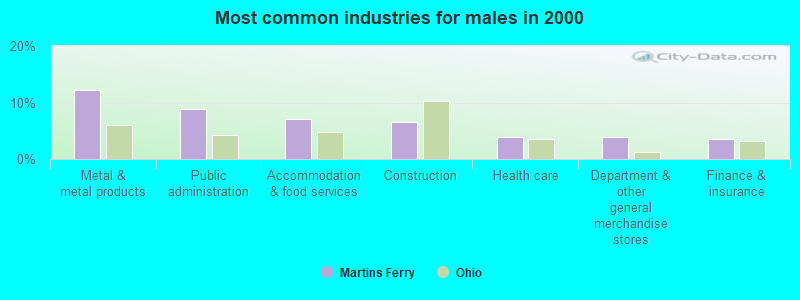
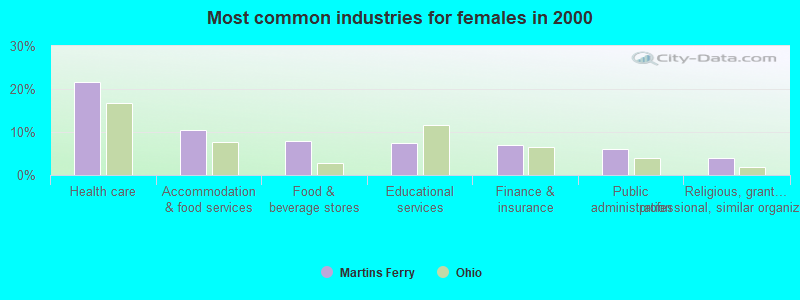
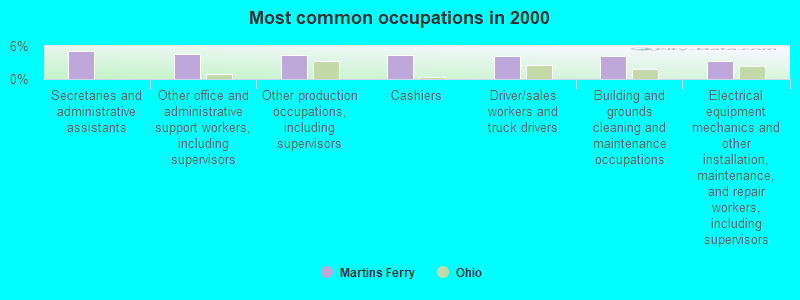
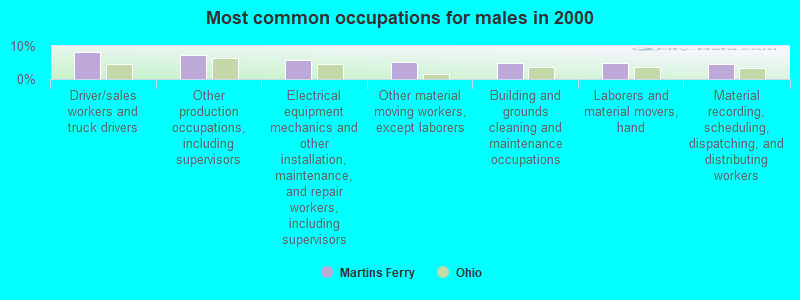
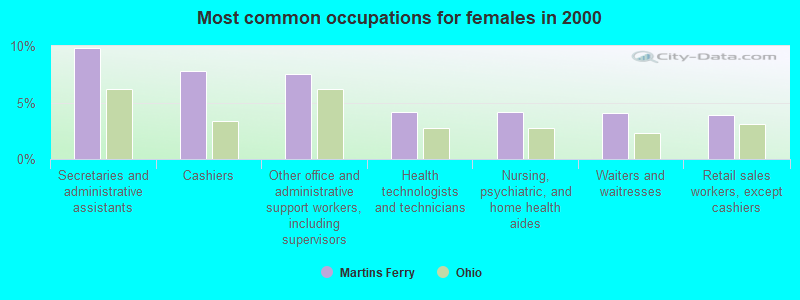


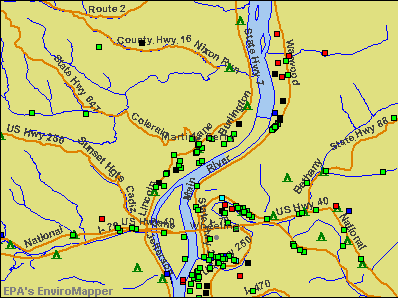

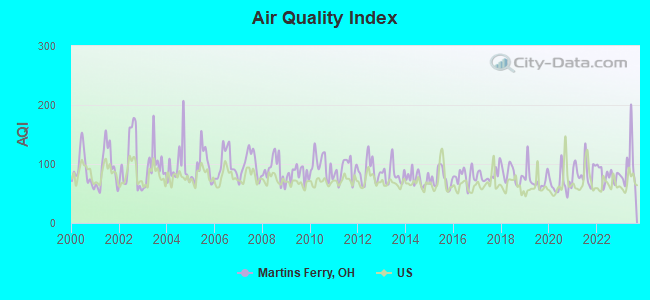
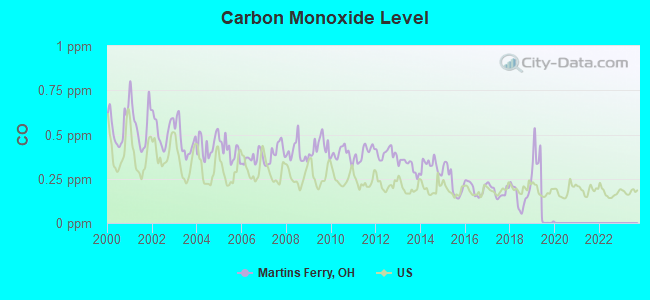
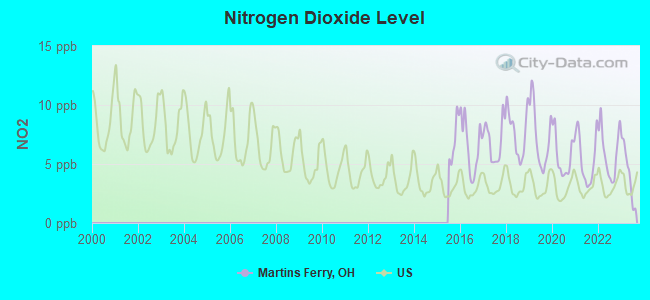
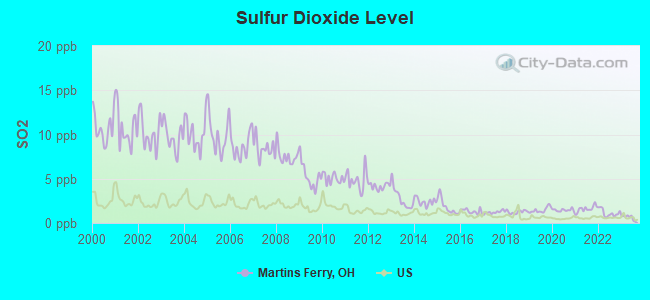
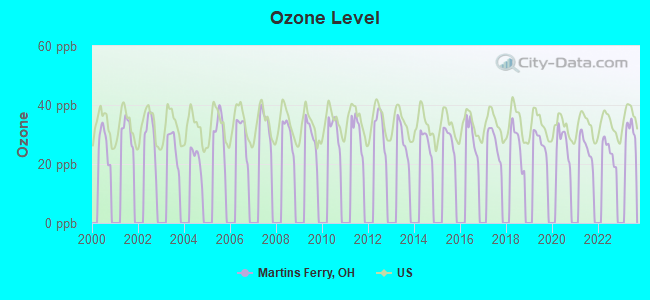
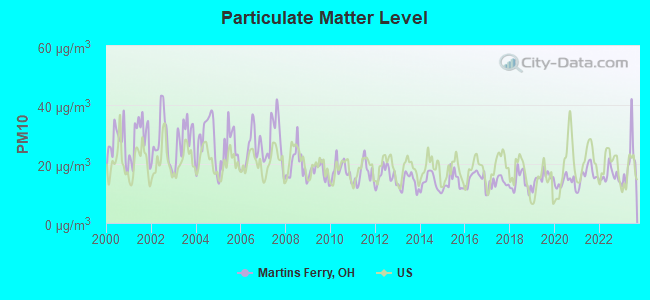
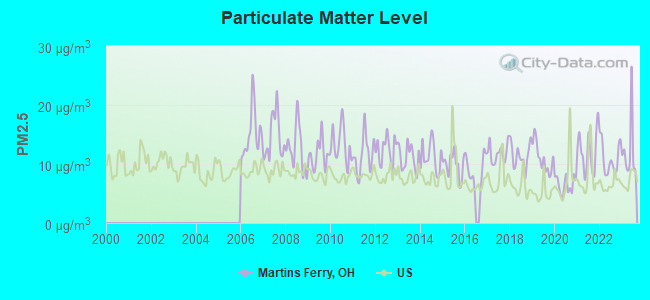
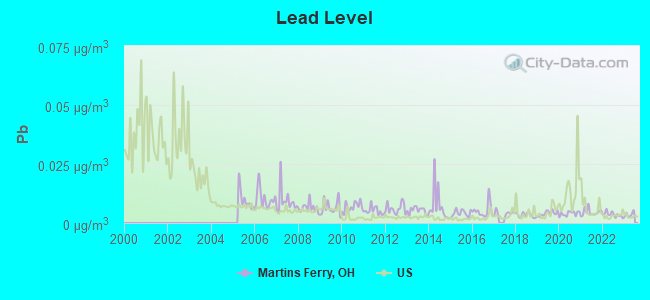
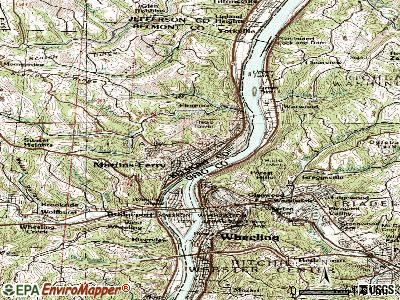
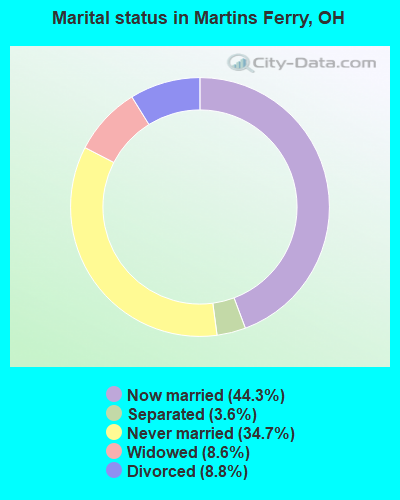
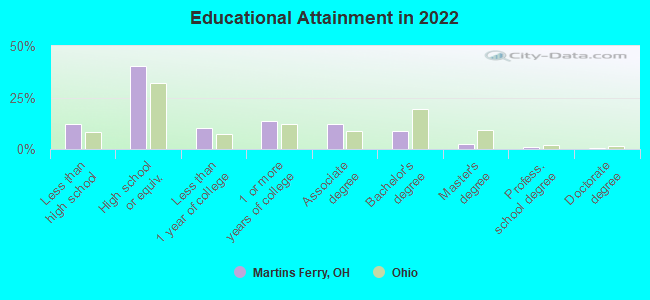
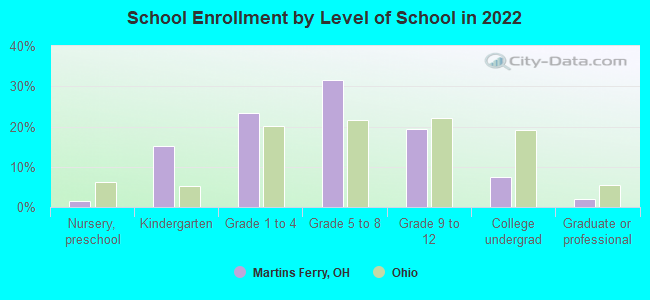
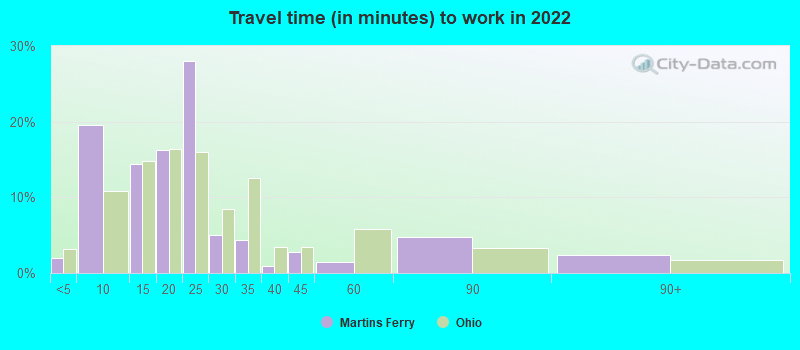
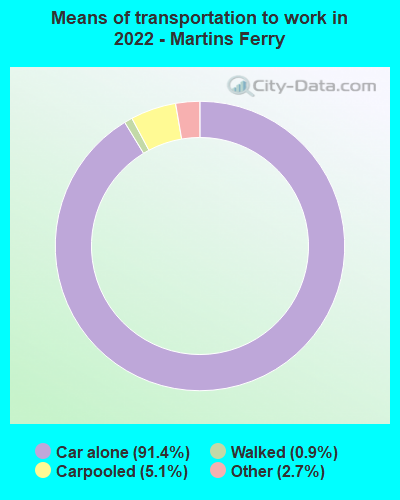
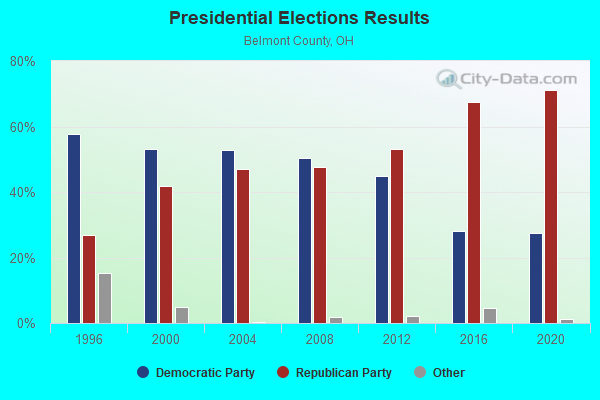
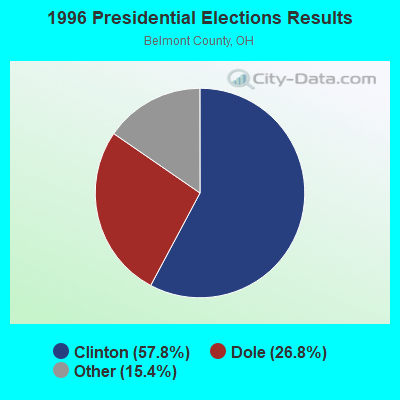
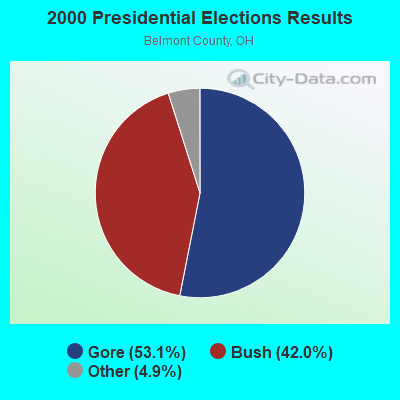
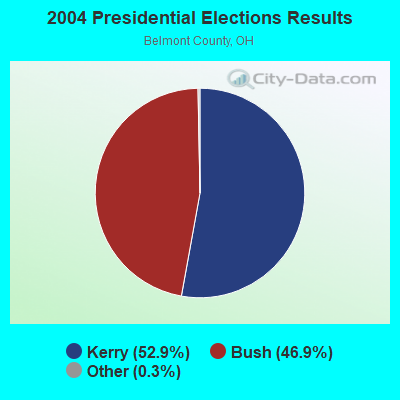
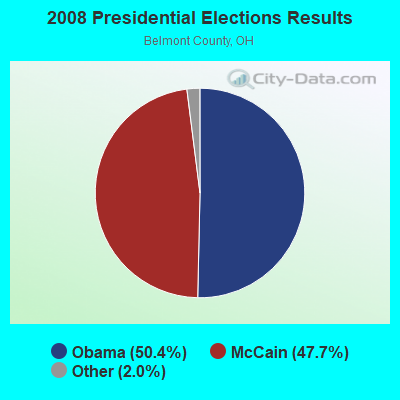
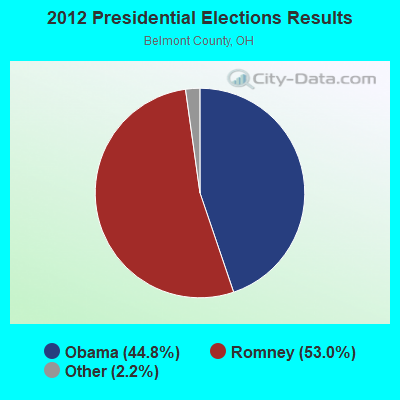
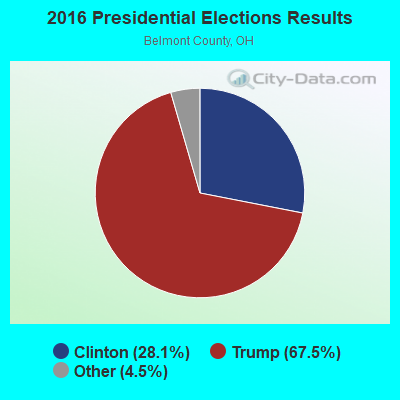
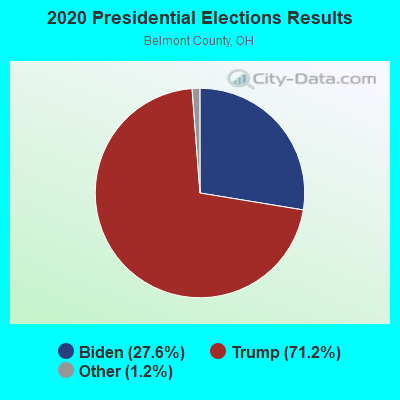
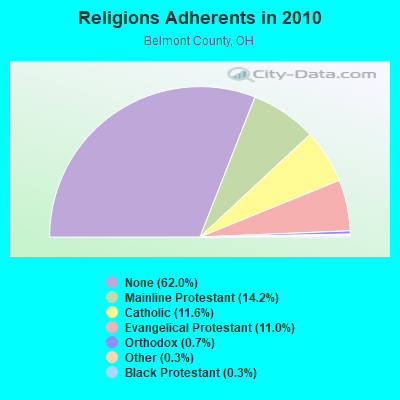
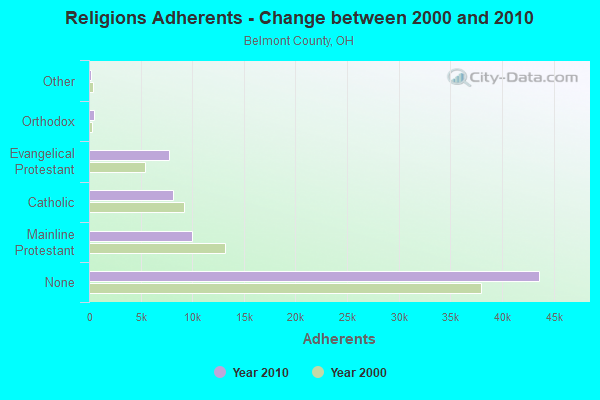
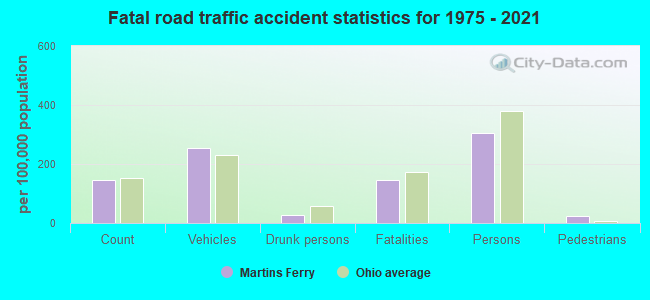
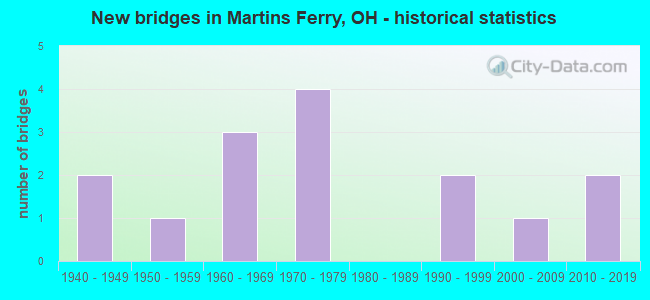
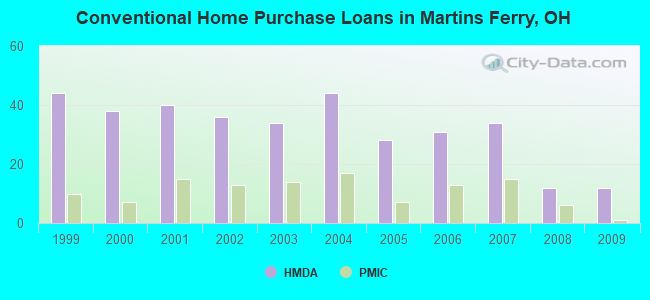
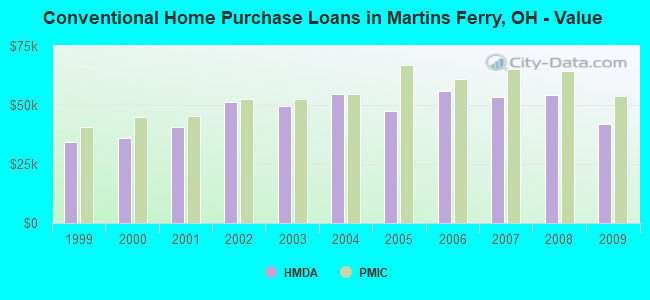
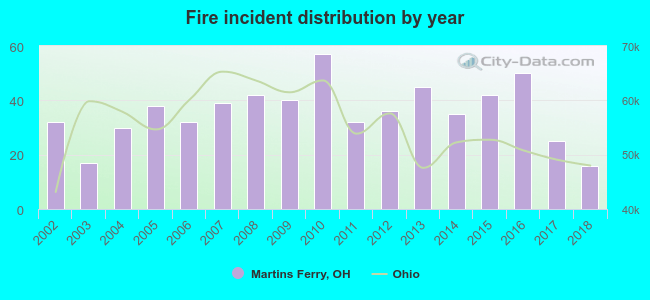 According to the data from the years 2002 - 2018 the average number of fires per year is 36. The highest number of fires - 57 took place in 2010, and the least - 16 in 2018. The data has a decreasing trend.
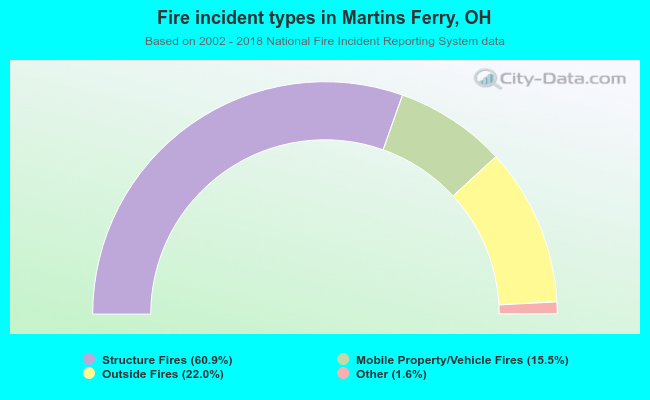 When looking into fire subcategories, the most incidents belonged to: Structure Fires (60.9%), and Outside Fires (22.0%).