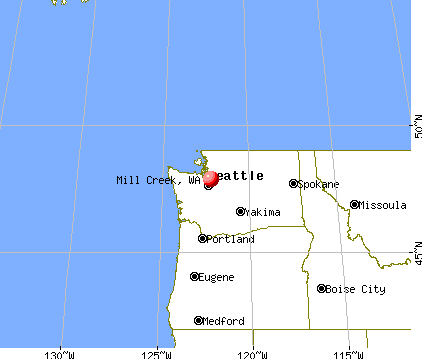
Mill Creek, Washington
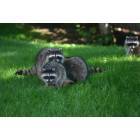
Mill Creek: A family of raccoons in our back yard

Mill Creek: Flowers in the green belt that runs through out Mill Creek
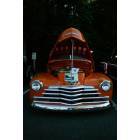
Mill Creek: The annual music in the park and car show runs for several weeks
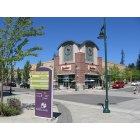
Mill Creek: Street View - Mill Creek Town Center
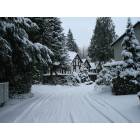
Mill Creek: My house on Mill Fern Dr, Stratford Greens Community, in Mill Creek,WA during the December '08 snow
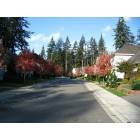
Mill Creek: Fall in Mill Creek WA
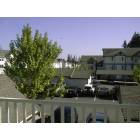
Mill Creek: The Hawthorne apartment complex in Mill Creek.
- add
your


Submit your own pictures of this city and show them to the world
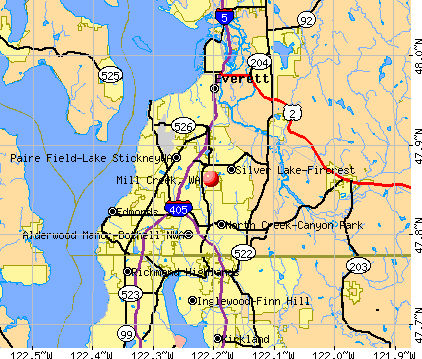
- OSM Map
- General Map
- Google Map
- MSN Map
Population change since 2000: +80.7%
| Males: 9,843 | |
| Females: 10,985 |
| Median resident age: | 38.8 years |
| Washington median age: | 38.4 years |
Zip codes: 98012.
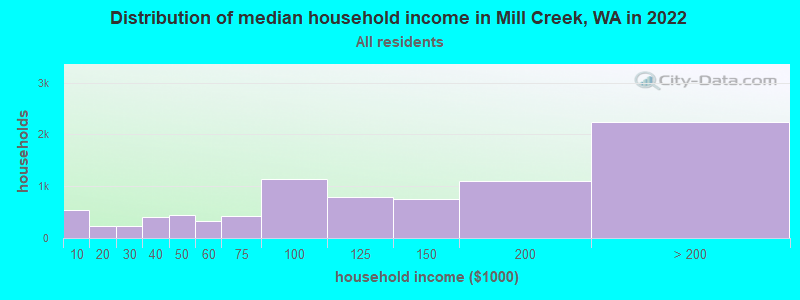
| Mill Creek: | $115,377 |
| WA: | $91,306 |
Estimated per capita income in 2022: $64,070 (it was $36,234 in 2000)
Mill Creek city income, earnings, and wages data
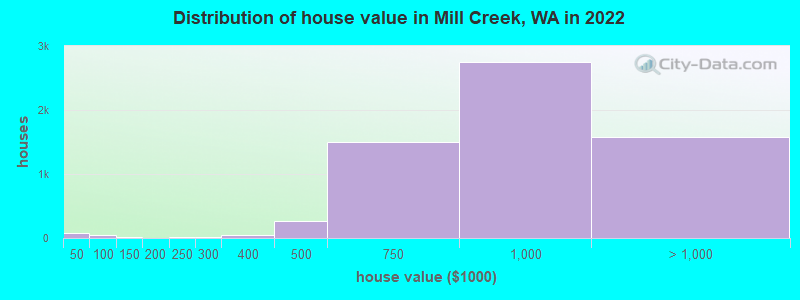
Estimated median house or condo value in 2022: $935,413 (it was $296,300 in 2000)
| Mill Creek: | $935,413 |
| WA: | $569,500 |
Mean prices in 2022: all housing units: $766,619; detached houses: $825,949; townhouses or other attached units: $643,803; in 2-unit structures: $530,516; in 3-to-4-unit structures: $479,562; in 5-or-more-unit structures: $400,308; mobile homes: $303,974; occupied boats, rvs, vans, etc.: $101,172
Median gross rent in 2022: $2,158.
(4.9% for White Non-Hispanic residents, 18.8% for Black residents, 1.0% for Hispanic or Latino residents, 0.5% for two or more races residents)
Detailed information about poverty and poor residents in Mill Creek, WA


Compare current foreclosures near Mill Creek, WA:
| Photo | Address | Area | Beds / Baths | Price | Details |
|---|---|---|---|---|---|

|
#1
14th Ct NE
Seattle, WA 98155
|
1,420 sq. feet
|
2 baths 2 beds |
show details | |

|
#2
Rucker Ave Apt 9
Everett, WA 98201
|
879 sq. feet
|
1 baths 2 beds |
show details | |

|
#3
100th St SW Apt B206
Everett, WA 98204
|
856 sq. feet
|
2 baths 2 beds |
show details | |

|
#4
4th Ave W Apt 6a
Everett, WA 98204
|
1,346 sq. feet
|
3 baths 2 beds |
show details | |

|
#5
Woods Creek Rd
Monroe, WA 98272
|
2,496 sq. feet
|
2 baths 4 beds |
show details | |

|
#6
NE 173rd St
Woodinville, WA 98072
|
2,730 sq. feet
|
2 baths 3 beds |
show details | |

|
#7
NE 190th St
Seattle, WA 98155
|
2,070 sq. feet
|
2 baths 5 beds |
show details | |

|
#8
199th St SW
Bothell, WA 98012
|
2,846 sq. feet
|
2 baths 4 beds |
show details | |

|
#9
Bayview Dr
Mukilteo, WA 98275
|
2,989 sq. feet
|
2 baths 4 beds |
show details | |

|
#10
W Casino Rd Apt 63
Everett, WA 98204
|
1,203 sq. feet
|
2 baths 2 beds |
show details |
| Photo | Address | Area | Beds / Baths | Price | Details |
|---|---|---|---|---|---|

|
#11
NE Serpentine Pl
Seattle, WA 98155
|
1,500 sq. feet
|
1 baths 3 beds |
show details | |

|
#12
Howard Ave NE
Kingston, WA 98346
|
1,008 sq. feet
|
1 baths 2 beds |
show details | |

|
#13
Autumn Ln
Clinton, WA 98236
|
1,940 sq. feet
|
3 baths 2 beds |
show details | |

|
#14
4th Ave W
Everett, WA 98204
|
1,206 sq. feet
|
2 baths 2 beds |
show details | |

|
#15
148th St SE
Everett, WA 98208
|
1,466 sq. feet
|
2 baths 3 beds |
show details | |

|
#16
Chestnut Ct # 15
Everett, WA 98201
|
- sq. feet
|
2 baths 3 beds |
show details | |

|
#17
NE 125th St
Redmond, WA 98052
|
2,660 sq. feet
|
2 baths 3 beds |
show details | |

|
#18
NW 59th St
Seattle, WA 98107
|
1,110 sq. feet
|
1 baths 3 beds |
show details | |

|
#19
NE 172nd St
Duvall, WA 98019
|
3,780 sq. feet
|
3 baths 4 beds |
show details | |

|
#20
176th St SW
Lynnwood, WA 98037
|
936 sq. feet
|
1 baths 3 beds |
show details |
| Photo | Address | Area | Beds / Baths | Price | Details |
|---|---|---|---|---|---|

|
#21
Herring Street And 4361 Douglas Street
Langley, WA 98260
|
1,191 sq. feet
|
1 baths 2 beds |
show details | |

|
#22
51st Ave NE
Seattle, WA 98115
|
2,450 sq. feet
|
2 baths 4 beds |
show details | |

|
#23
58th St NE
Marysville, WA 98270
|
6,934 sq. feet
|
7 baths 9 beds |
show details | |

|
#24
Heintz Ave SE
Monroe, WA 98272
|
1,455 sq. feet
|
2 baths 3 beds |
show details | |

|
#25
39th Ave NE
Seattle, WA 98115
|
2,580 sq. feet
|
2 baths 4 beds |
show details | |

|
#26
59th Ave SE
Snohomish, WA 98296
|
2,641 sq. feet
|
2 baths 5 beds |
show details | |

|
#27
58th Ln NE
Kenmore, WA 98028
|
2,700 sq. feet
|
2 baths 3 beds |
show details | |

|
#28
Leonard Dr
Everett, WA 98201
|
1,000 sq. feet
|
1 baths 3 beds |
show details | |

|
#29
Interurban Blvd
Snohomish, WA 98296
|
1,156 sq. feet
|
1 baths 3 beds |
show details | |

|
#30
NE 142nd Pl
Kirkland, WA 98034
|
1,830 sq. feet
|
2 baths 3 beds |
show details |
| Photo | Address | Area | Beds / Baths | Price | Details |
|---|---|---|---|---|---|

|
#31
91st Ave W
Edmonds, WA 98026
|
1,504 sq. feet
|
1 baths 3 beds |
show details | |

|
#32
1st Ave NE
Seattle, WA 98115
|
1,110 sq. feet
|
1 baths 4 beds |
show details | |

|
#33
63rd Pl NE
Marysville, WA 98270
|
2,082 sq. feet
|
2 baths 4 beds |
show details | |

|
#34
2nd Ave NW
Seattle, WA 98177
|
1,660 sq. feet
|
2 baths 3 beds |
show details | |

|
#35
NE 88th St
Seattle, WA 98115
|
2,200 sq. feet
|
2 baths 3 beds |
show details | |

|
#36
Wetmore Ave
Everett, WA 98203
|
1,200 sq. feet
|
1 baths 3 beds |
show details | |

|
#37
NE Woodinville Duvall Rd
Woodinville, WA 98072
|
1,520 sq. feet
|
1 baths 2 beds |
show details | |

|
#38
2nd Ave SE
Bothell, WA 98012
|
1,988 sq. feet
|
2 baths 3 beds |
show details | |

|
#39
17th St NE
Lake Stevens, WA 98258
|
1,368 sq. feet
|
2 baths 3 beds |
show details | |

|
#40
28th Dr SE
Everett, WA 98208
|
2,370 sq. feet
|
2 baths 4 beds |
show details |
| Photo | Address | Area | Beds / Baths | Price | Details |
|---|---|---|---|---|---|

|
#41
Stone Ct N
Seattle, WA 98133
|
1,640 sq. feet
|
1 baths 3 beds |
show details | |

|
#42
67th Pl W
Mountlake Terrace, WA 98043
|
2,194 sq. feet
|
2 baths 5 beds |
show details | |

|
#43
7th Pl SE
Lake Stevens, WA 98258
|
1,694 sq. feet
|
2 baths 3 beds |
show details | |

|
#44
78th Pl W
Edmonds, WA 98026
|
2,136 sq. feet
|
2 baths 4 beds |
show details | |

|
#45
Cascadian Way
Bothell, WA 98012
|
1,492 sq. feet
|
2 baths 3 beds |
show details | |

|
#46
NE 64th St
Redmond, WA 98053
|
1,540 sq. feet
|
1 baths 3 beds |
show details | |

|
#47
173rd Pl SE
Monroe, WA 98272
|
1,024 sq. feet
|
2 baths 3 beds |
show details | |

|
#48
Mcallister Rd
Snohomish, WA 98290
|
2,624 sq. feet
|
3 baths 4 beds |
show details | |

|
#49
13th St NE
Lake Stevens, WA 98258
|
832 sq. feet
|
1 baths 3 beds |
show details | |

|
Check over 1 million property listings on Foreclosure.com!
|
browse all offers | |||


- 12,12057.5%White alone
- 4,64122.0%Asian alone
- 1,6027.6%Two or more races
- 1,5427.3%Hispanic
- 9764.6%Black alone
- 2151.0%Native Hawaiian and Other
Pacific Islander alone - 1180.6%Other race alone
- 700.3%American Indian alone
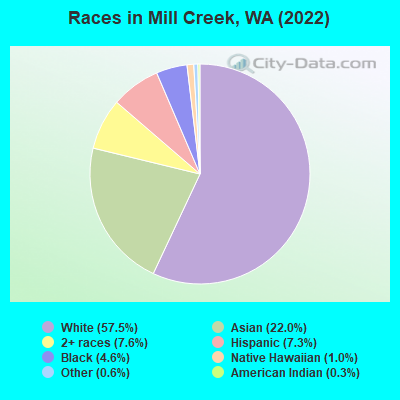
Races in Mill Creek detailed stats: ancestries, foreign born residents, place of birth
According to our research of Washington and other state lists, there was 1 registered sex offender living in Mill Creek, Washington as of April 25, 2024.
The ratio of all residents to sex offenders in Mill Creek is 20,111 to 1.
The ratio of registered sex offenders to all residents in this city is much lower than the state average.
Type |
2009 |
2010 |
2011 |
2012 |
2013 |
2014 |
2015 |
2016 |
2017 |
2018 |
2019 |
2020 |
2021 |
2022 |
|---|---|---|---|---|---|---|---|---|---|---|---|---|---|---|
| Murders (per 100,000) | 0 (0.0) | 0 (0.0) | 0 (0.0) | 2 (10.7) | 0 (0.0) | 0 (0.0) | 1 (5.1) | 0 (0.0) | 1 (4.8) | 0 (0.0) | 0 (0.0) | 0 (0.0) | 0 (0.0) | 1 (4.8) |
| Rapes (per 100,000) | 3 (17.4) | 6 (32.9) | 1 (5.4) | 2 (10.7) | 2 (10.6) | 3 (15.8) | 2 (10.3) | 3 (14.7) | 6 (29.0) | 6 (28.3) | 3 (14.0) | 8 (37.7) | 7 (33.2) | 3 (14.3) |
| Robberies (per 100,000) | 11 (63.7) | 16 (87.7) | 3 (16.2) | 7 (37.5) | 13 (69.1) | 6 (31.6) | 6 (30.9) | 5 (24.5) | 7 (33.9) | 8 (37.7) | 2 (9.4) | 8 (37.7) | 6 (28.5) | 9 (43.0) |
| Assaults (per 100,000) | 16 (92.6) | 17 (93.2) | 12 (64.8) | 23 (123.3) | 12 (63.8) | 16 (84.3) | 12 (61.7) | 8 (39.2) | 31 (150.0) | 5 (23.5) | 14 (65.5) | 21 (99.0) | 14 (66.4) | 23 (109.9) |
| Burglaries (per 100,000) | 108 (625.4) | 91 (498.8) | 90 (485.7) | 63 (337.6) | 51 (271.2) | 49 (258.3) | 72 (370.4) | 88 (431.0) | 65 (314.6) | 52 (244.9) | 26 (121.7) | 40 (188.6) | 57 (270.4) | 95 (454.0) |
| Thefts (per 100,000) | 372 (2,154) | 369 (2,023) | 282 (1,522) | 258 (1,383) | 288 (1,531) | 336 (1,771) | 281 (1,445) | 302 (1,479) | 336 (1,626) | 256 (1,206) | 238 (1,114) | 255 (1,202) | 334 (1,585) | 373 (1,783) |
| Auto thefts (per 100,000) | 25 (144.8) | 46 (252.1) | 29 (156.5) | 27 (144.7) | 43 (228.7) | 57 (300.5) | 38 (195.5) | 35 (171.4) | 45 (217.8) | 27 (127.2) | 27 (126.4) | 38 (179.1) | 47 (223.0) | 59 (282.0) |
| Arson (per 100,000) | 3 (17.4) | 0 (0.0) | 4 (21.6) | 5 (26.8) | 2 (10.6) | 2 (10.5) | 4 (20.6) | 2 (9.8) | 2 (9.7) | 3 (14.1) | 0 (0.0) | 1 (4.7) | 0 (0.0) | 3 (14.3) |
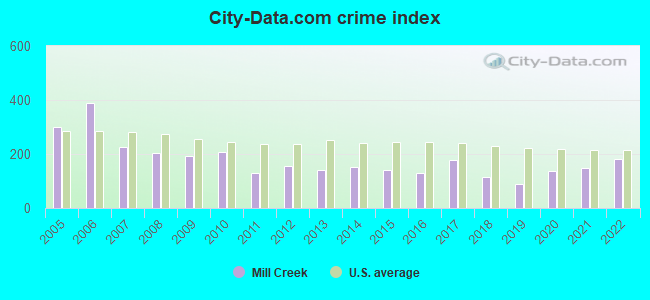
| City-Data.com crime index | 193.1 | 207.2 | 129.5 | 156.4 | 140.5 | 152.0 | 139.5 | 130.0 | 177.6 | 114.2 | 90.4 | 136.9 | 148.6 | 181.6 |
The City-Data.com crime index weighs serious crimes and violent crimes more heavily. Higher means more crime, U.S. average is 246.1. It adjusts for the number of visitors and daily workers commuting into cities.
Crime rate in Mill Creek detailed stats: murders, rapes, robberies, assaults, burglaries, thefts, arson
Full-time law enforcement employees in 2021, including police officers: 23 (20 officers - 19 male; 1 female).
| Officers per 1,000 residents here: | 0.95 |
| Washington average: | 1.35 |
 Recent articles from our blog. Our writers, many of them Ph.D. graduates or candidates, create easy-to-read articles on a wide variety of topics.


Latest news from Mill Creek, WA collected exclusively by city-data.com from local newspapers, TV, and radio stations
Ancestries: English (6.6%), Irish (4.5%), European (4.1%), German (3.9%), Bulgarian (3.6%), American (2.8%).
Current Local Time: PST time zone
Incorporated in 1983
Elevation: 380 feet
Land area: 3.57 square miles.
Population density: 5,840 people per square mile (average).
4,993 residents are foreign born (13.9% Asia, 4.1% Latin America, 3.8% Europe).
| This city: | 23.7% |
| Washington: | 14.9% |
Median real estate property taxes paid for housing units with mortgages in 2022: $6,567 (0.7%)
Median real estate property taxes paid for housing units with no mortgage in 2022: $6,393 (0.7%)
Nearest city with pop. 50,000+: Everett, WA  (7.0 miles , pop. 91,488).
Nearest city with pop. 200,000+: East Seattle, WA (17.1 miles , pop. 480,100).
Nearest city with pop. 1,000,000+: Los Angeles, CA (973.2 miles , pop. 3,694,820).
Nearest cities:
), ), ), ), ), ), )Latitude: 47.86 N, Longitude: 122.20 W
Daytime population change due to commuting: -3,089 (-14.6%)
Workers who live and work in this city: 4,093 (36.8%)
Property values in Mill Creek, WA
Mill Creek, Washington accommodation & food services, waste management - Economy and Business Data
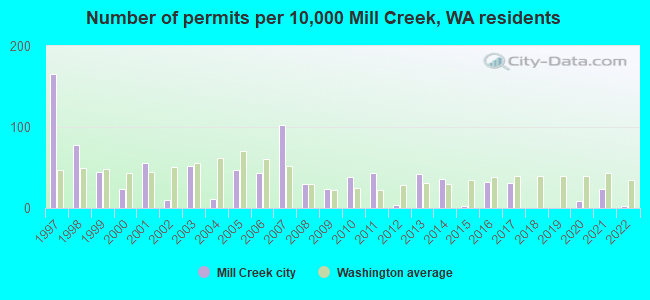
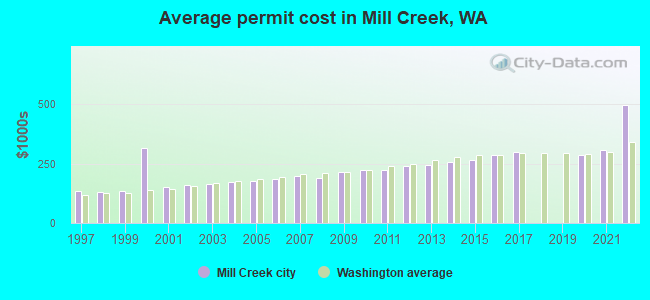
Single-family new house construction building permits:
- 2022: 2 buildings, average cost: $497,100
- 2021: 26 buildings, average cost: $305,700
- 2020: 10 buildings, average cost: $285,800
- 2017: 36 buildings, average cost: $299,000
- 2016: 37 buildings, average cost: $287,500
- 2015: 2 buildings, average cost: $267,200
- 2014: 42 buildings, average cost: $257,500
- 2013: 48 buildings, average cost: $242,900
- 2012: 5 buildings, average cost: $237,700
- 2011: 49 buildings, average cost: $225,000
- 2010: 44 buildings, average cost: $221,700
- 2009: 28 buildings, average cost: $213,000
- 2008: 35 buildings, average cost: $187,800
- 2007: 117 buildings, average cost: $197,900
- 2006: 50 buildings, average cost: $184,200
- 2005: 54 buildings, average cost: $177,500
- 2004: 13 buildings, average cost: $171,000
- 2003: 60 buildings, average cost: $163,500
- 2002: 12 buildings, average cost: $158,600
- 2001: 63 buildings, average cost: $152,100
- 2000: 28 buildings, average cost: $316,400
- 1999: 51 buildings, average cost: $135,900
- 1998: 90 buildings, average cost: $131,100
- 1997: 190 buildings, average cost: $132,600
| Here: | 3.6% |
| Washington: | 4.6% |
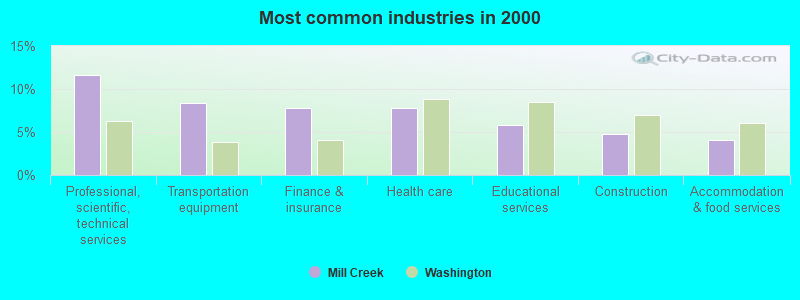
- Professional, scientific, technical services (11.7%)
- Transportation equipment (8.3%)
- Finance & insurance (7.8%)
- Health care (7.8%)
- Educational services (5.9%)
- Construction (4.7%)
- Accommodation & food services (4.0%)
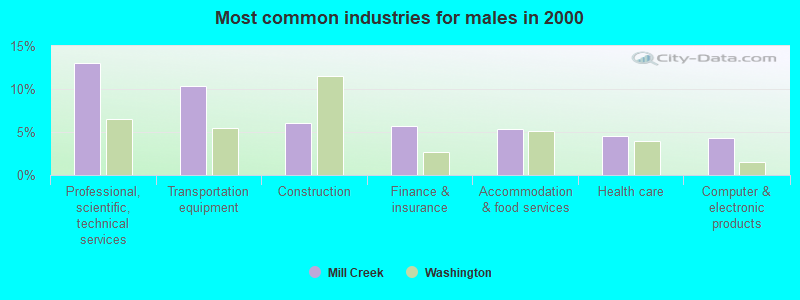
- Professional, scientific, technical services (13.0%)
- Transportation equipment (10.3%)
- Construction (6.1%)
- Finance & insurance (5.8%)
- Accommodation & food services (5.4%)
- Health care (4.5%)
- Computer & electronic products (4.3%)
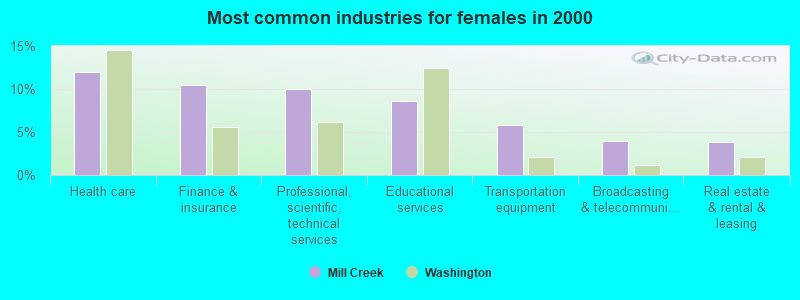
- Health care (12.0%)
- Finance & insurance (10.5%)
- Professional, scientific, technical services (10.0%)
- Educational services (8.6%)
- Transportation equipment (5.8%)
- Broadcasting & telecommunications (3.9%)
- Real estate & rental & leasing (3.9%)
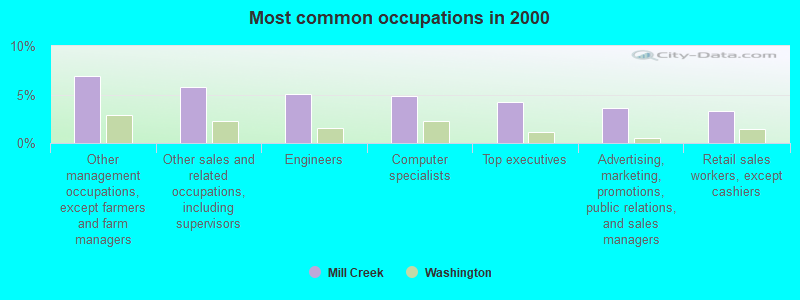
- Other management occupations, except farmers and farm managers (6.9%)
- Other sales and related occupations, including supervisors (5.8%)
- Engineers (5.0%)
- Computer specialists (4.8%)
- Top executives (4.3%)
- Advertising, marketing, promotions, public relations, and sales managers (3.6%)
- Retail sales workers, except cashiers (3.3%)
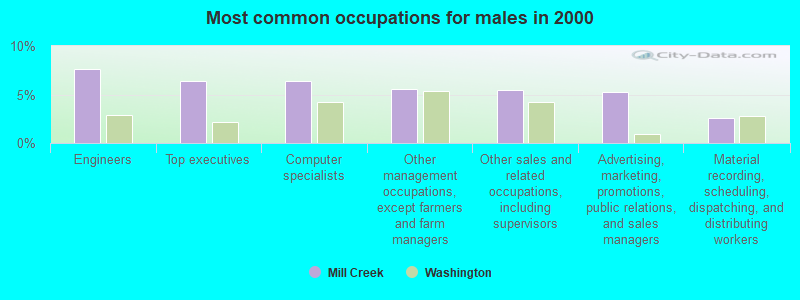
- Engineers (7.6%)
- Top executives (6.4%)
- Computer specialists (6.4%)
- Other management occupations, except farmers and farm managers (5.6%)
- Other sales and related occupations, including supervisors (5.5%)
- Advertising, marketing, promotions, public relations, and sales managers (5.2%)
- Material recording, scheduling, dispatching, and distributing workers (2.6%)
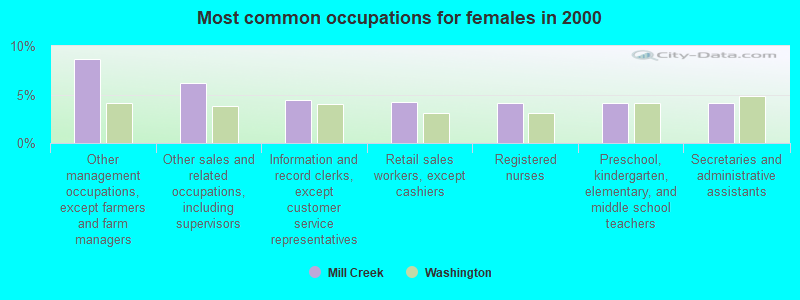
- Other management occupations, except farmers and farm managers (8.7%)
- Other sales and related occupations, including supervisors (6.2%)
- Information and record clerks, except customer service representatives (4.4%)
- Retail sales workers, except cashiers (4.3%)
- Registered nurses (4.1%)
- Preschool, kindergarten, elementary, and middle school teachers (4.1%)
- Secretaries and administrative assistants (4.1%)
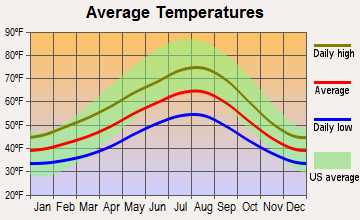
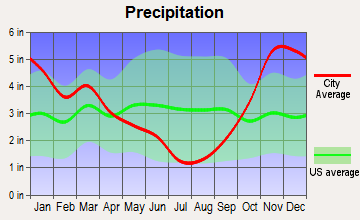
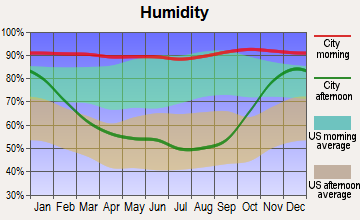
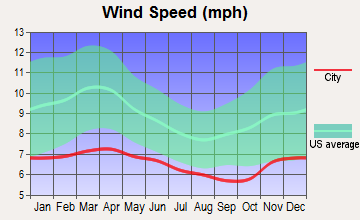
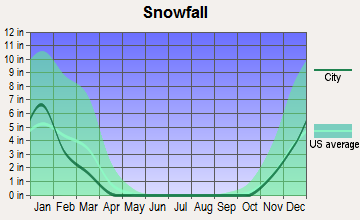
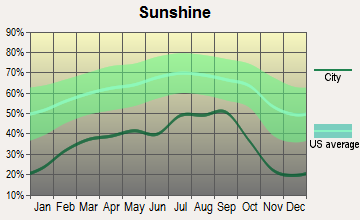
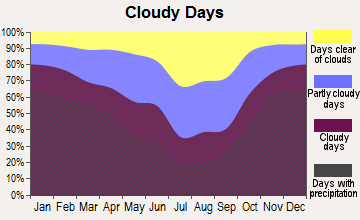
Average climate in Mill Creek, Washington
Based on data reported by over 4,000 weather stations
(lower is better)
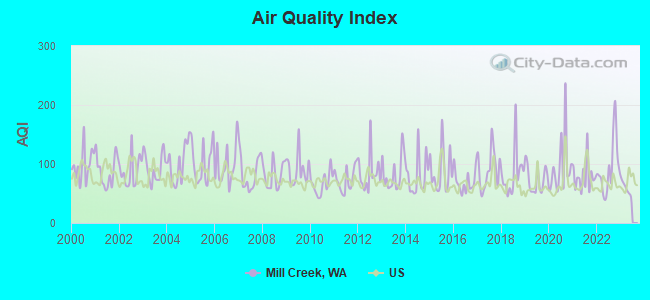
Air Quality Index (AQI) level in 2022 was 93.7. This is worse than average.
| City: | 93.7 |
| U.S.: | 72.6 |
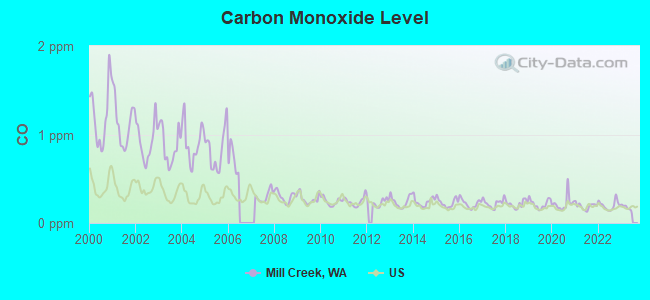
Carbon Monoxide (CO) [ppm] level in 2022 was 0.200. This is better than average. Closest monitor was 5.0 miles away from the city center.
| City: | 0.200 |
| U.S.: | 0.251 |
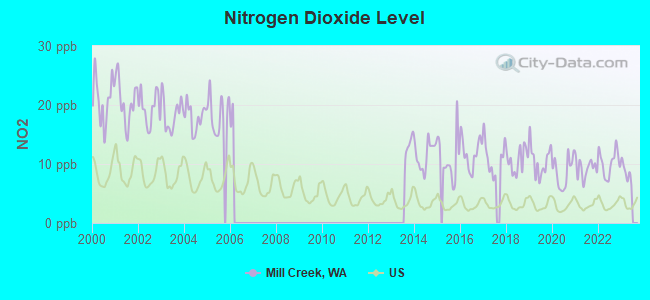
Nitrogen Dioxide (NO2) [ppb] level in 2022 was 10.2. This is significantly worse than average. Closest monitor was 18.8 miles away from the city center.
| City: | 10.2 |
| U.S.: | 5.1 |
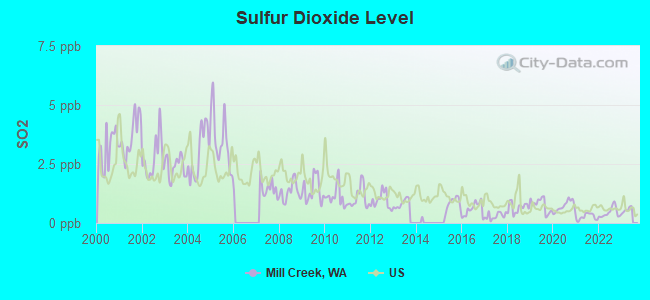
Sulfur Dioxide (SO2) [ppb] level in 2022 was 0.443. This is significantly better than average. Closest monitor was 8.3 miles away from the city center.
| City: | 0.443 |
| U.S.: | 1.515 |
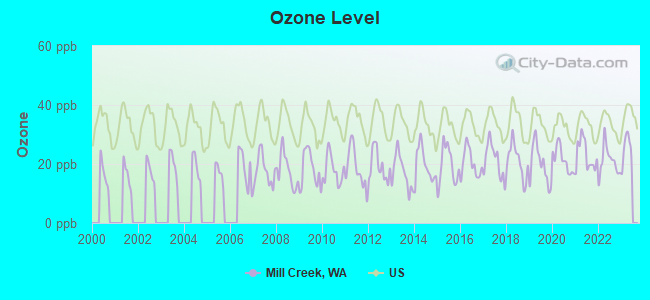
Ozone [ppb] level in 2022 was 21.0. This is significantly better than average. Closest monitor was 8.3 miles away from the city center.
| City: | 21.0 |
| U.S.: | 33.3 |
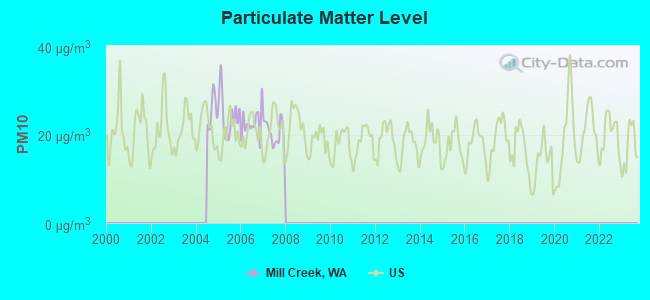
Particulate Matter (PM10) [µg/m3] level in 2007 was 20.3. This is about average. Closest monitor was 6.2 miles away from the city center.
| City: | 20.3 |
| U.S.: | 19.2 |
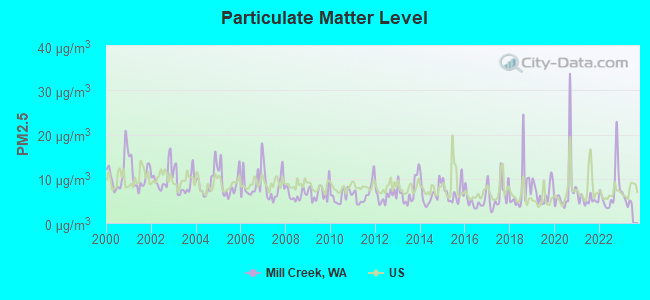
Particulate Matter (PM2.5) [µg/m3] level in 2022 was 7.47. This is about average. Closest monitor was 5.8 miles away from the city center.
| City: | 7.47 |
| U.S.: | 8.11 |
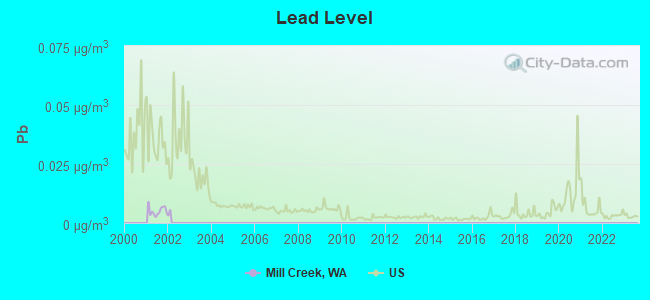
Lead (Pb) [µg/m3] level in 2001 was 0.00515. This is significantly better than average. Closest monitor was 8.2 miles away from the city center.
| City: | 0.00515 |
| U.S.: | 0.00931 |
Earthquake activity:
Mill Creek-area historical earthquake activity is significantly above Washington state average. It is 1241% greater than the overall U.S. average.On 4/13/1949 at 19:55:42, a magnitude 7.0 (7.0 UK, Class: Major, Intensity: VIII - XII) earthquake occurred 44.5 miles away from Mill Creek center, causing $80,000,000 total damage
On 2/28/2001 at 18:54:32, a magnitude 6.8 (6.8 MD, Depth: 32.2 mi, Class: Strong, Intensity: VII - IX) earthquake occurred 55.0 miles away from Mill Creek center
On 2/28/2001 at 18:54:32, a magnitude 6.8 (6.5 MB, 6.6 MS, 6.8 MW) earthquake occurred 56.2 miles away from Mill Creek center, causing $2,000,000,000 total damage and $305,000,000 insured losses
On 4/29/1965 at 15:28:43, a magnitude 6.6 (6.6 UK) earthquake occurred 38.2 miles away from Mill Creek center, causing $28,000,000 total damage
On 7/3/1999 at 01:43:54, a magnitude 5.8 (5.4 MB, 5.5 MS, 5.8 MW, 5.3 ME, Depth: 25.2 mi, Class: Moderate, Intensity: VI - VII) earthquake occurred 73.4 miles away from the city center
On 5/3/1996 at 04:04:22, a magnitude 5.5 (5.2 MB, 5.3 MD, 5.5 ML, Depth: 2.5 mi) earthquake occurred 21.4 miles away from the city center
Magnitude types: body-wave magnitude (MB), duration magnitude (MD), energy magnitude (ME), local magnitude (ML), surface-wave magnitude (MS), moment magnitude (MW)
Natural disasters:
The number of natural disasters in Snohomish County (31) is a lot greater than the US average (15).Major Disasters (Presidential) Declared: 27
Emergencies Declared: 2
Causes of natural disasters: Floods: 21, Storms: 17, Mudslides: 14, Landslides: 10, Winter Storms: 6, Winds: 5, Earthquakes: 2, Heavy Rain: 1, Hurricane: 1, Snow: 1, Tornado: 1, Volcanic Eruption: 1, Other: 1 (Note: some incidents may be assigned to more than one category).
Hospitals and medical centers near Mill Creek:
- MILL CREEK DIALYSIS CENTER (Dialysis Facility, about 2 miles away; BOTHELL, WA)
- BETHANY AT SILVER LAKE (Nursing Home, about 3 miles away; EVERETT, WA)
- GENTIVA HEALTH SVS /CERT (Home Health Center, about 3 miles away; EVERETT, WA)
- ALPHA NURSING AND SERVICES INC (Home Health Center, about 3 miles away; EVERETT, WA)
- EVERETT CARE AND REHABILITATION CENTER (Nursing Home, about 4 miles away; EVERETT, WA)
- EVERETT REHABILITATION AND MEDICAL CTR (Nursing Home, about 4 miles away; EVERETT, WA)
- MANOR CARE HEALTH SERVICES (Nursing Home, about 5 miles away; LYNNWOOD, WA)
Amtrak stations near Mill Creek:
- 9 miles: EVERETT (2900 BOND ST.) . Services: ticket office, partially wheelchair accessible, enclosed waiting area, public payphones, free short-term parking, free long-term parking, call for car rental service, taxi stand, public transit connection.
- 9 miles: EDMONDS (211 RAILROAD AVE.) . Services: ticket office, fully wheelchair accessible, enclosed waiting area, public restrooms, public payphones, vending machines, paid short-term parking, paid long-term parking, call for taxi service, public transit connection.
- 11 miles: MONROE (RED BARN UNOCAL) - Bus Station
Colleges/universities with over 2000 students nearest to Mill Creek:
- Edmonds Community College (about 7 miles; Lynnwood, WA; Full-time enrollment: 7,271)
- University of Washington-Bothell Campus (about 8 miles; Bothell, WA; FT enrollment: 3,902)
- Cascadia Community College (about 8 miles; Bothell, WA; FT enrollment: 2,238)
- Everett Community College (about 11 miles; Everett, WA; FT enrollment: 5,818)
- Shoreline Community College (about 11 miles; Shoreline, WA; FT enrollment: 5,026)
- Lake Washington Institute of Technology (about 11 miles; Kirkland, WA; FT enrollment: 2,947)
- Seattle Community College-North Campus (about 13 miles; Seattle, WA; FT enrollment: 4,220)
Public high school in Mill Creek:
- HENRY M. JACKSON HIGH SCHOOL (Location: 1508 136TH ST. SE, Grades: 9-12)
Public elementary/middle schools in Mill Creek:
- MILL CREEK ELEMENTARY (Location: 3400 148TH ST. SE, Grades: PK-5)
- HEATHERWOOD MIDDLE SCHOOL (Location: 1419 TRILLIUM BLVD. SE, Grades: 6-8)
User-submitted facts and corrections:
- Local newspaper: Mill Creek View (established 1990) Physical address: 15712 Mill Creek Blvd., Suite 4, Mill Creek, WA 98012 Mailing address: 16212 Bothell-Everett Hwy., Suite F-313, Mill Creek, WA 98012 Telephone: (425) 357-0549 Fax: (425) 357-1629 E-mail: MillCreekView at verizon.net
Points of interest:
Notable locations in Mill Creek: Murphys Substation (A), North Creek Substation (B), The Cottages at Mill Creek Memory Care Community (C), Merrill Gardens at Mill Creek (D), Snohomish County Fire District 7 Station 76 (E), Mill Creek Library (F). Display/hide their locations on the map
Shopping Centers: Mervyns Plaza Shopping Center (1), Mill Creek Square Shopping Center (2). Display/hide their locations on the map
Churches in Mill Creek include: Saint Francis Episcopal Church (A), North Creek Presbyterian Church (B), Cedar Cross United Methodist Church (C). Display/hide their locations on the map
Reservoir: Garhart Reservoir (A). Display/hide its location on the map
Creeks: Mill Creek (A), Penny Creek (B). Display/hide their locations on the map
| This city: | 2.4 people |
| Washington: | 2.5 people |
| This city: | 65.2% |
| Whole state: | 64.4% |
| This city: | 6.4% |
| Whole state: | 7.7% |
Likely homosexual households (counted as self-reported same-sex unmarried-partner households)
- Lesbian couples: 0.5% of all households
- Gay men: 0.3% of all households
22 people in homes or halfway houses for drug/alcohol abuse in 2000
Banks with branches in Mill Creek (2011 data):
- Prime Pacific Bank, National Association: Mill Creek Branch at 2130-132nd St. Se, branch established on 2007/12/26. Info updated 2010/05/13: Bank assets: $133.2 mil, Deposits: $122.4 mil, headquarters in Lynnwood, WA, negative income in the last year, Commercial Lending Specialization, 6 total offices, Holding Company: Prime Pacific Financial Services, Inc.
- JPMorgan Chase Bank, National Association: Mill Creek Branch at 912 164th St Se, branch established on 1985/06/30. Info updated 2011/11/10: Bank assets: $1,811,678.0 mil, Deposits: $1,190,738.0 mil, headquarters in Columbus, OH, positive income, International Specialization, 5577 total offices, Holding Company: Jpmorgan Chase & Co.
- KeyBank National Association: Mills Creek Branch at 16202 Bothell Everett Hwy, branch established on 1986/06/30. Info updated 2008/03/03: Bank assets: $86,198.8 mil, Deposits: $64,214.8 mil, headquarters in Cleveland, OH, positive income, Commercial Lending Specialization, 1067 total offices, Holding Company: Keycorp
- Peoples Bank: Mill Creek Office at 15506 Main Street, Suite 105, branch established on 2006/06/20. Info updated 2006/11/03: Bank assets: $1,224.9 mil, Deposits: $1,084.6 mil, headquarters in Lynden, WA, positive income, Commercial Lending Specialization, 26 total offices, Holding Company: Peoples Bancorp
- U.S. Bank National Association: Mill Creek Safeway Branch at 13314 Bothell Everett Highway, branch established on 1995/11/20. Info updated 2012/01/30: Bank assets: $330,470.8 mil, Deposits: $236,091.5 mil, headquarters in Cincinnati, OH, positive income, 3121 total offices, Holding Company: U.S. Bancorp
- Union Bank, National Association: Mill Creek Branch at 16412 9th Avenue Se, branch established on 1991/01/14. Info updated 2011/09/01: Bank assets: $88,967.5 mil, Deposits: $65,286.4 mil, headquarters in San Francisco, CA, positive income, Commercial Lending Specialization, 403 total offices, Holding Company: Mitsubishi Ufj Financial Group, Inc.
- Bank of America, National Association: Mill Creek Branch at 911 161st Street, branch established on 1982/10/04. Info updated 2009/11/18: Bank assets: $1,451,969.3 mil, Deposits: $1,077,176.8 mil, headquarters in Charlotte, NC, positive income, 5782 total offices, Holding Company: Bank Of America Corporation
For population 15 years and over in Mill Creek:
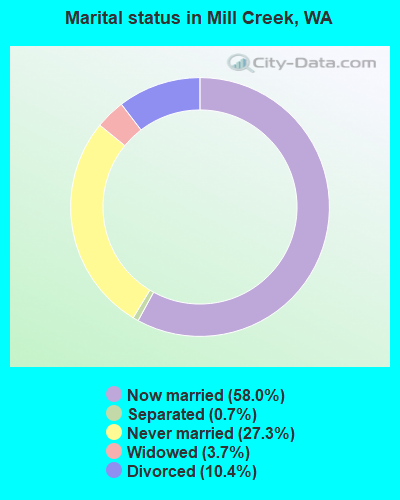
- Never married: 27.3%
- Now married: 58.0%
- Separated: 0.7%
- Widowed: 3.7%
- Divorced: 10.4%
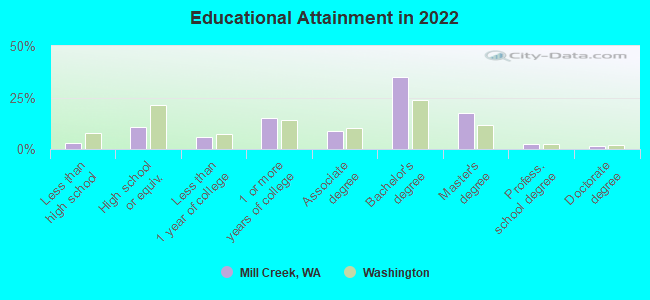
For population 25 years and over in Mill Creek:
- High school or higher: 97.0%
- Bachelor's degree or higher: 52.6%
- Graduate or professional degree: 19.7%
- Unemployed: 4.9%
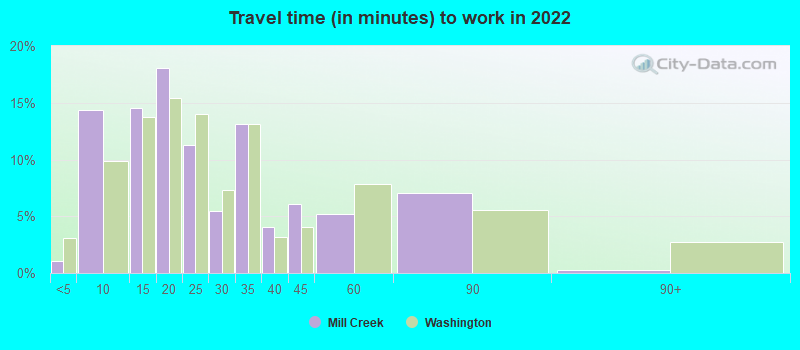
- Mean travel time to work (commute): 23.0 minutes
| Here: | 8.1 |
| Washington average: | 11.6 |
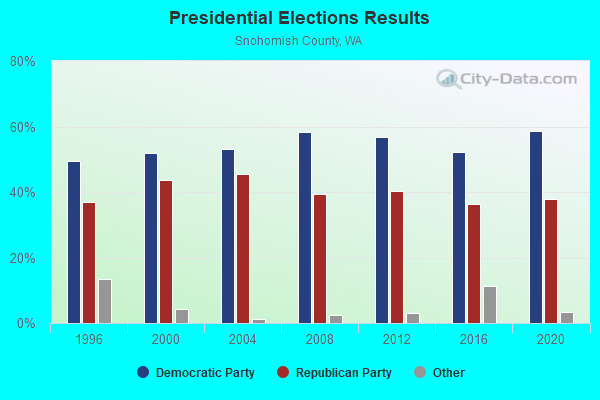
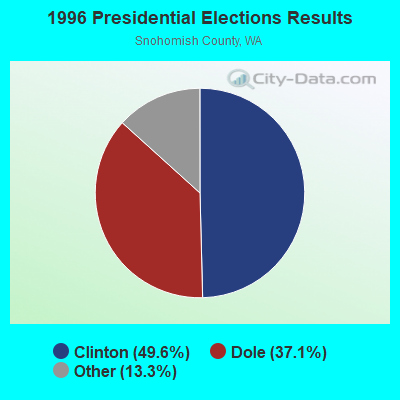
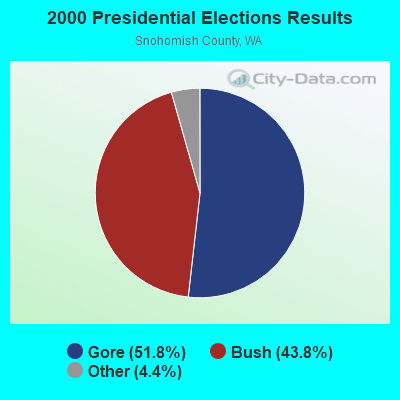
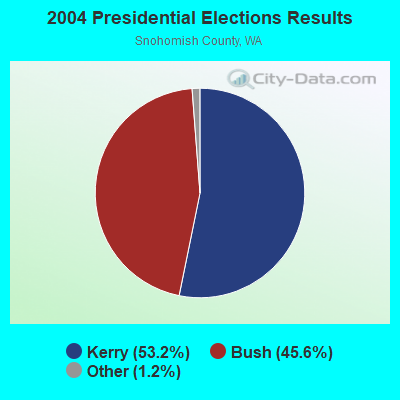
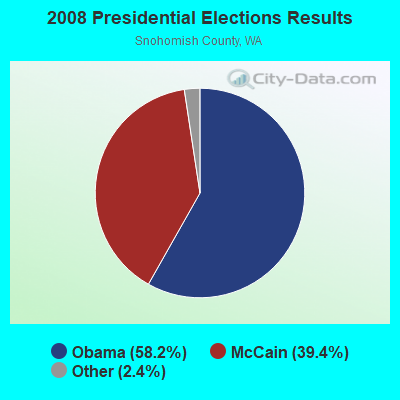

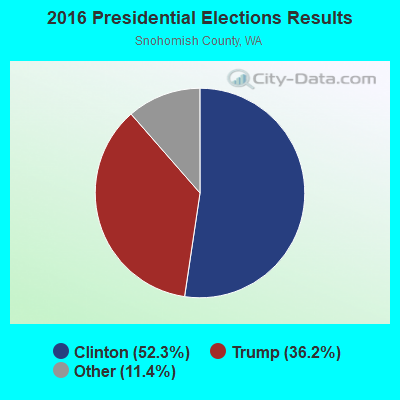
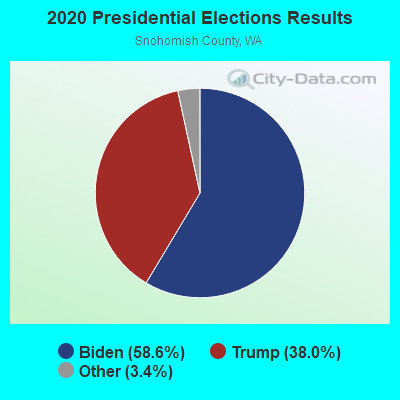
Graphs represent county-level data. Detailed 2008 Election Results
Religion statistics for Mill Creek, WA (based on Snohomish County data)
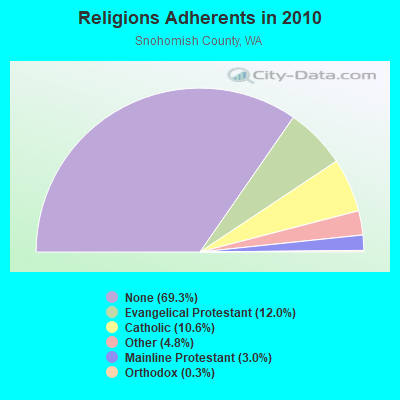
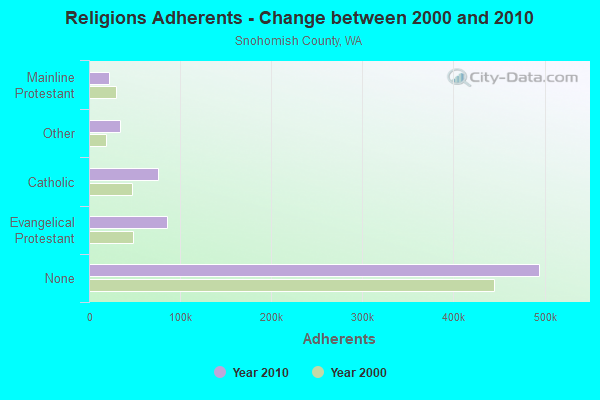
| Religion | Adherents | Congregations |
|---|---|---|
| Evangelical Protestant | 85,354 | 327 |
| Catholic | 75,393 | 16 |
| Other | 34,270 | 90 |
| Mainline Protestant | 21,642 | 71 |
| Orthodox | 1,943 | 6 |
| Black Protestant | 406 | 4 |
| None | 494,327 | - |
Food Environment Statistics:
| Snohomish County: | 1.79 / 10,000 pop. |
| State: | 2.06 / 10,000 pop. |
| Here: | 0.18 / 10,000 pop. |
| Washington: | 0.19 / 10,000 pop. |
| Snohomish County: | 1.42 / 10,000 pop. |
| Washington: | 1.18 / 10,000 pop. |
| Snohomish County: | 2.55 / 10,000 pop. |
| Washington: | 2.67 / 10,000 pop. |
| Snohomish County: | 6.95 / 10,000 pop. |
| Washington: | 8.26 / 10,000 pop. |
| This county: | 7.5% |
| Washington: | 7.7% |
| Here: | 27.4% |
| State: | 25.7% |
| This county: | 14.3% |
| State: | 13.9% |
Health and Nutrition:
| Here: | 54.3% |
| Washington: | 49.9% |
| Mill Creek: | 52.7% |
| Washington: | 47.2% |
| Mill Creek: | 28.1 |
| Washington: | 28.4 |
| Mill Creek: | 18.4% |
| Washington: | 20.9% |
| Here: | 11.4% |
| State: | 10.5% |
| Mill Creek: | 6.9 |
| Washington: | 6.8 |
| Mill Creek: | 32.9% |
| State: | 32.8% |
| Mill Creek: | 60.4% |
| Washington: | 56.8% |
| This city: | 80.3% |
| State: | 79.4% |
More about Health and Nutrition of Mill Creek, WA Residents
| Local government employment and payroll (March 2022) | |||||
| Function | Full-time employees | Monthly full-time payroll | Average yearly full-time wage | Part-time employees | Monthly part-time payroll |
|---|---|---|---|---|---|
| Police Protection - Officers | 24 | $235,492 | $117,746 | 0 | $0 |
| Other Government Administration | 13 | $118,456 | $109,344 | 7 | $3,686 |
| Parks and Recreation | 7 | $42,954 | $73,635 | 0 | $0 |
| Police - Other | 5 | $31,664 | $75,994 | 0 | $0 |
| Financial Administration | 3 | $25,308 | $101,232 | 7 | $9,688 |
| Totals for Government | 52 | $453,874 | $104,740 | 14 | $13,374 |
Mill Creek government finances - Expenditure in 2017 (per resident):
- Construction - Regular Highways: $1,155,000 ($55.45)
General - Other: $438,000 ($21.03)
Parks and Recreation: $16,000 ($0.77)
- Current Operations - Police Protection: $3,800,000 ($182.45)
Central Staff Services: $1,610,000 ($77.30)
Regular Highways: $808,000 ($38.79)
Financial Administration: $722,000 ($34.66)
Natural Resources - Other: $583,000 ($27.99)
Sewerage: $550,000 ($26.41)
Housing and Community Development: $389,000 ($18.68)
General Public Buildings: $329,000 ($15.80)
Parks and Recreation: $318,000 ($15.27)
Judicial and Legal Services: $231,000 ($11.09)
General - Other: $32,000 ($1.54)
Solid Waste Management: $12,000 ($0.58)
Health - Other: $5,000 ($0.24)
- General - Interest on Debt: $146,000 ($7.01)
- Intergovernmental to Local - Other - Local Fire Protection: $3,963,000 ($190.27)
Other - General - Other: $401,000 ($19.25)
Other - Correctional Institutions: $167,000 ($8.02)
Other - Judicial and Legal Services: $59,000 ($2.83)
Other - Police Protection: $51,000 ($2.45)
Other - Financial Administration: $29,000 ($1.39)
Other - Regular Highways: $23,000 ($1.10)
Other - Sewerage: $21,000 ($1.01)
Other - Health - Other: $5,000 ($0.24)
Other - Parks and Recreation: $4,000 ($0.19)
- Other Capital Outlay - General - Other: $409,000 ($19.64)
Police Protection: $55,000 ($2.64)
Financial Administration: $39,000 ($1.87)
Regular Highways: $3,000 ($0.14)
Central Staff Services: $1,000 ($0.05)
Health - Other: $1,000 ($0.05)
- Total Salaries and Wages: $5,230,000 ($251.10)
Mill Creek government finances - Revenue in 2017 (per resident):
- Charges - Other: $2,884,000 ($138.47)
Sewerage: $703,000 ($33.75)
Parks and Recreation: $445,000 ($21.37)
- Federal Intergovernmental - Other: $1,000 ($0.05)
- Local Intergovernmental - Other: $19,000 ($0.91)
- Miscellaneous - Rents: $194,000 ($9.31)
Fines and Forfeits: $180,000 ($8.64)
General Revenue - Other: $27,000 ($1.30)
Donations From Private Sources: $22,000 ($1.06)
Interest Earnings: $0 ($0.00)
- State Intergovernmental - Highways: $448,000 ($21.51)
General Local Government Support: $262,000 ($12.58)
Other: $240,000 ($11.52)
- Tax - Property: $7,347,000 ($352.75)
General Sales and Gross Receipts: $2,981,000 ($143.12)
Documentary and Stock Transfer: $1,756,000 ($84.31)
Other License: $523,000 ($25.11)
Public Utilities Sales: $406,000 ($19.49)
Occupation and Business License - Other: $50,000 ($2.40)
Other Selective Sales: $18,000 ($0.86)
Mill Creek government finances - Debt in 2017 (per resident):
- Long Term Debt - Outstanding Unspecified Public Purpose: $3,741,000 ($179.61)
Beginning Outstanding - Unspecified Public Purpose: $3,648,000 ($175.15)
Issue, Unspecified Public Purpose: $211,000 ($10.13)
Retired Unspecified Public Purpose: $117,000 ($5.62)
7.60% of this county's 2021 resident taxpayers lived in other counties in 2020 ($97,930 average adjusted gross income)
| Here: | 7.60% |
| Washington average: | 7.53% |
0.04% of residents moved from foreign countries ($285 average AGI)
Snohomish County: 0.04% Washington average: 0.05%
Top counties from which taxpayers relocated into this county between 2020 and 2021:
| from King County, WA | |
| from Pierce County, WA | |
| from Skagit County, WA |
7.20% of this county's 2020 resident taxpayers moved to other counties in 2021 ($85,049 average adjusted gross income)
| Here: | 7.20% |
| Washington average: | 7.40% |
0.02% of residents moved to foreign countries ($153 average AGI)
Snohomish County: 0.02% Washington average: 0.04%
Top counties to which taxpayers relocated from this county between 2020 and 2021:
| to King County, WA | |
| to Pierce County, WA | |
| to Skagit County, WA |
| Businesses in Mill Creek, WA | ||||
| Name | Count | Name | Count | |
|---|---|---|---|---|
| Albertsons | 2 | LA Fitness | 1 | |
| Baskin-Robbins | 1 | Lowe's | 1 | |
| Blockbuster | 1 | McDonald's | 2 | |
| Circle K | 1 | Papa John's Pizza | 1 | |
| Cold Stone Creamery | 1 | Pier 1 Imports | 1 | |
| DHL | 1 | Rite Aid | 2 | |
| FedEx | 4 | Safeway | 1 | |
| Firestone Complete Auto Care | 1 | Staples | 1 | |
| GNC | 1 | Starbucks | 2 | |
| H&R Block | 1 | UPS | 4 | |
| Jamba Juice | 1 | Vons | 1 | |
| Kroger | 1 | |||
Strongest AM radio stations in Mill Creek:
- KRKO (1380 AM; 50 kW; EVERETT, WA; Owner: S-R BROADCASTING, CO.)
- KIXI (880 AM; 50 kW; MERCER ISLAND/SEATTL, WA; Owner: BELLEVUE RADIO, INC.)
- KKOL (1300 AM; 50 kW; SEATTLE, WA; Owner: INSPIRATION MEDIA, INC.)
- KCIS (630 AM; 5 kW; EDMONDS, WA; Owner: CRISTA MINISTRIES)
- KIRO (710 AM; 50 kW; SEATTLE, WA; Owner: ENTERCOM SEATTLE LICENSE, LLC)
- KGNW (820 AM; 50 kW; BURIEN-SEATTLE, WA; Owner: INSPIRATION MEDIA, INC.)
- KOMO (1000 AM; 50 kW; SEATTLE, WA; Owner: FISHER BROADCASTING - SEATTLE RADIO, L.L.C.)
- KTTH (770 AM; 50 kW; SEATTLE, WA; Owner: ENTERCOM SEATTLE LICENSE, LLC)
- KYCW (1090 AM; 50 kW; SEATTLE, WA; Owner: INFINITY RADIO SUBSIDIARY OPERATIONS INC.)
- KJR (950 AM; 50 kW; SEATTLE, WA)
- KKNW (1150 AM; 10 kW; SEATTLE, WA; Owner: ORCA RADIO, INC.)
- KARR (1460 AM; 5 kW; KIRKLAND, WA; Owner: FAMILY STATIONS, INC.)
- KLFE (1590 AM; 10 kW; SEATTLE, WA; Owner: INSPIRATION MEDIA, INC.)
Strongest FM radio stations in Mill Creek:
- KISW (99.9 FM; SEATTLE, WA; Owner: ENTERCOM SEATTLE LICENSE, LLC)
- KCMS (105.3 FM; EDMONDS, WA; Owner: CRISTA MINISTRIES, INC.)
- KQBZ (100.7 FM; SEATTLE, WA; Owner: ENTERCOM SEATTLE LICENSE, LLC)
- KMTT (103.7 FM; TACOMA, WA; Owner: ENTERCOM SEATTLE LICENSE, LLC)
- KNDD (107.7 FM; SEATTLE, WA; Owner: ENTERCOM SEATTLE LICENSE, LLC)
- KYPT (96.5 FM; SEATTLE, WA; Owner: INFINITY RADIO SUBSIDIARY OPERATIONS INC.)
- KBSG-FM (97.3 FM; TACOMA, WA; Owner: ENTERCOM SEATTLE LICENSE, LLC)
- KBKS (106.1 FM; TACOMA, WA; Owner: INFINITY RADIO SUBSIDIARY OPERATIONS INC.)
- KING-FM (98.1 FM; SEATTLE, WA; Owner: CLASSIC RADIO, INC.)
- KLSY-FM (92.5 FM; BELLEVUE, WA; Owner: BELLEVUE RADIO INC.)
- KPLU-FM (88.5 FM; TACOMA, WA; Owner: PACIFIC LUTHERAN UNIVERSITY, INC.)
- KWJZ (98.9 FM; SEATTLE, WA; Owner: ORCA RADIO, INC.)
- KZOK-FM (102.5 FM; SEATTLE, WA; Owner: INFINITY RADIO SUBSIDIARY OPERATIONS INC.)
- KMPS-FM (94.1 FM; SEATTLE, WA; Owner: INFINITY RADIO SUBSIDIARY OPERATIONS INC.)
- KRWM (106.9 FM; BREMERTON, WA; Owner: SEASCAPE RADIO, INC.)
- K205DL (88.9 FM; GRANITE FALLS/EVERET, WA; Owner: CALVARY CHAPEL OF TWIN FALLS, INC.)
- KJR-FM (95.7 FM; SEATTLE, WA; Owner: ACKERLEY MEDIA GROUP, INC.)
- KUBE (93.3 FM; SEATTLE, WA; Owner: ACKERLEY MEDIA GROUP, INC.)
- KPLZ-FM (101.5 FM; SEATTLE, WA; Owner: FISHER BROADCASTING - SEATTLE RADIO, L.L.C.)
- K213BM (90.5 FM; EVERETT, ETC., WA; Owner: JACK STRAW FOUNDATION)
TV broadcast stations around Mill Creek:
- KING-TV (Channel 5; SEATTLE, WA; Owner: KING BROADCASTING COMPANY)
- KSTW (Channel 11; TACOMA, WA; Owner: UPN TELEVISION STATIONS INC.)
- KTWB-TV (Channel 22; SEATTLE, WA; Owner: TRIBUNE TELEVISION HOLDINGS, INC.)
- K58DP (Channel 58; SEATTLE, WA; Owner: WORD OF GOD FELLOWSHIP, INC.)
- KOMO-TV (Channel 4; SEATTLE, WA; Owner: FISHER BROADCASTING - SEATTLE TV, L.L.C.)
- KIRO-TV (Channel 7; SEATTLE, WA; Owner: KIRO-TV HOLDINGS, INC.)
- KCTS-TV (Channel 9; SEATTLE, WA; Owner: KCTS TELEVISION)
- K57HB (Channel 57; EUREKA, CA; Owner: MS COMMUNICATIONS, LLC)
- KHCV (Channel 45; SEATTLE, WA; Owner: NORTH PACIFIC INTERNATIONAL TELEVISION, INC.)
- KWPX (Channel 33; BELLEVUE, WA; Owner: PAXSON COMMUNICATIONS LICENSE COMPANY, LLC)
- KONG-TV (Channel 16; EVERETT, WA; Owner: KONG-TV, INC.)
- K68DL (Channel 68; SEATTLE, WA; Owner: THREE ANGELS BROADCASTING NETWORK)
- KCPQ (Channel 13; TACOMA, WA; Owner: TRIBUNE TELEVISION NORTHWEST, INC.)
- KWDK (Channel 56; TACOMA, WA; Owner: PUGET SOUND EDUCATIONAL TV, INC.)
- K29ED (Channel 29; EVERETT, WA; Owner: TRIBUNE TELEVISION HOLDINGS, INC.)
- National Bridge Inventory (NBI) Statistics
- 4Number of bridges
- 20ft / 5.5mTotal length
- $2,309,000Total costs
- 55,725Total average daily traffic
- 3,486Total average daily truck traffic
- 60,750Total future (year 2035) average daily traffic
FCC Registered Antenna Towers:
30 (See the full list of FCC Registered Antenna Towers in Mill Creek)FCC Registered Broadcast Land Mobile Towers:
3- Mill Creek Town Cen., Lat: 47.866139 Lon: -122.220833, Call Sign: WQCL704,
Assigned Frequencies: 451.512 MHz, Grant Date: 04/02/2005, Expiration Date: 04/02/2015, Cancellation Date: 06/06/2015, Certifier: Brian Reynolds, Registrant: Speedread Technologies, 4525 Saguaro, Indianapolis, IN 46268, Phone: (317) 824-4544, Fax: (703) 558-0523, Email:
- Lat: 47.857139 Lon: -122.205750, Call Sign: WQOA941,
Assigned Frequencies: 452.837 MHz, 457.987 MHz, 452.862 MHz, 452.987 MHz, 451.537 MHz, Grant Date: 07/29/2011, Expiration Date: 07/29/2021, Cancellation Date: 10/09/2021, Certifier: Robert Winkel, Registrant: Radio Licensing Services, 4700 Se International Way, Milwaukie, OR 97269, Phone: (503) 794-3787, Fax: (503) 794-3759, Email:
- Lat: 47.901500 Lon: -122.206028, Call Sign: WQQM239,
Assigned Frequencies: 451.637 MHz, 456.637 MHz, 451.050 MHz, 456.050 MHz, 451.737 MHz, 456.737 MHz, 451.237 MHz, 456.237 MHz, 451.312 MHz, 456.312 MHz... (+24 more), Grant Date: 11/09/2022, Expiration Date: 01/24/2033, Certifier: Jennifer Farmer, Registrant: Business Radio Licensing, 30251 Golden Lantern Ste E #501, Laguna Niguel, CA 92677, Phone: (949) 348-8510, Fax: (949) 348-8514, Email:
FCC Registered Amateur Radio Licenses:
141 (See the full list of FCC Registered Amateur Radio Licenses in Mill Creek)FAA Registered Aircraft:
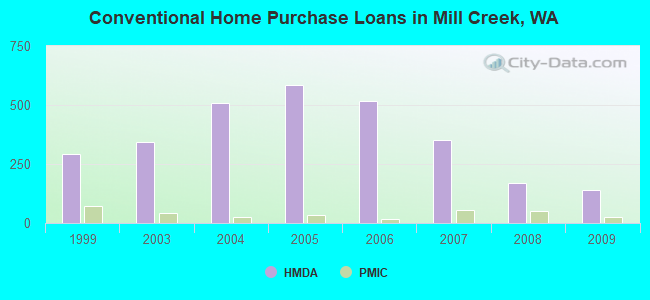
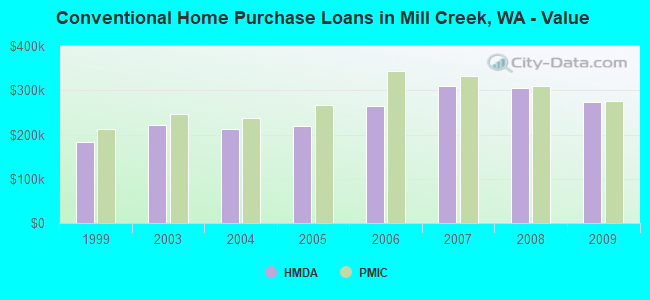
22 (See the full list of FAA Registered Aircraft in Mill Creek)| Home Mortgage Disclosure Act Aggregated Statistics For Year 2009 (Based on 1 full and 3 partial tracts) | ||||||||||||
| A) FHA, FSA/RHS & VA Home Purchase Loans | B) Conventional Home Purchase Loans | C) Refinancings | D) Home Improvement Loans | F) Non-occupant Loans on < 5 Family Dwellings (A B C & D) | G) Loans On Manufactured Home Dwelling (A B C & D) | |||||||
|---|---|---|---|---|---|---|---|---|---|---|---|---|
| Number | Average Value | Number | Average Value | Number | Average Value | Number | Average Value | Number | Average Value | Number | Average Value | |
| LOANS ORIGINATED | 51 | $336,105 | 140 | $273,640 | 583 | $277,572 | 16 | $158,744 | 27 | $282,366 | 1 | $209,920 |
| APPLICATIONS APPROVED, NOT ACCEPTED | 4 | $320,755 | 14 | $317,868 | 67 | $301,393 | 3 | $53,857 | 4 | $385,022 | 0 | $0 |
| APPLICATIONS DENIED | 8 | $272,649 | 17 | $238,333 | 145 | $303,570 | 7 | $119,387 | 8 | $211,748 | 3 | $99,987 |
| APPLICATIONS WITHDRAWN | 11 | $298,040 | 11 | $274,044 | 110 | $309,165 | 4 | $212,295 | 7 | $220,384 | 0 | $0 |
| FILES CLOSED FOR INCOMPLETENESS | 1 | $174,070 | 2 | $251,000 | 28 | $294,456 | 4 | $202,610 | 1 | $398,700 | 0 | $0 |
Detailed HMDA statistics for the following Tracts: 0417.02 , 0520.04, 0520.05, 0520.06
| Private Mortgage Insurance Companies Aggregated Statistics For Year 2009 (Based on 1 full and 3 partial tracts) | ||||||
| A) Conventional Home Purchase Loans | B) Refinancings | C) Non-occupant Loans on < 5 Family Dwellings (A & B) | ||||
|---|---|---|---|---|---|---|
| Number | Average Value | Number | Average Value | Number | Average Value | |
| LOANS ORIGINATED | 27 | $275,570 | 6 | $301,557 | 1 | $114,400 |
| APPLICATIONS APPROVED, NOT ACCEPTED | 1 | $412,730 | 4 | $282,972 | 0 | $0 |
| APPLICATIONS DENIED | 6 | $288,348 | 2 | $173,760 | 0 | $0 |
| APPLICATIONS WITHDRAWN | 2 | $311,765 | 1 | $422,400 | 0 | $0 |
| FILES CLOSED FOR INCOMPLETENESS | 1 | $155,980 | 0 | $0 | 0 | $0 |
Detailed PMIC statistics for the following Tracts: 0417.02 , 0520.04, 0520.05, 0520.06
2002 - 2018 National Fire Incident Reporting System (NFIRS) incidents
- Fire incident types reported to NFIRS in Mill Creek, WA
- 16354.0%Structure Fires
- 8126.8%Outside Fires
- 3511.6%Mobile Property/Vehicle Fires
- 237.6%Other
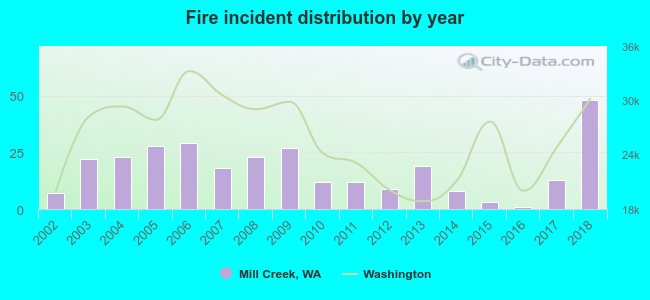 Based on the data from the years 2002 - 2018 the average number of fire incidents per year is 18. The highest number of fires - 48 took place in 2018, and the least - 1 in 2016. The data has a growing trend.
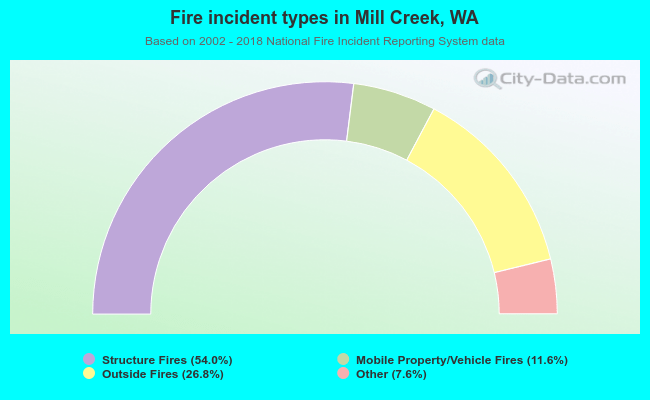 When looking into fire subcategories, the most reports belonged to: Structure Fires (54.0%), and Outside Fires (26.8%).
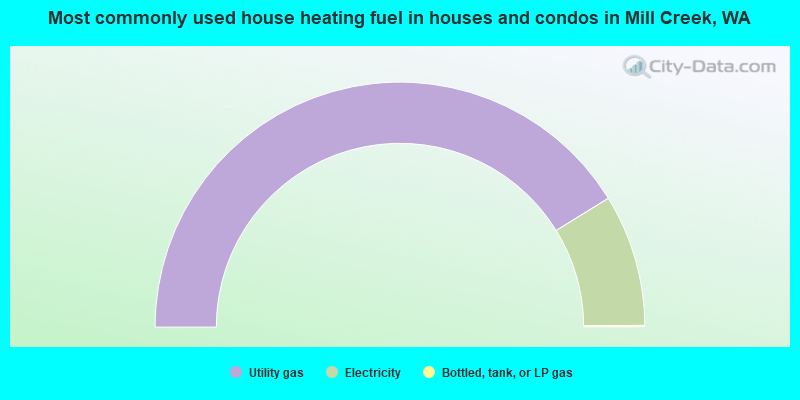
- 82.4%Utility gas
- 17.4%Electricity
- 0.2%Bottled, tank, or LP gas
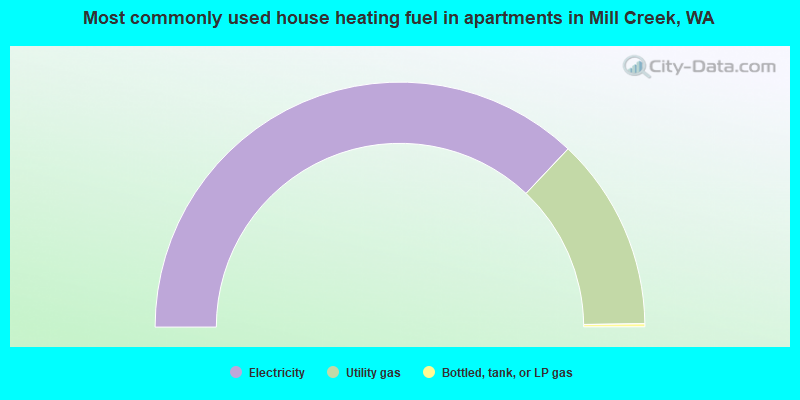
- 74.1%Electricity
- 25.5%Utility gas
- 0.4%Bottled, tank, or LP gas
Mill Creek compared to Washington state average:
- Median house value above state average.
- Unemployed percentage significantly below state average.
- Black race population percentage above state average.
- Median age above state average.
- Foreign-born population percentage significantly above state average.
- Length of stay since moving in significantly above state average.
- House age significantly below state average.
- Percentage of population with a bachelor's degree or higher above state average.
Mill Creek on our top lists:
- #57 on the list of "Top 101 cities with largest percentage of males in occupations: architecture and engineering occupations (population 5,000+)"
- #91 on the list of "Top 101 cities with largest percentage of females in occupations: architecture and engineering occupations (population 5,000+)"
- #92 on the list of "Top 101 cities with the most residents born in Korea (population 500+)"
- #99 on the list of "Top 101 cities with the most residents born in Russia (population 500+)"
- #24 on the list of "Top 101 counties with the lowest Particulate Matter (PM2.5) Annual air pollution readings in 2012 (µg/m3)"
- #45 on the list of "Top 101 counties with the lowest number of infant deaths per 1000 residents 2007-2013 (pop. 50,000+)"
- #46 on the list of "Top 101 counties with the highest percentage of residents that exercised in the past month"
- #48 on the list of "Top 101 counties with the highest average weight of females"
- #60 on the list of "Top 101 counties with the most Other congregations (pop. 50,000+)"

|
|
Total of 725 patent applications in 2008-2024.