Perris, California Submit your own pictures of this city and show them to the world
OSM Map
General Map
Google Map
MSN Map
OSM Map
General Map
Google Map
MSN Map
OSM Map
General Map
Google Map
MSN Map
OSM Map
General Map
Google Map
MSN Map
Please wait while loading the map...
Population in 2022: 80,263 (99% urban, 1% rural). Population change since 2000: +121.8%Males: 40,521 Females: 39,742
March 2022 cost of living index in Perris: 82.3 (low, U.S. average is 100) Percentage of residents living in poverty in 2022: 16.2%for White Non-Hispanic residents , 17.9% for Black residents , 17.8% for Hispanic or Latino residents , 47.5% for American Indian residents , 8.1% for Native Hawaiian and other Pacific Islander residents , 21.1% for other race residents , 5.4% for two or more races residents )
Profiles of local businesses
Business Search - 14 Million verified businesses
Data:
Median household income ($)
Median household income (% change since 2000)
Household income diversity
Ratio of average income to average house value (%)
Ratio of average income to average rent
Median household income ($) - White
Median household income ($) - Black or African American
Median household income ($) - Asian
Median household income ($) - Hispanic or Latino
Median household income ($) - American Indian and Alaska Native
Median household income ($) - Multirace
Median household income ($) - Other Race
Median household income for houses/condos with a mortgage ($)
Median household income for apartments without a mortgage ($)
Races - White alone (%)
Races - White alone (% change since 2000)
Races - Black alone (%)
Races - Black alone (% change since 2000)
Races - American Indian alone (%)
Races - American Indian alone (% change since 2000)
Races - Asian alone (%)
Races - Asian alone (% change since 2000)
Races - Hispanic (%)
Races - Hispanic (% change since 2000)
Races - Native Hawaiian and Other Pacific Islander alone (%)
Races - Native Hawaiian and Other Pacific Islander alone (% change since 2000)
Races - Two or more races (%)
Races - Two or more races (% change since 2000)
Races - Other race alone (%)
Races - Other race alone (% change since 2000)
Racial diversity
Unemployment (%)
Unemployment (% change since 2000)
Unemployment (%) - White
Unemployment (%) - Black or African American
Unemployment (%) - Asian
Unemployment (%) - Hispanic or Latino
Unemployment (%) - American Indian and Alaska Native
Unemployment (%) - Multirace
Unemployment (%) - Other Race
Population density (people per square mile)
Population - Males (%)
Population - Females (%)
Population - Males (%) - White
Population - Males (%) - Black or African American
Population - Males (%) - Asian
Population - Males (%) - Hispanic or Latino
Population - Males (%) - American Indian and Alaska Native
Population - Males (%) - Multirace
Population - Males (%) - Other Race
Population - Females (%) - White
Population - Females (%) - Black or African American
Population - Females (%) - Asian
Population - Females (%) - Hispanic or Latino
Population - Females (%) - American Indian and Alaska Native
Population - Females (%) - Multirace
Population - Females (%) - Other Race
Coronavirus confirmed cases (Apr 18, 2024)
Deaths caused by coronavirus (Apr 18, 2024)
Coronavirus confirmed cases (per 100k population) (Apr 18, 2024)
Deaths caused by coronavirus (per 100k population) (Apr 18, 2024)
Daily increase in number of cases (Apr 18, 2024)
Weekly increase in number of cases (Apr 18, 2024)
Cases doubled (in days) (Apr 18, 2024)
Hospitalized patients (Apr 18, 2022)
Negative test results (Apr 18, 2022)
Total test results (Apr 18, 2022)
COVID Vaccine doses distributed (per 100k population) (Sep 19, 2023)
COVID Vaccine doses administered (per 100k population) (Sep 19, 2023)
COVID Vaccine doses distributed (Sep 19, 2023)
COVID Vaccine doses administered (Sep 19, 2023)
Likely homosexual households (%)
Likely homosexual households (% change since 2000)
Likely homosexual households - Lesbian couples (%)
Likely homosexual households - Lesbian couples (% change since 2000)
Likely homosexual households - Gay men (%)
Likely homosexual households - Gay men (% change since 2000)
Cost of living index
Median gross rent ($)
Median contract rent ($)
Median monthly housing costs ($)
Median house or condo value ($)
Median house or condo value ($ change since 2000)
Mean house or condo value by units in structure - 1, detached ($)
Mean house or condo value by units in structure - 1, attached ($)
Mean house or condo value by units in structure - 2 ($)
Mean house or condo value by units in structure by units in structure - 3 or 4 ($)
Mean house or condo value by units in structure - 5 or more ($)
Mean house or condo value by units in structure - Boat, RV, van, etc. ($)
Mean house or condo value by units in structure - Mobile home ($)
Median house or condo value ($) - White
Median house or condo value ($) - Black or African American
Median house or condo value ($) - Asian
Median house or condo value ($) - Hispanic or Latino
Median house or condo value ($) - American Indian and Alaska Native
Median house or condo value ($) - Multirace
Median house or condo value ($) - Other Race
Median resident age
Resident age diversity
Median resident age - Males
Median resident age - Females
Median resident age - White
Median resident age - Black or African American
Median resident age - Asian
Median resident age - Hispanic or Latino
Median resident age - American Indian and Alaska Native
Median resident age - Multirace
Median resident age - Other Race
Median resident age - Males - White
Median resident age - Males - Black or African American
Median resident age - Males - Asian
Median resident age - Males - Hispanic or Latino
Median resident age - Males - American Indian and Alaska Native
Median resident age - Males - Multirace
Median resident age - Males - Other Race
Median resident age - Females - White
Median resident age - Females - Black or African American
Median resident age - Females - Asian
Median resident age - Females - Hispanic or Latino
Median resident age - Females - American Indian and Alaska Native
Median resident age - Females - Multirace
Median resident age - Females - Other Race
Commute - mean travel time to work (minutes)
Travel time to work - Less than 5 minutes (%)
Travel time to work - Less than 5 minutes (% change since 2000)
Travel time to work - 5 to 9 minutes (%)
Travel time to work - 5 to 9 minutes (% change since 2000)
Travel time to work - 10 to 19 minutes (%)
Travel time to work - 10 to 19 minutes (% change since 2000)
Travel time to work - 20 to 29 minutes (%)
Travel time to work - 20 to 29 minutes (% change since 2000)
Travel time to work - 30 to 39 minutes (%)
Travel time to work - 30 to 39 minutes (% change since 2000)
Travel time to work - 40 to 59 minutes (%)
Travel time to work - 40 to 59 minutes (% change since 2000)
Travel time to work - 60 to 89 minutes (%)
Travel time to work - 60 to 89 minutes (% change since 2000)
Travel time to work - 90 or more minutes (%)
Travel time to work - 90 or more minutes (% change since 2000)
Marital status - Never married (%)
Marital status - Now married (%)
Marital status - Separated (%)
Marital status - Widowed (%)
Marital status - Divorced (%)
Median family income ($)
Median family income (% change since 2000)
Median non-family income ($)
Median non-family income (% change since 2000)
Median per capita income ($)
Median per capita income (% change since 2000)
Median family income ($) - White
Median family income ($) - Black or African American
Median family income ($) - Asian
Median family income ($) - Hispanic or Latino
Median family income ($) - American Indian and Alaska Native
Median family income ($) - Multirace
Median family income ($) - Other Race
Median year house/condo built
Median year apartment built
Year house built - Built 2005 or later (%)
Year house built - Built 2000 to 2004 (%)
Year house built - Built 1990 to 1999 (%)
Year house built - Built 1980 to 1989 (%)
Year house built - Built 1970 to 1979 (%)
Year house built - Built 1960 to 1969 (%)
Year house built - Built 1950 to 1959 (%)
Year house built - Built 1940 to 1949 (%)
Year house built - Built 1939 or earlier (%)
Average household size
Household density (households per square mile)
Average household size - White
Average household size - Black or African American
Average household size - Asian
Average household size - Hispanic or Latino
Average household size - American Indian and Alaska Native
Average household size - Multirace
Average household size - Other Race
Occupied housing units (%)
Vacant housing units (%)
Owner occupied housing units (%)
Renter occupied housing units (%)
Vacancy status - For rent (%)
Vacancy status - For sale only (%)
Vacancy status - Rented or sold, not occupied (%)
Vacancy status - For seasonal, recreational, or occasional use (%)
Vacancy status - For migrant workers (%)
Vacancy status - Other vacant (%)
Residents with income below the poverty level (%)
Residents with income below 50% of the poverty level (%)
Children below poverty level (%)
Poor families by family type - Married-couple family (%)
Poor families by family type - Male, no wife present (%)
Poor families by family type - Female, no husband present (%)
Poverty status for native-born residents (%)
Poverty status for foreign-born residents (%)
Poverty among high school graduates not in families (%)
Poverty among people who did not graduate high school not in families (%)
Residents with income below the poverty level (%) - White
Residents with income below the poverty level (%) - Black or African American
Residents with income below the poverty level (%) - Asian
Residents with income below the poverty level (%) - Hispanic or Latino
Residents with income below the poverty level (%) - American Indian and Alaska Native
Residents with income below the poverty level (%) - Multirace
Residents with income below the poverty level (%) - Other Race
Air pollution - Air Quality Index (AQI)
Air pollution - CO
Air pollution - NO2
Air pollution - SO2
Air pollution - Ozone
Air pollution - PM10
Air pollution - PM25
Air pollution - Pb
Crime - Murders per 100,000 population
Crime - Rapes per 100,000 population
Crime - Robberies per 100,000 population
Crime - Assaults per 100,000 population
Crime - Burglaries per 100,000 population
Crime - Thefts per 100,000 population
Crime - Auto thefts per 100,000 population
Crime - Arson per 100,000 population
Crime - City-data.com crime index
Crime - Violent crime index
Crime - Property crime index
Crime - Murders per 100,000 population (5 year average)
Crime - Rapes per 100,000 population (5 year average)
Crime - Robberies per 100,000 population (5 year average)
Crime - Assaults per 100,000 population (5 year average)
Crime - Burglaries per 100,000 population (5 year average)
Crime - Thefts per 100,000 population (5 year average)
Crime - Auto thefts per 100,000 population (5 year average)
Crime - Arson per 100,000 population (5 year average)
Crime - City-data.com crime index (5 year average)
Crime - Violent crime index (5 year average)
Crime - Property crime index (5 year average)
1996 Presidential Elections Results (%) - Democratic Party (Clinton)
1996 Presidential Elections Results (%) - Republican Party (Dole)
1996 Presidential Elections Results (%) - Other
2000 Presidential Elections Results (%) - Democratic Party (Gore)
2000 Presidential Elections Results (%) - Republican Party (Bush)
2000 Presidential Elections Results (%) - Other
2004 Presidential Elections Results (%) - Democratic Party (Kerry)
2004 Presidential Elections Results (%) - Republican Party (Bush)
2004 Presidential Elections Results (%) - Other
2008 Presidential Elections Results (%) - Democratic Party (Obama)
2008 Presidential Elections Results (%) - Republican Party (McCain)
2008 Presidential Elections Results (%) - Other
2012 Presidential Elections Results (%) - Democratic Party (Obama)
2012 Presidential Elections Results (%) - Republican Party (Romney)
2012 Presidential Elections Results (%) - Other
2016 Presidential Elections Results (%) - Democratic Party (Clinton)
2016 Presidential Elections Results (%) - Republican Party (Trump)
2016 Presidential Elections Results (%) - Other
2020 Presidential Elections Results (%) - Democratic Party (Biden)
2020 Presidential Elections Results (%) - Republican Party (Trump)
2020 Presidential Elections Results (%) - Other
Ancestries Reported - Arab (%)
Ancestries Reported - Czech (%)
Ancestries Reported - Danish (%)
Ancestries Reported - Dutch (%)
Ancestries Reported - English (%)
Ancestries Reported - French (%)
Ancestries Reported - French Canadian (%)
Ancestries Reported - German (%)
Ancestries Reported - Greek (%)
Ancestries Reported - Hungarian (%)
Ancestries Reported - Irish (%)
Ancestries Reported - Italian (%)
Ancestries Reported - Lithuanian (%)
Ancestries Reported - Norwegian (%)
Ancestries Reported - Polish (%)
Ancestries Reported - Portuguese (%)
Ancestries Reported - Russian (%)
Ancestries Reported - Scotch-Irish (%)
Ancestries Reported - Scottish (%)
Ancestries Reported - Slovak (%)
Ancestries Reported - Subsaharan African (%)
Ancestries Reported - Swedish (%)
Ancestries Reported - Swiss (%)
Ancestries Reported - Ukrainian (%)
Ancestries Reported - United States (%)
Ancestries Reported - Welsh (%)
Ancestries Reported - West Indian (%)
Ancestries Reported - Other (%)
Educational Attainment - No schooling completed (%)
Educational Attainment - Less than high school (%)
Educational Attainment - High school or equivalent (%)
Educational Attainment - Less than 1 year of college (%)
Educational Attainment - 1 or more years of college (%)
Educational Attainment - Associate degree (%)
Educational Attainment - Bachelor's degree (%)
Educational Attainment - Master's degree (%)
Educational Attainment - Professional school degree (%)
Educational Attainment - Doctorate degree (%)
School Enrollment - Nursery, preschool (%)
School Enrollment - Kindergarten (%)
School Enrollment - Grade 1 to 4 (%)
School Enrollment - Grade 5 to 8 (%)
School Enrollment - Grade 9 to 12 (%)
School Enrollment - College undergrad (%)
School Enrollment - Graduate or professional (%)
School Enrollment - Not enrolled in school (%)
School enrollment - Public schools (%)
School enrollment - Private schools (%)
School enrollment - Not enrolled (%)
Median number of rooms in houses and condos
Median number of rooms in apartments
Housing units lacking complete plumbing facilities (%)
Housing units lacking complete kitchen facilities (%)
Density of houses
Urban houses (%)
Rural houses (%)
Households with people 60 years and over (%)
Households with people 65 years and over (%)
Households with people 75 years and over (%)
Households with one or more nonrelatives (%)
Households with no nonrelatives (%)
Population in households (%)
Family households (%)
Nonfamily households (%)
Population in families (%)
Family households with own children (%)
Median number of bedrooms in owner occupied houses
Mean number of bedrooms in owner occupied houses
Median number of bedrooms in renter occupied houses
Mean number of bedrooms in renter occupied houses
Median number of vehichles in owner occupied houses
Mean number of vehichles in owner occupied houses
Median number of vehichles in renter occupied houses
Mean number of vehichles in renter occupied houses
Mortgage status - with mortgage (%)
Mortgage status - with second mortgage (%)
Mortgage status - with home equity loan (%)
Mortgage status - with both second mortgage and home equity loan (%)
Mortgage status - without a mortgage (%)
Average family size
Average family size - White
Average family size - Black or African American
Average family size - Asian
Average family size - Hispanic or Latino
Average family size - American Indian and Alaska Native
Average family size - Multirace
Average family size - Other Race
Geographical mobility - Same house 1 year ago (%)
Geographical mobility - Moved within same county (%)
Geographical mobility - Moved from different county within same state (%)
Geographical mobility - Moved from different state (%)
Geographical mobility - Moved from abroad (%)
Place of birth - Born in state of residence (%)
Place of birth - Born in other state (%)
Place of birth - Native, outside of US (%)
Place of birth - Foreign born (%)
Housing units in structures - 1, detached (%)
Housing units in structures - 1, attached (%)
Housing units in structures - 2 (%)
Housing units in structures - 3 or 4 (%)
Housing units in structures - 5 to 9 (%)
Housing units in structures - 10 to 19 (%)
Housing units in structures - 20 to 49 (%)
Housing units in structures - 50 or more (%)
Housing units in structures - Mobile home (%)
Housing units in structures - Boat, RV, van, etc. (%)
House/condo owner moved in on average (years ago)
Renter moved in on average (years ago)
Year householder moved into unit - Moved in 1999 to March 2000 (%)
Year householder moved into unit - Moved in 1995 to 1998 (%)
Year householder moved into unit - Moved in 1990 to 1994 (%)
Year householder moved into unit - Moved in 1980 to 1989 (%)
Year householder moved into unit - Moved in 1970 to 1979 (%)
Year householder moved into unit - Moved in 1969 or earlier (%)
Means of transportation to work - Drove car alone (%)
Means of transportation to work - Carpooled (%)
Means of transportation to work - Public transportation (%)
Means of transportation to work - Bus or trolley bus (%)
Means of transportation to work - Streetcar or trolley car (%)
Means of transportation to work - Subway or elevated (%)
Means of transportation to work - Railroad (%)
Means of transportation to work - Ferryboat (%)
Means of transportation to work - Taxicab (%)
Means of transportation to work - Motorcycle (%)
Means of transportation to work - Bicycle (%)
Means of transportation to work - Walked (%)
Means of transportation to work - Other means (%)
Working at home (%)
Industry diversity
Most Common Industries - Agriculture, forestry, fishing and hunting, and mining (%)
Most Common Industries - Agriculture, forestry, fishing and hunting (%)
Most Common Industries - Mining, quarrying, and oil and gas extraction (%)
Most Common Industries - Construction (%)
Most Common Industries - Manufacturing (%)
Most Common Industries - Wholesale trade (%)
Most Common Industries - Retail trade (%)
Most Common Industries - Transportation and warehousing, and utilities (%)
Most Common Industries - Transportation and warehousing (%)
Most Common Industries - Utilities (%)
Most Common Industries - Information (%)
Most Common Industries - Finance and insurance, and real estate and rental and leasing (%)
Most Common Industries - Finance and insurance (%)
Most Common Industries - Real estate and rental and leasing (%)
Most Common Industries - Professional, scientific, and management, and administrative and waste management services (%)
Most Common Industries - Professional, scientific, and technical services (%)
Most Common Industries - Management of companies and enterprises (%)
Most Common Industries - Administrative and support and waste management services (%)
Most Common Industries - Educational services, and health care and social assistance (%)
Most Common Industries - Educational services (%)
Most Common Industries - Health care and social assistance (%)
Most Common Industries - Arts, entertainment, and recreation, and accommodation and food services (%)
Most Common Industries - Arts, entertainment, and recreation (%)
Most Common Industries - Accommodation and food services (%)
Most Common Industries - Other services, except public administration (%)
Most Common Industries - Public administration (%)
Occupation diversity
Most Common Occupations - Management, business, science, and arts occupations (%)
Most Common Occupations - Management, business, and financial occupations (%)
Most Common Occupations - Management occupations (%)
Most Common Occupations - Business and financial operations occupations (%)
Most Common Occupations - Computer, engineering, and science occupations (%)
Most Common Occupations - Computer and mathematical occupations (%)
Most Common Occupations - Architecture and engineering occupations (%)
Most Common Occupations - Life, physical, and social science occupations (%)
Most Common Occupations - Education, legal, community service, arts, and media occupations (%)
Most Common Occupations - Community and social service occupations (%)
Most Common Occupations - Legal occupations (%)
Most Common Occupations - Education, training, and library occupations (%)
Most Common Occupations - Arts, design, entertainment, sports, and media occupations (%)
Most Common Occupations - Healthcare practitioners and technical occupations (%)
Most Common Occupations - Health diagnosing and treating practitioners and other technical occupations (%)
Most Common Occupations - Health technologists and technicians (%)
Most Common Occupations - Service occupations (%)
Most Common Occupations - Healthcare support occupations (%)
Most Common Occupations - Protective service occupations (%)
Most Common Occupations - Fire fighting and prevention, and other protective service workers including supervisors (%)
Most Common Occupations - Law enforcement workers including supervisors (%)
Most Common Occupations - Food preparation and serving related occupations (%)
Most Common Occupations - Building and grounds cleaning and maintenance occupations (%)
Most Common Occupations - Personal care and service occupations (%)
Most Common Occupations - Sales and office occupations (%)
Most Common Occupations - Sales and related occupations (%)
Most Common Occupations - Office and administrative support occupations (%)
Most Common Occupations - Natural resources, construction, and maintenance occupations (%)
Most Common Occupations - Farming, fishing, and forestry occupations (%)
Most Common Occupations - Construction and extraction occupations (%)
Most Common Occupations - Installation, maintenance, and repair occupations (%)
Most Common Occupations - Production, transportation, and material moving occupations (%)
Most Common Occupations - Production occupations (%)
Most Common Occupations - Transportation occupations (%)
Most Common Occupations - Material moving occupations (%)
People in Group quarters - Institutionalized population (%)
People in Group quarters - Correctional institutions (%)
People in Group quarters - Federal prisons and detention centers (%)
People in Group quarters - Halfway houses (%)
People in Group quarters - Local jails and other confinement facilities (including police lockups) (%)
People in Group quarters - Military disciplinary barracks (%)
People in Group quarters - State prisons (%)
People in Group quarters - Other types of correctional institutions (%)
People in Group quarters - Nursing homes (%)
People in Group quarters - Hospitals/wards, hospices, and schools for the handicapped (%)
People in Group quarters - Hospitals/wards and hospices for chronically ill (%)
People in Group quarters - Hospices or homes for chronically ill (%)
People in Group quarters - Military hospitals or wards for chronically ill (%)
People in Group quarters - Other hospitals or wards for chronically ill (%)
People in Group quarters - Hospitals or wards for drug/alcohol abuse (%)
People in Group quarters - Mental (Psychiatric) hospitals or wards (%)
People in Group quarters - Schools, hospitals, or wards for the mentally retarded (%)
People in Group quarters - Schools, hospitals, or wards for the physically handicapped (%)
People in Group quarters - Institutions for the deaf (%)
People in Group quarters - Institutions for the blind (%)
People in Group quarters - Orthopedic wards and institutions for the physically handicapped (%)
People in Group quarters - Wards in general hospitals for patients who have no usual home elsewhere (%)
People in Group quarters - Wards in military hospitals for patients who have no usual home elsewhere (%)
People in Group quarters - Juvenile institutions (%)
People in Group quarters - Long-term care (%)
People in Group quarters - Homes for abused, dependent, and neglected children (%)
People in Group quarters - Residential treatment centers for emotionally disturbed children (%)
People in Group quarters - Training schools for juvenile delinquents (%)
People in Group quarters - Short-term care, detention or diagnostic centers for delinquent children (%)
People in Group quarters - Type of juvenile institution unknown (%)
People in Group quarters - Noninstitutionalized population (%)
People in Group quarters - College dormitories (includes college quarters off campus) (%)
People in Group quarters - Military quarters (%)
People in Group quarters - On base (%)
People in Group quarters - Barracks, unaccompanied personnel housing (UPH), (Enlisted/Officer), ;and similar group living quarters for military personnel (%)
People in Group quarters - Transient quarters for temporary residents (%)
People in Group quarters - Military ships (%)
People in Group quarters - Group homes (%)
People in Group quarters - Homes or halfway houses for drug/alcohol abuse (%)
People in Group quarters - Homes for the mentally ill (%)
People in Group quarters - Homes for the mentally retarded (%)
People in Group quarters - Homes for the physically handicapped (%)
People in Group quarters - Other group homes (%)
People in Group quarters - Religious group quarters (%)
People in Group quarters - Dormitories (%)
People in Group quarters - Agriculture workers' dormitories on farms (%)
People in Group quarters - Job Corps and vocational training facilities (%)
People in Group quarters - Other workers' dormitories (%)
People in Group quarters - Crews of maritime vessels (%)
People in Group quarters - Other nonhousehold living situations (%)
People in Group quarters - Other noninstitutional group quarters (%)
Residents speaking English at home (%)
Residents speaking English at home - Born in the United States (%)
Residents speaking English at home - Native, born elsewhere (%)
Residents speaking English at home - Foreign born (%)
Residents speaking Spanish at home (%)
Residents speaking Spanish at home - Born in the United States (%)
Residents speaking Spanish at home - Native, born elsewhere (%)
Residents speaking Spanish at home - Foreign born (%)
Residents speaking other language at home (%)
Residents speaking other language at home - Born in the United States (%)
Residents speaking other language at home - Native, born elsewhere (%)
Residents speaking other language at home - Foreign born (%)
Class of Workers - Employee of private company (%)
Class of Workers - Self-employed in own incorporated business (%)
Class of Workers - Private not-for-profit wage and salary workers (%)
Class of Workers - Local government workers (%)
Class of Workers - State government workers (%)
Class of Workers - Federal government workers (%)
Class of Workers - Self-employed workers in own not incorporated business and Unpaid family workers (%)
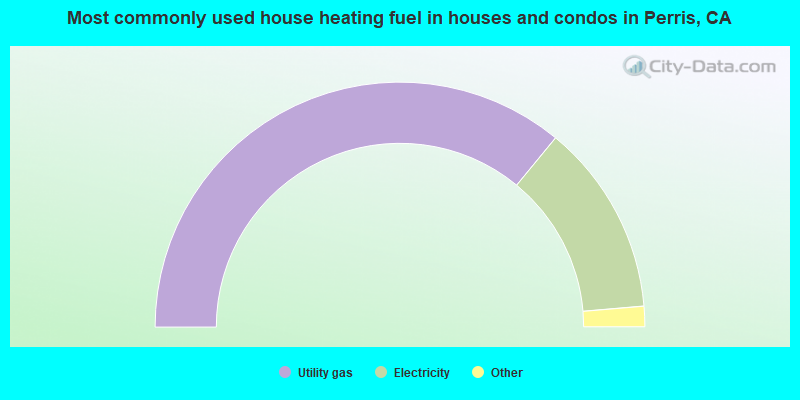
House heating fuel used in houses and condos - Utility gas (%)
House heating fuel used in houses and condos - Bottled, tank, or LP gas (%)
House heating fuel used in houses and condos - Electricity (%)
House heating fuel used in houses and condos - Fuel oil, kerosene, etc. (%)
House heating fuel used in houses and condos - Coal or coke (%)
House heating fuel used in houses and condos - Wood (%)
House heating fuel used in houses and condos - Solar energy (%)
House heating fuel used in houses and condos - Other fuel (%)
House heating fuel used in houses and condos - No fuel used (%)
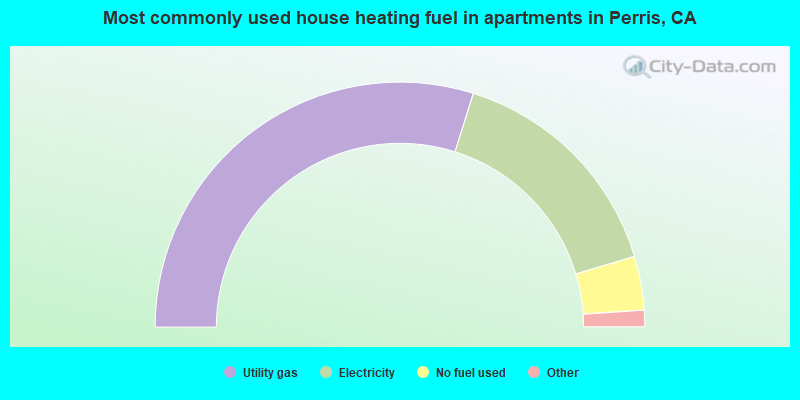
House heating fuel used in apartments - Utility gas (%)
House heating fuel used in apartments - Bottled, tank, or LP gas (%)
House heating fuel used in apartments - Electricity (%)
House heating fuel used in apartments - Fuel oil, kerosene, etc. (%)
House heating fuel used in apartments - Coal or coke (%)
House heating fuel used in apartments - Wood (%)
House heating fuel used in apartments - Solar energy (%)
House heating fuel used in apartments - Other fuel (%)
House heating fuel used in apartments - No fuel used (%)
Armed forces status - In Armed Forces (%)
Armed forces status - Civilian (%)
Armed forces status - Civilian - Veteran (%)
Armed forces status - Civilian - Nonveteran (%)
Fatal accidents locations in years 2005-2021
Fatal accidents locations in 2005
Fatal accidents locations in 2006
Fatal accidents locations in 2007
Fatal accidents locations in 2008
Fatal accidents locations in 2009
Fatal accidents locations in 2010
Fatal accidents locations in 2011
Fatal accidents locations in 2012
Fatal accidents locations in 2013
Fatal accidents locations in 2014
Fatal accidents locations in 2015
Fatal accidents locations in 2016
Fatal accidents locations in 2017
Fatal accidents locations in 2018
Fatal accidents locations in 2019
Fatal accidents locations in 2020
Fatal accidents locations in 2021
Alcohol use - People drinking some alcohol every month (%)
Alcohol use - People not drinking at all (%)
Alcohol use - Average days/month drinking alcohol
Alcohol use - Average drinks/week
Alcohol use - Average days/year people drink much
Audiometry - Average condition of hearing (%)
Audiometry - People that can hear a whisper from across a quiet room (%)
Audiometry - People that can hear normal voice from across a quiet room (%)
Audiometry - Ears ringing, roaring, buzzing (%)
Audiometry - Had a job exposure to loud noise (%)
Audiometry - Had off-work exposure to loud noise (%)
Blood Pressure & Cholesterol - Has high blood pressure (%)
Blood Pressure & Cholesterol - Checking blood pressure at home (%)
Blood Pressure & Cholesterol - Frequently checking blood cholesterol (%)
Blood Pressure & Cholesterol - Has high cholesterol level (%)
Consumer Behavior - Money monthly spent on food at supermarket/grocery store
Consumer Behavior - Money monthly spent on food at other stores
Consumer Behavior - Money monthly spent on eating out
Consumer Behavior - Money monthly spent on carryout/delivered foods
Consumer Behavior - Income spent on food at supermarket/grocery store (%)
Consumer Behavior - Income spent on food at other stores (%)
Consumer Behavior - Income spent on eating out (%)
Consumer Behavior - Income spent on carryout/delivered foods (%)
Current Health Status - General health condition (%)
Current Health Status - Blood donors (%)
Current Health Status - Has blood ever tested for HIV virus (%)
Current Health Status - Left-handed people (%)
Dermatology - People using sunscreen (%)
Diabetes - Diabetics (%)
Diabetes - Had a blood test for high blood sugar (%)
Diabetes - People taking insulin (%)
Diet Behavior & Nutrition - Diet health (%)
Diet Behavior & Nutrition - Milk product consumption (# of products/month)
Diet Behavior & Nutrition - Meals not home prepared (#/week)
Diet Behavior & Nutrition - Meals from fast food or pizza place (#/week)
Diet Behavior & Nutrition - Ready-to-eat foods (#/month)
Diet Behavior & Nutrition - Frozen meals/pizza (#/month)
Drug Use - People that ever used marijuana or hashish (%)
Drug Use - Ever used hard drugs (%)
Drug Use - Ever used any form of cocaine (%)
Drug Use - Ever used heroin (%)
Drug Use - Ever used methamphetamine (%)
Health Insurance - People covered by health insurance (%)
Kidney Conditions-Urology - Avg. # of times urinating at night
Medical Conditions - People with asthma (%)
Medical Conditions - People with anemia (%)
Medical Conditions - People with psoriasis (%)
Medical Conditions - People with overweight (%)
Medical Conditions - Elderly people having difficulties in thinking or remembering (%)
Medical Conditions - People who ever received blood transfusion (%)
Medical Conditions - People having trouble seeing even with glass/contacts (%)
Medical Conditions - People with arthritis (%)
Medical Conditions - People with gout (%)
Medical Conditions - People with congestive heart failure (%)
Medical Conditions - People with coronary heart disease (%)
Medical Conditions - People with angina pectoris (%)
Medical Conditions - People who ever had heart attack (%)
Medical Conditions - People who ever had stroke (%)
Medical Conditions - People with emphysema (%)
Medical Conditions - People with thyroid problem (%)
Medical Conditions - People with chronic bronchitis (%)
Medical Conditions - People with any liver condition (%)
Medical Conditions - People who ever had cancer or malignancy (%)
Mental Health - People who have little interest in doing things (%)
Mental Health - People feeling down, depressed, or hopeless (%)
Mental Health - People who have trouble sleeping or sleeping too much (%)
Mental Health - People feeling tired or having little energy (%)
Mental Health - People with poor appetite or overeating (%)
Mental Health - People feeling bad about themself (%)
Mental Health - People who have trouble concentrating on things (%)
Mental Health - People moving or speaking slowly or too fast (%)
Mental Health - People having thoughts they would be better off dead (%)
Oral Health - Average years since last visit a dentist
Oral Health - People embarrassed because of mouth (%)
Oral Health - People with gum disease (%)
Oral Health - General health of teeth and gums (%)
Oral Health - Average days a week using dental floss/device
Oral Health - Average days a week using mouthwash for dental problem
Oral Health - Average number of teeth
Pesticide Use - Households using pesticides to control insects (%)
Pesticide Use - Households using pesticides to kill weeds (%)
Physical Activity - People doing vigorous-intensity work activities (%)
Physical Activity - People doing moderate-intensity work activities (%)
Physical Activity - People walking or bicycling (%)
Physical Activity - People doing vigorous-intensity recreational activities (%)
Physical Activity - People doing moderate-intensity recreational activities (%)
Physical Activity - Average hours a day doing sedentary activities
Physical Activity - Average hours a day watching TV or videos
Physical Activity - Average hours a day using computer
Physical Functioning - People having limitations keeping them from working (%)
Physical Functioning - People limited in amount of work they can do (%)
Physical Functioning - People that need special equipment to walk (%)
Physical Functioning - People experiencing confusion/memory problems (%)
Physical Functioning - People requiring special healthcare equipment (%)
Prescription Medications - Average number of prescription medicines taking
Preventive Aspirin Use - Adults 40+ taking low-dose aspirin (%)
Reproductive Health - Vaginal deliveries (%)
Reproductive Health - Cesarean deliveries (%)
Reproductive Health - Deliveries resulted in a live birth (%)
Reproductive Health - Pregnancies resulted in a delivery (%)
Reproductive Health - Women breastfeeding newborns (%)
Reproductive Health - Women that had a hysterectomy (%)
Reproductive Health - Women that had both ovaries removed (%)
Reproductive Health - Women that have ever taken birth control pills (%)
Reproductive Health - Women taking birth control pills (%)
Reproductive Health - Women that have ever used Depo-Provera or injectables (%)
Reproductive Health - Women that have ever used female hormones (%)
Sexual Behavior - People 18+ that ever had sex (vaginal, anal, or oral) (%)
Sexual Behavior - Males 18+ that ever had vaginal sex with a woman (%)
Sexual Behavior - Males 18+ that ever performed oral sex on a woman (%)
Sexual Behavior - Males 18+ that ever had anal sex with a woman (%)
Sexual Behavior - Males 18+ that ever had any sex with a man (%)
Sexual Behavior - Females 18+ that ever had vaginal sex with a man (%)
Sexual Behavior - Females 18+ that ever performed oral sex on a man (%)
Sexual Behavior - Females 18+ that ever had anal sex with a man (%)
Sexual Behavior - Females 18+ that ever had any kind of sex with a woman (%)
Sexual Behavior - Average age people first had sex
Sexual Behavior - Average number of female sex partners in lifetime (males 18+)
Sexual Behavior - Average number of female vaginal sex partners in lifetime (males 18+)
Sexual Behavior - Average age people first performed oral sex on a woman (18+)
Sexual Behavior - Average number of woman performed oral sex on in lifetime (18+)
Sexual Behavior - Average number of male sex partners in lifetime (males 18+)
Sexual Behavior - Average number of male anal sex partners in lifetime (males 18+)
Sexual Behavior - Average age people first performed oral sex on a man (18+)
Sexual Behavior - Average number of male oral sex partners in lifetime (18+)
Sexual Behavior - People using protection when performing oral sex (%)
Sexual Behavior - Average number of times people have vaginal or anal sex a year
Sexual Behavior - People having sex without condom (%)
Sexual Behavior - Average number of male sex partners in lifetime (females 18+)
Sexual Behavior - Average number of male vaginal sex partners in lifetime (females 18+)
Sexual Behavior - Average number of female sex partners in lifetime (females 18+)
Sexual Behavior - Circumcised males 18+ (%)
Sleep Disorders - Average hours sleeping at night
Sleep Disorders - People that has trouble sleeping (%)
Smoking-Cigarette Use - People smoking cigarettes (%)
Taste & Smell - People 40+ having problems with smell (%)
Taste & Smell - People 40+ having problems with taste (%)
Taste & Smell - People 40+ that ever had wisdom teeth removed (%)
Taste & Smell - People 40+ that ever had tonsils teeth removed (%)
Taste & Smell - People 40+ that ever had a loss of consciousness because of a head injury (%)
Taste & Smell - People 40+ that ever had a broken nose or other serious injury to face or skull (%)
Taste & Smell - People 40+ that ever had two or more sinus infections (%)
Weight - Average height (inches)
Weight - Average weight (pounds)
Weight - Average BMI
Weight - People that are obese (%)
Weight - People that ever were obese (%)
Weight - People trying to lose weight (%)
58,248 72.6% Hispanic 10,707 13.3% Black alone 7,342 9.1% White alone 1,345 1.7% Asian alone 1,364 1.7% Native Hawaiian and Other 858 1.1% Two or more races 302 0.4% Other race alone 92 0.1% American Indian alone
The City-Data.com crime index weighs serious crimes and violent crimes more heavily. Higher means more crime, U.S. average is 246.1. It adjusts for the number of visitors and daily workers commuting into cities.
- means the value is smaller than the state average.
- means the value is about the same as the state average.
- means the value is bigger than the state average.
- means the value is much bigger than the state average.
Crime rate in Perris detailed stats: murders, rapes, robberies, assaults, burglaries, thefts, arson Officers per 1,000 residents here:
0.01California average:
1.98
Latest news from Perris, CA collected exclusively by city-data.com from local newspapers, TV, and radio stations
Ancestries: American (1.2%).
Current Local Time:
Land area: 31.4 square miles.
Population density: 2,558 people per square mile (average).
24,404 residents are foreign born (26.9% Latin America ).
This city:
30.4%California:
26.5%
Median real estate property taxes paid for housing units with mortgages in 2022: $3,665 (0.8%)Median real estate property taxes paid for housing units with no mortgage in 2022: $2,585 (0.6%)
Nearest city with pop. 50,000+: Perris Valley, CA (2.2 miles
Nearest city with pop. 200,000+: Riverside, CA
Nearest city with pop. 1,000,000+: Los Angeles, CA
Nearest cities:
Latitude: 33.80 N, Longitude: 117.22 W
Daytime population change due to commuting: -1,188 (-1.5%)Workers who live and work in this city: 8,096 (24.0%)
Single-family new house construction building permits:
2022: 127 buildings , average cost: $179,8002021: 156 buildings , average cost: $179,2002020: 145 buildings , average cost: $180,9002019: 137 buildings , average cost: $174,8002018: 115 buildings , average cost: $204,3002017: 176 buildings , average cost: $115,3002016: 157 buildings , average cost: $115,3002015: 141 buildings , average cost: $115,2002014: 119 buildings , average cost: $115,7002013: 120 buildings , average cost: $113,3002012: 60 buildings , average cost: $127,5002011: 63 buildings , average cost: $118,8002010: 207 buildings , average cost: $117,3002009: 147 buildings , average cost: $117,3002008: 107 buildings , average cost: $141,4002007: 599 buildings , average cost: $162,9002006: 812 buildings , average cost: $182,1002005: 1746 buildings , average cost: $165,5002004: 1573 buildings , average cost: $154,7002003: 1269 buildings , average cost: $148,8002002: 492 buildings , average cost: $136,2002001: 145 buildings , average cost: $135,5002000: 9 buildings , average cost: $124,2001999: 186 buildings , average cost: $96,1001998: 85 buildings , average cost: $97,0001997: 116 buildings , average cost: $89,100Unemployment in December 2023:
Population change in the 1990s: +14,134 (+64.1%).
Most common occupations in Perris, CA (%)
Both Males Females
Other production occupations, including supervisors (5.7%)
Building and grounds cleaning and maintenance occupations (4.1%)
Other office and administrative support workers, including supervisors (4.1%)
Driver/sales workers and truck drivers (4.0%)
Assemblers and fabricators (4.0%)
Metal workers and plastic workers (3.9%)
Other sales and related occupations, including supervisors (3.6%)
Driver/sales workers and truck drivers (6.9%)
Other production occupations, including supervisors (6.1%)
Metal workers and plastic workers (5.8%)
Construction traders workers except carpenters, electricians, painters, plumbers, and construction laborers (4.9%)
Electrical equipment mechanics and other installation, maintenance, and repair workers, including supervisors (4.8%)
Building and grounds cleaning and maintenance occupations (4.8%)
Laborers and material movers, hand (4.6%)
Other office and administrative support workers, including supervisors (7.2%)
Cashiers (6.3%)
Other production occupations, including supervisors (5.3%)
Assemblers and fabricators (4.7%)
Information and record clerks, except customer service representatives (4.1%)
Other sales and related occupations, including supervisors (4.0%)
Nursing, psychiatric, and home health aides (3.9%)
Earthquake activity:
Perris-area historical earthquake activity is significantly above California state average. It is 7098% greater than the overall U.S. average. On 6/28/1992 at 11:57:34, a magnitude 7.6 (6.2 MB, 7.6 MS, 7.3 MW, Depth: 0.7 mi, Class: Major, Intensity: VIII - XII) earthquake occurred 47.9 miles away from Perris center, causing 3 deaths ( 1 shaking deaths, 2 other deaths) and 400 injuries, causing $100,000,000 total damage and $40,000,000 insured lossesOn 7/21/1952 at 11:52:14, a magnitude 7.7 (7.7 UK) earthquake occurred 131.1 miles away from Perris center, causing $50,000,000 total damage On 10/16/1999 at 09:46:44, a magnitude 7.4 (6.3 MB, 7.4 MS, 7.2 MW, 7.3 ML) earthquake occurred 67.2 miles away from Perris center On 5/19/1940 at 04:36:40, a magnitude 7.2 (7.2 UK) earthquake occurred 96.6 miles away from the city center, causing $33,000,000 total damage On 4/21/1918 at 22:32:30, a magnitude 6.8 (6.8 UK, Class: Strong, Intensity: VII - IX) earthquake occurred 12.4 miles away from Perris center On 6/28/1992 at 15:05:30, a magnitude 6.9 (6.3 MB, 6.7 MS, 6.5 MW, 6.9 ME, Depth: 3.1 mi) earthquake occurred 41.3 miles away from the city center Magnitude types: body-wave magnitude (MB), energy magnitude (ME), local magnitude (ML), surface-wave magnitude (MS), moment magnitude (MW) Natural disasters: The number of natural disasters in Riverside County (46) is a lot greater than the US average (15).Major Disasters (Presidential) Declared: 27Emergencies Declared: 1Fires: 22, Floods: 20, Storms: 8, Winter Storms: 8, Landslides: 6, Mudslides: 5, Heavy Rains: 2, Earthquake: 1, Flash Flood: 1, Freeze: 1, Hurricane: 1, Tornado: 1, Tropical Storm: 1, Other: 1 (Note: some incidents may be assigned to more than one category). Main business address for: MODTECH HOLDINGS INC PREFABRICATED WOOD BLDGS & COMPONENTS ), NATIONAL RV HOLDINGS INC MOTOR HOMES ).
Hospitals and medical centers in Perris: CENTINELA GRAND INC (2225 NORTH PERRIS BOULEVARD)
Other hospitals and medical centers near Perris: LIFE CARE CENTER OF MENIFEE (Nursing Home, about 6 miles away; SUN CITY, CA)
SHEILA MARIE HOUSE (Hospital, about 6 miles away; MORENO VALLEY, CA)
HOSPICE OF THE VALLEYS (Hospital, about 6 miles away; SUN CITY, CA)
AFVW HEALTH CENTER (Nursing Home, about 7 miles away; RIVERSIDE, CA)
KAISER FOUNDATION HOSPITAL-MORENO VALLEY (about 7 miles away; MORENO VALLEY, CA)
RIVERSIDE COUNTY REGIONAL MEDICAL CENTER (about 8 miles away; MORENO VALLEY, CA)
DAVITA-VALLEY VIEW DIALYSIS (Dialysis Facility, about 9 miles away; MORENO VALLEY, CA)
Airports located in Perris: Amtrak station: PERRIS (B.W. PERRIS INN, 480 REDLANDS AVE.) - Bus Station
Colleges/universities with over 2000 students nearest to Perris:
Moreno Valley College (about 7 miles; Moreno Valley, CA ; Full-time enrollment: 4,650)
University of California-Riverside (about 14 miles; Riverside, CA ; FT enrollment: 20,647)
Mt San Jacinto Community College District (about 15 miles; San Jacinto, CA ; FT enrollment: 8,426)
California Baptist University (about 15 miles; Riverside, CA ; FT enrollment: 6,085)
Riverside City College (about 16 miles; Riverside, CA ; FT enrollment: 10,661)
La Sierra University (about 18 miles; Riverside, CA ; FT enrollment: 2,205)
Loma Linda University (about 18 miles; Loma Linda, CA ; FT enrollment: 2,839)
Public high schools in Perris: PERRIS HIGH Students: 1,698, Location: 175 E. NUEVO RD., Grades: 9-12)CITRUS HILL HIGH Students: 1,303, Location: 18150 WOOD RD., Grades: 9-12)CALIFORNIA MILITARY INSTITUTE Students: 338, Location: 755 N. A ST., Grades: 5-12, Charter school )VAL VERDE HIGH Students: 145, Location: 972 W. MORGAN ST., Grades: 9-12)PERRIS LAKE HIGH (CONTINUATION) Students: 76, Location: 418 W. ELLIS, Grades: 9-12)THE ACADEMY COMMUNITY DAY Students: 70, Location: 515 E. SEVENTH ST., Grades: 7-12)Private high schools in Perris: TEMPLE CHRISTIAN SCHOOL Students: 120, Location: 745 N PERRIS BLVD, Grades: PK-12)
OAK GROVE AT THE RANCH Students: 42, Location: 23115 RIDER ST, Grades: 2-12)
CALIFORNIA RANCH SCHOOL Students: 7, Location: 21135 OLYMPIA AVE, Grades: 2-11)
Biggest public elementary/middle schools in Perris: PINACATE MIDDLE Students: 1,232, Location: 1990 S. A ST., Grades: 7-8)TOMAS RIVERA MIDDLE Students: 1,077, Location: 21675 MARTIN ST., Grades: 6-8)GOOD HOPE ELEMENTARY Students: 548, Location: 24050 THEDA ST., Grades: KG-6)SKY VIEW ELEMENTARY Students: 518, Location: 625 MILDRED ST., Grades: KG-6)VAL VERDE ELEMENTARY Students: 465, Location: 2656 INDIAN AVE., Grades: KG-6)SIERRA VISTA ELEMENTARY Students: 450, Location: 20300 SHERMAN RD., Grades: KG-6)TRIPLE CROWN ELEMENTARY Students: 443, Location: 530 ORANGE AVE., Grades: KG-5)MEAD VALLEY ELEMENTARY Students: 401, Location: 21-100 OLEANDER AVE., Grades: KG-5)AVALON ELEMENTARY Students: 401, Location: 1815 E. RIDER ST., Grades: KG-5)ENCHANTED HILLS ELEMENTARY Students: 381, Location: 1357 MT. BALDY ST., Grades: KG-6)Private elementary/middle schools in Perris: ST JAMES CATHOLIC SCHOOL Students: 162, Location: 250 W 3RD ST, Grades: KG-8)
LIGHTHOUSE CHRISTIAN ACADEMY Students: 3, Location: 23100 BETTY RD, Grades: 2-6)
See full list of schools located in Perris User-submitted facts and corrections:
The Hospital has closed. The City of Perris does not have a hospital that is operating.
Area code has changed to 951
Churches: Calvary Chapel Perris Valley, www.ccpv.us, a non-denominational Christian fellowship
Notable locations in Perris: (A) , McCanna Ranch (B) , May Ranch (C) , Figadota Farm (D) , American Medical Response North Perris (E) , County Rescue Ambulance Service (F) , American Medical Response Perris (G) , Val Verde School District Office (H) , Perris City Hall (I) , Perris Branch Riverside City and County Public Library (J) , California Department of Forestry and Fire Protection Perris (K) , Riverside County Fire Department Station 90 North Perris (L) , Trolley Museum (M) . Display/hide their locations on the map
Shopping Centers: (1) , Perris Town Center Shopping Center (2) . Display/hide their locations on the map
Main business address in Perris include: (A) , NATIONAL RV HOLDINGS INC (B) . Display/hide their locations on the map
Churches in Perris include: (A) , Church of Christ (B) , First Baptist Church (C) , First Congregational Church (D) , Saint James Catholic Church (E) , Temple Christian Church (F) . Display/hide their locations on the map
Cemetery: (1) . Display/hide its location on the map
Parks in Perris include: (1) , Motte Rimrock Reserve (2) , Woodhaven Park (3) , Roy W Kabian Memorial Park (4) . Display/hide their locations on the map
Hotel: (1) . Display/hide its approximate location on the map
Birthplace of: Andrew Green - College basketball player (Boise State Broncos), Dorothy Ford - Actor and model, Elmer Rieger - Baseball player.
Riverside County has a predicted average indoor radon screening level between 2 and 4 pCi/L (pico curies per liter) - Moderate Potential Average household size: This city:
4.2 peopleCalifornia:
2.9 people
Percentage of family households: This city:
87.7%Whole state:
68.7%
Percentage of households with unmarried partners: This city:
8.8%Whole state:
7.2%
Likely homosexual households (counted as self-reported same-sex unmarried-partner households)
Lesbian couples: 0.4% of all households Gay men: 0.3% of all households
People in group quarters in Perris in 2010:
109 people in other noninstitutional facilities
71 people in nursing facilities/skilled-nursing facilities
31 people in group homes intended for adults
26 people in group homes for juveniles (non-correctional)
3 people in residential treatment centers for juveniles (non-correctional)
People in group quarters in Perris in 2000:
105 people in nursing homes
60 people in other group homes
33 people in other noninstitutional group quarters
18 people in college dormitories (includes college quarters off campus)
10 people in homes or halfway houses for drug/alcohol abuse
6 people in short-term care, detention or diagnostic centers for delinquent children
Banks with branches in Perris (2011 data):
Bank of America, National Association: Perris Crossing Branch at 3150 Case Road Building G, branch established on 2008/04/21; Perris Branch at 181 East 4th Street, branch established on 1947/12/01. Info updated 2009/11/18: Bank assets: $1,451,969.3 mil, Deposits: $1,077,176.8 mil, headquarters in Charlotte, NC, positive income , 5782 total offices , Holding Company: Bank Of America Corporation
Wells Fargo Bank, National Association: Perris Branch at 2560 N Perris Blvd., branch established on 2002/11/18. Info updated 2011/04/05: Bank assets: $1,161,490.0 mil, Deposits: $905,653.0 mil, headquarters in Sioux Falls, SD, positive income , 6395 total offices , Holding Company: Wells Fargo & Company
Compass Bank: Perris Branch at 211 East 4th Street, branch established on 1967/01/23. Info updated 2011/02/24: Bank assets: $63,107.0 mil, Deposits: $46,232.4 mil, headquarters in Birmingham, AL, negative income in the last year , Commercial Lending Specialization, 720 total offices , Holding Company: Banco Bilbao Vizcaya Argentaria, S.A.
For population 15 years and over in Perris:
Never married: 44.1%Now married: 44.4%Separated: 2.0%Widowed: 3.9%Divorced: 5.6% For population 25 years and over in Perris:
High school or higher: 71.9%Bachelor's degree or higher: 7.8%Graduate or professional degree: 2.0%Unemployed: 11.6%Mean travel time to work (commute): 32.4 minutes
Education Gini index (Inequality in education) Here:
18.4California average:
15.5
Religion statistics for Perris, CA (based on Riverside County data)
Religion Adherents Congregations Catholic 602,765 51 Evangelical Protestant 240,306 741 Other 77,581 194 Mainline Protestant 29,535 103 Black Protestant 19,170 40 Orthodox 3,647 11 None 1,216,637 -
Source: Clifford Grammich, Kirk Hadaway, Richard Houseal, Dale E.Jones, Alexei Krindatch, Richie Stanley and Richard H.Taylor. 2012. 2010 U.S.Religion Census: Religious Congregations & Membership Study. Association of Statisticians of American Religious Bodies. Jones, Dale E., et al. 2002. Congregations and Membership in the United States 2000. Nashville, TN: Glenmary Research Center. Graphs represent county-level data
Food Environment Statistics: Number of grocery stores : 330Riverside County :
1.60 / 10,000 pop.California :
2.14 / 10,000 pop.
Number of supercenters and club stores : 11Here :
0.05 / 10,000 pop.California :
0.04 / 10,000 pop.
Number of convenience stores (no gas) : 91This county :
0.44 / 10,000 pop.California :
0.62 / 10,000 pop.
Number of convenience stores (with gas) : 311Riverside County :
1.51 / 10,000 pop.State :
1.49 / 10,000 pop.
Number of full-service restaurants : 1,125This county :
5.45 / 10,000 pop.California :
7.42 / 10,000 pop.
Adult obesity rate : This county :
24.5%California :
21.3%
Low-income preschool obesity rate : Riverside County :
15.2%California :
17.9%
Health and Nutrition:
Average overall health of teeth and gums : Perris:
45.4%California:
48.0%
Average BMI : Perris:
28.6California:
28.1
People feeling badly about themselves : Perris:
23.0%California:
20.2%
People not drinking alcohol at all : Perris:
10.3%California:
11.2%
Average hours sleeping at night : Overweight people : This city:
31.4%California:
31.5%
General health condition : This city:
54.0%California:
56.4%
Average condition of hearing : Here:
81.8%California:
80.9%
More about Health and Nutrition of Perris, CA Residents
Local government employment and payroll (March 2022)
Function
Full-time employees
Monthly full-time payroll
Average yearly full-time wage
Part-time employees
Monthly part-time payroll
Other Government Administration
38 $341,076 $107,708 2 $2,534 Streets and Highways
28 $158,692 $68,011 0 $0 Housing and Community Development (Local)
24 $165,544 $82,772 0 $0 Financial Administration
17 $113,811 $80,337 0 $0 Other and Unallocable
9 $46,500 $62,000 0 $0 Welfare
9 $64,381 $85,841 0 $0
Totals for Government
125 $890,004 $85,440 2 $2,534
Perris government finances - Expenditure in 2017 (per resident):
Construction - Housing and Community Development: $9,096,000 ($113.33)
Regular Highways: $2,362,000 ($29.43)Current Operations - Police Protection: $15,256,000 ($190.08)
Regular Highways: $6,402,000 ($79.76)Central Staff Services: $6,294,000 ($78.42)Local Fire Protection: $4,025,000 ($50.15)Water Utilities: $3,231,000 ($40.26)Parks and Recreation: $3,117,000 ($38.83)Protective Inspection and Regulation - Other: $2,077,000 ($25.88)General - Other: $1,949,000 ($24.28)Sewerage: $1,883,000 ($23.46)Housing and Community Development: $1,296,000 ($16.15)Solid Waste Management: $1,172,000 ($14.60)Health - Other: $821,000 ($10.23)Financial Administration: $543,000 ($6.77)General - Interest on Debt: $7,007,000 ($87.30)
Intergovernmental to Local - Other - Police Protection: $14,307,000 ($178.25)
Other - Local Fire Protection: $4,001,000 ($49.85)Other - Water Utilities: $3,976,000 ($49.54)Other - General - Other: $1,760,000 ($21.93)Other Capital Outlay - Regular Highways: $110,000 ($1.37)
Libraries: $86,000 ($1.07)Central Staff Services: $17,000 ($0.21)Total Salaries and Wages: $76,000 ($0.95)
Water Utilities - Interest on Debt: $329,000 ($4.10)
Perris government finances - Revenue in 2017 (per resident):
Charges - Other: $4,334,000 ($54.00)
Sewerage: $2,038,000 ($25.39)Regular Highways: $1,223,000 ($15.24)Solid Waste Management: $1,185,000 ($14.76)Parks and Recreation: $181,000 ($2.26)Federal Intergovernmental - Housing and Community Development: $815,000 ($10.15)
Other: $65,000 ($0.81)Local Intergovernmental - Other: $38,000 ($0.47)
Miscellaneous - Interest Earnings: $7,141,000 ($88.97)
Donations From Private Sources: $6,593,000 ($82.14)Special Assessments: $2,363,000 ($29.44)Fines and Forfeits: $1,009,000 ($12.57)General Revenue - Other: $260,000 ($3.24)Sale of Property: $3,000 ($0.04)Revenue - Water Utilities: $3,612,000 ($45.00)
State Intergovernmental - Other: $2,201,000 ($27.42)
Highways: $1,400,000 ($17.44)General Local Government Support: $54,000 ($0.67)Tax - Property: $11,851,000 ($147.65)
General Sales and Gross Receipts: $11,630,000 ($144.90)Other License: $2,773,000 ($34.55)Public Utilities Sales: $2,496,000 ($31.10)Documentary and Stock Transfer: $286,000 ($3.56)Occupation and Business License - Other: $213,000 ($2.65)Other Selective Sales: $115,000 ($1.43)
Perris government finances - Debt in 2017 (per resident):
Long Term Debt - Beginning Outstanding - Unspecified Public Purpose: $319,099,000 ($3975.67)
Outstanding Unspecified Public Purpose: $311,030,000 ($3875.14)Retired Unspecified Public Purpose: $13,431,000 ($167.34)Issue, Unspecified Public Purpose: $5,361,000 ($66.79)
Perris government finances - Cash and Securities in 2017 (per resident):
Bond Funds - Cash and Securities: $20,489,000 ($255.27)
Other Funds - Cash and Securities: $107,315,000 ($1337.04)
Sinking Funds - Cash and Securities: $124,601,000 ($1552.41)
7.19% of this county's 2021 resident taxpayers lived in other counties in 2020 ($71,521 average adjusted gross income )
Here:
7.19%California average:
5.19%
0.03% of residents moved from foreign countries ($210 average AGI )Riverside County:
0.03%California average:
0.03%
Top counties from which taxpayers relocated into this county between 2020 and 2021:
6.28% of this county's 2020 resident taxpayers moved to other counties in 2021 ($64,593 average adjusted gross income )
Here:
6.28%California average:
6.14%
0.02% of residents moved to foreign countries ($200 average AGI )Riverside County:
0.02%California average:
0.02%
Top counties to which taxpayers relocated from this county between 2020 and 2021:
Businesses in Perris, CA
Name Count Name Count
AutoZone 2 Kroger 1 Baskin-Robbins 1 Little Caesars Pizza 1 Burger King 1 McDonald's 3 Carl\s Jr. 2 Nike 1 Circle K 4 Papa John's Pizza 1 DHL 2 Payless 1 Dennys 1 Pizza Hut 1 Domino's Pizza 1 Popeyes 1 El Pollo Loco 1 RadioShack 1 FedEx 5 Rite Aid 1 GNC 1 Sprint Nextel 1 H&R Block 1 Starbucks 3 Holiday Inn 1 T-Mobile 2 Home Depot 1 Taco Bell 1 IHOP 1 U-Haul 4 Jack In The Box 3 UPS 3 Jones New York 1 Walgreens 1 Just Tires 2 Walmart 1
Strongest AM radio stations in Perris:
KPLS (830 AM; 50 kW; ORANGE, CA; Owner: CRN LICENSES, LLC)
KFI (640 AM; 50 kW; LOS ANGELES, CA; Owner: CAPSTAR TX LIMITED PARTNERSHIP)
KLAC (570 AM; 50 kW; LOS ANGELES, CA; Owner: AMFM RADIO LICENSES, L.L.C.)
KHPY (1670 AM; 10 kW; MORENO VALLEY, CA; Owner: DELBERT L. VAN VOORHIS)
KTNQ (1020 AM; 50 kW; LOS ANGELES, CA; Owner: KTNQ-AM LICENSE CORP.)
KXTA (1150 AM; 50 kW; LOS ANGELES, CA; Owner: CITICASTERS LICENSES, L.P.)
KDIS (1110 AM; 50 kW; PASADENA, CA; Owner: ABC,INC.)
KPRO (1570 AM; 5 kW; RIVERSIDE, CA; Owner: OLIVE L. SHERBAN)
KFWB (980 AM; 50 kW; LOS ANGELES, CA; Owner: INFINITY BROADCASTING OPERATIONS, INC.)
KFMB (760 AM; 50 kW; SAN DIEGO, CA; Owner: MIDWEST TELEVISION, INC.)
KSPN (710 AM; 50 kW; LOS ANGELES, CA; Owner: KABC-AM RADIO, INC.)
KNX (1070 AM; 50 kW; LOS ANGELES, CA; Owner: INFINITY BROADCASTING OPERATIONS, INC.)
KCAL (1410 AM; 5 kW; REDLANDS, CA; Owner: LAZER BROADCASTING CORPORATION)
Strongest FM radio stations in Perris:
KOLA (99.9 FM; SAN BERNARDINO, CA; Owner: INLAND EMPIRE BROADCASTING CORP.)
KVCR (91.9 FM; SAN BERNARDINO, CA; Owner: SAN BERNARDINO COMMUNITY COLLEGE DISTRICT)
KUCR (88.3 FM; RIVERSIDE, CA; Owner: THE REGENTS OF THE UNIV. OF CA)
KUOR-FM (89.1 FM; REDLANDS, CA; Owner: UNIVERSITY OF REDLANDS)
KLRD (90.1 FM; YUCAIPA, CA; Owner: EDUCATIONAL MEDIA FOUNDATION)
KRTM (88.9 FM; TEMECULA, CA; Owner: PENFOLD COMMUNICATIONS, INC.)
KWRP (96.1 FM; SAN JACINTO, CA; Owner: MAGIC BROADCASTING, INC.)
KPLM-FM2 (106.1 FM; SAN JACINTO, CA; Owner: RM BROADCASTING L.L.C.)
KWVE (107.9 FM; SAN CLEMENTE, CA; Owner: CALVARY CHAPEL OF COSTA MESA)
K201AR (88.1 FM; BANNING, CA; Owner: KSGN, INC.)
K232CX (94.3 FM; DESERT HOT SPRINGS, CA; Owner: MCC RADIO, LLC)
KCXX (103.9 FM; LAKE ARROWHEAD, CA; Owner: ALL-PRO BROADCASTING, INC.)
KXFG (92.9 FM; SUN CITY, CA; Owner: INFINITY RADIO OPERATIONS INC.)
K295AI (106.9 FM; MUSCOY, CA; Owner: ASSOCIATION FOR COMMUNITY EDUCATION, INC.)
KXRS (105.7 FM; HEMET, CA; Owner: LAZER BROADCASTING CORPORATION)
KATY-FM (101.3 FM; IDYLLWILD, CA; Owner: ALL PRO BROADCASTING, INC.)
KGGI (99.1 FM; RIVERSIDE, CA; Owner: AMFM RADIO LICENSES, L.L.C.)
KLYY (97.5 FM; RIVERSIDE, CA; Owner: ENTRAVISION HOLDINGS, LLC)
K201CD (88.1 FM; VICTORVILLE, CA; Owner: SAN BERNARDINO COMMNTY COLLEGE DIST.)
K264AF (100.7 FM; GUASTI, CA; Owner: EDUCATIONAL MEDIA FOUNDATION)
TV broadcast stations around Perris:
KTRO-LP (Channel 50; LANCASTER, CA; Owner: ROBERT D. ADELMAN)
KHIZ (Channel 64; BARSTOW, CA; Owner: SUNBELT TELEVISION, INC.)
KVCR-TV (Channel 24; SAN BERNARDINO, CA; Owner: SAN BERNARDINO COMMUNITY COLLEGE DISTRICT)
KBLM-LP (Channel 25; RIVERSIDE/PERRIS, CA; Owner: LOUIS MARTINEZ FAMILY GROUP, LLC)
National Bridge Inventory (NBI) Statistics 40 Number of bridges482ft / 147m Total length1,659,472 Total average daily traffic168,949 Total average daily truck traffic
New bridges - historical statistics
3 1920-1929 1 1930-1939 6 1950-1959 3 1960-1969 3 1970-1979 10 1990-1999 3 2000-2009 10 2010-2019 1 2020-2022
See full National Bridge Inventory statistics for Perris, CA
Home Mortgage Disclosure Act Aggregated Statistics For Year 2009(Based on 2 full and 6 partial tracts) A) FHA, FSA/RHS & VA B) Conventional C) Refinancings D) Home Improvement Loans E) Loans on Dwellings For 5+ Families F) Non-occupant Loans on G) Loans On Manufactured Number Average Value Number Average Value Number Average Value Number Average Value Number Average Value Number Average Value Number Average Value
LOANS ORIGINATED 1,004 $149,307 314 $108,209 276 $172,349 12 $38,894 0 $0 154 $90,919 23 $145,681 APPLICATIONS APPROVED, NOT ACCEPTED 96 $147,256 48 $125,141 64 $173,569 4 $69,870 0 $0 20 $101,596 3 $126,023 APPLICATIONS DENIED 224 $154,449 118 $117,232 191 $168,893 28 $55,323 0 $0 55 $105,487 17 $135,361 APPLICATIONS WITHDRAWN 162 $154,216 76 $107,695 103 $180,141 9 $41,292 2 $5,427,675 42 $94,857 7 $130,039 FILES CLOSED FOR INCOMPLETENESS 36 $156,616 18 $137,864 36 $171,206 2 $105,625 0 $0 8 $105,011 4 $154,145
Aggregated Statistics For Year 2008(Based on 2 full and 6 partial tracts) A) FHA, FSA/RHS & VA B) Conventional C) Refinancings D) Home Improvement Loans E) Loans on Dwellings For 5+ Families F) Non-occupant Loans on G) Loans On Manufactured Number Average Value Number Average Value Number Average Value Number Average Value Number Average Value Number Average Value Number Average Value
LOANS ORIGINATED 651 $192,106 433 $156,504 240 $181,725 39 $79,230 0 $0 137 $123,204 40 $134,675 APPLICATIONS APPROVED, NOT ACCEPTED 68 $188,897 112 $193,248 126 $227,042 9 $150,637 0 $0 28 $155,775 16 $103,927 APPLICATIONS DENIED 192 $209,257 283 $182,993 558 $242,816 93 $71,065 0 $0 96 $160,012 50 $156,212 APPLICATIONS WITHDRAWN 110 $196,711 123 $157,550 139 $240,645 20 $125,804 1 $1,325,000 49 $153,293 10 $177,031 FILES CLOSED FOR INCOMPLETENESS 21 $187,154 40 $202,068 39 $231,848 5 $97,444 0 $0 15 $172,561 4 $177,538
Aggregated Statistics For Year 2007(Based on 2 full and 6 partial tracts) A) FHA, FSA/RHS & VA B) Conventional C) Refinancings D) Home Improvement Loans E) Loans on Dwellings For 5+ Families F) Non-occupant Loans on G) Loans On Manufactured Number Average Value Number Average Value Number Average Value Number Average Value Number Average Value Number Average Value Number Average Value
LOANS ORIGINATED 54 $280,063 1,075 $239,561 1,447 $246,811 206 $166,782 2 $2,615,650 179 $244,217 100 $169,870 APPLICATIONS APPROVED, NOT ACCEPTED 3 $216,450 331 $244,805 521 $255,578 40 $155,313 0 $0 87 $252,497 20 $137,916 APPLICATIONS DENIED 17 $277,321 677 $255,905 1,697 $282,838 310 $149,959 0 $0 144 $262,221 91 $170,029 APPLICATIONS WITHDRAWN 12 $272,402 388 $234,857 585 $266,418 79 $186,935 0 $0 64 $255,728 22 $171,373 FILES CLOSED FOR INCOMPLETENESS 1 $379,900 86 $278,055 243 $284,101 13 $150,151 0 $0 21 $272,656 10 $173,353
Aggregated Statistics For Year 2006(Based on 2 full and 6 partial tracts) A) FHA, FSA/RHS & VA B) Conventional C) Refinancings D) Home Improvement Loans E) Loans on Dwellings For 5+ Families F) Non-occupant Loans on G) Loans On Manufactured Number Average Value Number Average Value Number Average Value Number Average Value Number Average Value Number Average Value Number Average Value
LOANS ORIGINATED 27 $236,464 2,973 $215,625 2,687 $246,201 368 $161,631 2 $549,465 405 $218,398 140 $166,348 APPLICATIONS APPROVED, NOT ACCEPTED 6 $259,005 644 $225,596 725 $254,450 88 $148,113 0 $0 110 $245,839 29 $140,724 APPLICATIONS DENIED 9 $257,333 1,280 $222,259 1,666 $263,340 337 $146,012 0 $0 187 $242,649 106 $162,977 APPLICATIONS WITHDRAWN 12 $205,173 732 $228,468 1,082 $260,359 101 $172,219 0 $0 116 $217,158 33 $163,387 FILES CLOSED FOR INCOMPLETENESS 1 $366,510 172 $221,984 269 $255,476 23 $165,601 0 $0 23 $229,803 10 $196,023
Aggregated Statistics For Year 2005(Based on 2 full and 6 partial tracts) A) FHA, FSA/RHS & VA B) Conventional C) Refinancings D) Home Improvement Loans E) Loans on Dwellings For 5+ Families F) Non-occupant Loans on G) Loans On Manufactured Number Average Value Number Average Value Number Average Value Number Average Value Number Average Value Number Average Value Number Average Value
LOANS ORIGINATED 45 $211,072 3,535 $200,489 2,949 $213,105 314 $151,534 4 $3,370,375 474 $195,027 170 $159,950 APPLICATIONS APPROVED, NOT ACCEPTED 2 $152,390 747 $202,124 601 $218,454 58 $146,499 0 $0 121 $201,855 38 $122,431 APPLICATIONS DENIED 17 $204,048 1,285 $200,987 1,518 $225,409 332 $107,150 0 $0 182 $213,270 115 $143,270 APPLICATIONS WITHDRAWN 12 $246,297 799 $214,411 1,135 $221,934 144 $160,492 0 $0 116 $217,367 78 $146,216 FILES CLOSED FOR INCOMPLETENESS 0 $0 232 $200,931 398 $220,754 16 $95,989 0 $0 20 $214,912 20 $161,333
Aggregated Statistics For Year 2004(Based on 2 full and 6 partial tracts) A) FHA, FSA/RHS & VA B) Conventional C) Refinancings D) Home Improvement Loans E) Loans on Dwellings For 5+ Families F) Non-occupant Loans on G) Loans On Manufactured Number Average Value Number Average Value Number Average Value Number Average Value Number Average Value Number Average Value Number Average Value
LOANS ORIGINATED 116 $198,204 2,523 $166,894 2,740 $167,003 299 $119,126 1 $1,408,680 352 $167,495 144 $137,878 APPLICATIONS APPROVED, NOT ACCEPTED 15 $184,296 519 $172,844 632 $164,011 48 $102,515 0 $0 84 $164,521 45 $112,081 APPLICATIONS DENIED 23 $198,555 801 $168,658 1,193 $166,157 236 $75,600 0 $0 114 $158,115 82 $120,752 APPLICATIONS WITHDRAWN 26 $210,363 698 $201,393 857 $167,829 92 $103,731 0 $0 86 $181,859 35 $131,218 FILES CLOSED FOR INCOMPLETENESS 5 $207,008 172 $197,786 275 $162,387 23 $111,874 0 $0 20 $157,147 16 $125,344
Aggregated Statistics For Year 2003(Based on 2 full and 6 partial tracts) A) FHA, FSA/RHS & VA B) Conventional C) Refinancings D) Home Improvement Loans E) Loans on Dwellings For 5+ Families F) Non-occupant Loans on Number Average Value Number Average Value Number Average Value Number Average Value Number Average Value Number Average Value
LOANS ORIGINATED 356 $157,175 1,508 $134,135 2,631 $119,005 60 $49,399 1 $917,670 271 $123,141 APPLICATIONS APPROVED, NOT ACCEPTED 25 $150,201 352 $144,743 526 $120,129 28 $60,661 1 $797,500 74 $128,986 APPLICATIONS DENIED 59 $164,182 417 $134,245 1,194 $121,211 117 $39,541 1 $127,000 91 $128,663 APPLICATIONS WITHDRAWN 67 $172,347 378 $173,759 751 $123,523 27 $65,144 0 $0 47 $113,189 FILES CLOSED FOR INCOMPLETENESS 22 $178,961 155 $186,754 155 $115,380 5 $88,040 0 $0 13 $131,807
Aggregated Statistics For Year 2002(Based on 2 full and 2 partial tracts) A) FHA, FSA/RHS & VA B) Conventional C) Refinancings D) Home Improvement Loans F) Non-occupant Loans on Number Average Value Number Average Value Number Average Value Number Average Value Number Average Value
LOANS ORIGINATED 387 $125,061 509 $95,287 1,131 $98,055 53 $21,608 123 $95,992 APPLICATIONS APPROVED, NOT ACCEPTED 33 $119,387 98 $102,848 215 $101,689 26 $29,795 17 $83,848 APPLICATIONS DENIED 42 $128,284 155 $91,220 587 $99,079 98 $24,703 42 $93,551 APPLICATIONS WITHDRAWN 46 $122,829 86 $134,941 370 $100,659 17 $30,935 13 $85,851 FILES CLOSED FOR INCOMPLETENESS 11 $121,694 27 $127,833 187 $106,477 1 $113,930 2 $105,935
Aggregated Statistics For Year 2001(Based on 2 full and 2 partial tracts) A) FHA, FSA/RHS & VA B) Conventional C) Refinancings D) Home Improvement Loans E) Loans on Dwellings For 5+ Families F) Non-occupant Loans on Number Average Value Number Average Value Number Average Value Number Average Value Number Average Value Number Average Value
LOANS ORIGINATED 398 $111,207 306 $75,242 726 $89,214 46 $15,268 1 $545,900 100 $82,372 APPLICATIONS APPROVED, NOT ACCEPTED 26 $110,182 65 $78,137 121 $88,517 6 $39,207 0 $0 12 $69,406 APPLICATIONS DENIED 62 $111,315 113 $82,168 507 $78,695 112 $16,893 0 $0 43 $85,027 APPLICATIONS WITHDRAWN 31 $122,174 62 $82,549 286 $92,462 34 $35,642 0 $0 17 $92,288 FILES CLOSED FOR INCOMPLETENESS 15 $95,544 14 $70,594 80 $90,122 3 $28,830 0 $0 8 $78,594
Aggregated Statistics For Year 2000(Based on 2 full and 2 partial tracts) A) FHA, FSA/RHS & VA B) Conventional C) Refinancings D) Home Improvement Loans E) Loans on Dwellings For 5+ Families F) Non-occupant Loans on Number Average Value Number Average Value Number Average Value Number Average Value Number Average Value Number Average Value
LOANS ORIGINATED 350 $97,976 237 $68,371 157 $70,496 41 $26,156 1 $265,830 35 $67,514 APPLICATIONS APPROVED, NOT ACCEPTED 26 $100,453 39 $75,582 39 $61,660 56 $24,782 0 $0 10 $70,989 APPLICATIONS DENIED 62 $97,831 121 $66,241 295 $61,668 127 $22,514 3 $734,093 23 $68,093 APPLICATIONS WITHDRAWN 53 $102,689 51 $62,977 119 $61,457 9 $23,164 1 $60,000 11 $53,854 FILES CLOSED FOR INCOMPLETENESS 6 $101,683 11 $54,517 25 $87,015 1 $21,840 1 $511,730 2 $30,615
Aggregated Statistics For Year 1999(Based on 3 full and 3 partial tracts) A) FHA, FSA/RHS & VA B) Conventional C) Refinancings D) Home Improvement Loans E) Loans on Dwellings For 5+ Families F) Non-occupant Loans on Number Average Value Number Average Value Number Average Value Number Average Value Number Average Value Number Average Value
LOANS ORIGINATED 535 $86,803 192 $62,800 307 $81,540 66 $25,625 10 $100,374 46 $57,757 APPLICATIONS APPROVED, NOT ACCEPTED 21 $95,162 35 $64,603 79 $83,000 61 $20,996 2 $93,875 14 $65,561 APPLICATIONS DENIED 59 $94,989 101 $73,649 383 $67,006 141 $19,322 3 $86,020 18 $68,828 APPLICATIONS WITHDRAWN 68 $91,560 51 $76,284 185 $81,778 9 $28,056 2 $105,645 10 $151,042 FILES CLOSED FOR INCOMPLETENESS 10 $104,866 7 $114,670 68 $79,659 4 $22,002 0 $0 4 $57,830
Detailed HMDA statistics for the following Tracts:
0426.02
, 0426.03 , 0427.06 , 0427.18 , 0427.19 , 0428.00 , 0429.01 , 0429.04
Private Mortgage Insurance Companies Aggregated Statistics For Year 2009(Based on 2 full and 6 partial tracts) A) Conventional B) Refinancings C) Non-occupant Loans on Number Average Value Number Average Value Number Average Value
LOANS ORIGINATED 50 $139,632 0 $0 0 $0 APPLICATIONS APPROVED, NOT ACCEPTED 36 $174,442 4 $217,395 1 $250,370 APPLICATIONS DENIED 10 $145,570 1 $79,840 0 $0 APPLICATIONS WITHDRAWN 6 $167,230 0 $0 0 $0 FILES CLOSED FOR INCOMPLETENESS 6 $205,053 0 $0 0 $0
Aggregated Statistics For Year 2008(Based on 2 full and 6 partial tracts) A) Conventional B) Refinancings C) Non-occupant Loans on D) Loans On Manufactured Number Average Value Number Average Value Number Average Value Number Average Value
LOANS ORIGINATED 183 $203,931 31 $291,024 12 $175,626 1 $151,160 APPLICATIONS APPROVED, NOT ACCEPTED 130 $268,375 86 $329,670 10 $244,112 0 $0 APPLICATIONS DENIED 44 $196,036 4 $242,365 10 $197,526 0 $0 APPLICATIONS WITHDRAWN 9 $199,104 1 $469,550 1 $152,010 0 $0 FILES CLOSED FOR INCOMPLETENESS 2 $211,165 1 $323,820 1 $179,470 0 $0
Aggregated Statistics For Year 2007(Based on 2 full and 6 partial tracts) A) Conventional B) Refinancings C) Non-occupant Loans on D) Loans On Manufactured Number Average Value Number Average Value Number Average Value Number Average Value
LOANS ORIGINATED 202 $313,723 133 $339,618 10 $267,112 5 $189,686 APPLICATIONS APPROVED, NOT ACCEPTED 40 $326,734 45 $352,654 3 $328,757 0 $0 APPLICATIONS DENIED 5 $339,292 11 $336,548 1 $302,000 1 $301,990 APPLICATIONS WITHDRAWN 15 $322,331 16 $363,545 5 $286,750 0 $0 FILES CLOSED FOR INCOMPLETENESS 0 $0 0 $0 0 $0 0 $0
Aggregated Statistics For Year 2006(Based on 2 full and 6 partial tracts) A) Conventional B) Refinancings C) Non-occupant Loans on D) Loans On Manufactured Number Average Value Number Average Value Number Average Value Number Average Value
LOANS ORIGINATED 46 $315,399 58 $338,098 5 $280,224 7 $259,914 APPLICATIONS APPROVED, NOT ACCEPTED 12 $343,902 28 $308,346 0 $0 1 $347,880 APPLICATIONS DENIED 3 $344,867 3 $366,263 2 $200,610 0 $0 APPLICATIONS WITHDRAWN 1 $337,870 8 $342,806 0 $0 1 $176,570 FILES CLOSED FOR INCOMPLETENESS 1 $273,360 0 $0 0 $0 0 $0
Aggregated Statistics For Year 2005(Based on 2 full and 6 partial tracts) A) Conventional B) Refinancings C) Non-occupant Loans on D) Loans On Manufactured Number Average Value Number Average Value Number Average Value Number Average Value
LOANS ORIGINATED 97 $294,982 52 $291,660 6 $279,917 6 $199,187 APPLICATIONS APPROVED, NOT ACCEPTED 30 $271,793 16 $258,439 4 $218,752 2 $132,890 APPLICATIONS DENIED 3 $258,797 3 $336,863 1 $371,720 1 $158,400 APPLICATIONS WITHDRAWN 9 $271,962 4 $316,060 2 $188,930 0 $0 FILES CLOSED FOR INCOMPLETENESS 4 $282,155 2 $177,300 0 $0 0 $0
Aggregated Statistics For Year 2004(Based on 2 full and 6 partial tracts) A) Conventional B) Refinancings C) Non-occupant Loans on D) Loans On Manufactured Number Average Value Number Average Value Number Average Value Number Average Value
LOANS ORIGINATED 179 $219,830 54 $208,769 29 $205,669 5 $183,600 APPLICATIONS APPROVED, NOT ACCEPTED 43 $188,507 33 $150,718 8 $198,088 2 $124,500 APPLICATIONS DENIED 3 $244,993 3 $258,333 1 $115,600 0 $0 APPLICATIONS WITHDRAWN 10 $200,381 0 $0 0 $0 0 $0 FILES CLOSED FOR INCOMPLETENESS 0 $0 1 $185,290 0 $0 1 $99,000
Aggregated Statistics For Year 2003(Based on 2 full and 6 partial tracts) A) Conventional B) Refinancings C) Non-occupant Loans on Number Average Value Number Average Value Number Average Value
LOANS ORIGINATED 227 $171,516 155 $139,281 21 $149,144 APPLICATIONS APPROVED, NOT ACCEPTED 38 $152,774 54 $150,360 5 $126,690 APPLICATIONS DENIED 5 $189,914 4 $158,198 2 $119,910 APPLICATIONS WITHDRAWN 9 $202,498 8 $137,366 4 $163,838 FILES CLOSED FOR INCOMPLETENESS 0 $0 0 $0 0 $0
Aggregated Statistics For Year 2002(Based on 2 full and 2 partial tracts) A) Conventional B) Refinancings C) Non-occupant Loans on Number Average Value Number Average Value Number Average Value
LOANS ORIGINATED 140 $128,776 98 $120,188 12 $102,991 APPLICATIONS APPROVED, NOT ACCEPTED 29 $118,571 26 $115,188 7 $108,223 APPLICATIONS DENIED 4 $160,770 4 $97,778 1 $16,000 APPLICATIONS WITHDRAWN 8 $105,748 5 $128,972 1 $93,990 FILES CLOSED FOR INCOMPLETENESS 1 $74,050 1 $150,000 0 $0
Aggregated Statistics For Year 2001(Based on 2 full and 2 partial tracts) A) Conventional B) Refinancings C) Non-occupant Loans on Number Average Value Number Average Value Number Average Value
LOANS ORIGINATED 88 $102,698 69 $105,580 10 $90,391 APPLICATIONS APPROVED, NOT ACCEPTED 22 $108,482 20 $109,884 3 $77,000 APPLICATIONS DENIED 9 $110,692 2 $81,800 2 $87,800 APPLICATIONS WITHDRAWN 2 $82,405 3 $85,347 0 $0 FILES CLOSED FOR INCOMPLETENESS 2 $82,000 1 $85,000 0 $0
Aggregated Statistics For Year 2000(Based on 2 full and 2 partial tracts) A) Conventional B) Refinancings C) Non-occupant Loans on Number Average Value Number Average Value Number Average Value
LOANS ORIGINATED 92 $84,106 18 $86,801 7 $67,233 APPLICATIONS APPROVED, NOT ACCEPTED 10 $71,083 5 $78,312 2 $65,000 APPLICATIONS DENIED 8 $85,338 1 $64,560 0 $0 APPLICATIONS WITHDRAWN 2 $77,040 2 $75,475 1 $57,000 FILES CLOSED FOR INCOMPLETENESS 0 $0 0 $0 0 $0
Aggregated Statistics For Year 1999(Based on 3 full and 3 partial tracts) A) Conventional B) Refinancings C) Non-occupant Loans on Number Average Value Number Average Value Number Average Value
LOANS ORIGINATED 41 $83,018 29 $92,707 5 $81,786 APPLICATIONS APPROVED, NOT ACCEPTED 6 $82,608 3 $131,167 2 $68,730 APPLICATIONS DENIED 7 $88,211 1 $118,880 3 $69,613 APPLICATIONS WITHDRAWN 0 $0 0 $0 0 $0 FILES CLOSED FOR INCOMPLETENESS 0 $0 0 $0 0 $0
Detailed PMIC statistics for the following Tracts:
0426.02
, 0426.03 , 0427.06 , 0427.18 , 0427.19 , 0428.00 , 0429.01 , 0429.04
Most common first names in Perris, CA among deceased individuals Name Count Lived (average)
Robert 85 72.4 years John 84 75.1 years Mary 80 79.2 years William 74 73.2 years James 71 70.1 years Charles 52 70.8 years Richard 49 65.9 years Jose 45 70.0 years Maria 43 74.9 years Donald 39 68.7 years
Most common last names in Perris, CA among deceased individuals Last name Count Lived (average)
Williams 48 72.1 years Johnson 46 72.0 years Jones 40 73.6 years Smith 36 76.5 years Brown 35 74.7 years Lopez 27 65.9 years Hernandez 25 67.6 years Rodriguez 23 67.4 years Davis 23 72.3 years Jackson 23 69.9 years
Perris compared to California state average:
Median house value below state average. Black race population percentage significantly above state average. Hispanic race population percentage significantly above state average. Median age below state average. Foreign-born population percentage significantly above state average. Length of stay since moving in below state average. House age significantly below state average. Number of college students above state average. Percentage of population with a bachelor's degree or higher significantly below state average.
#2 on the list of "Top 101 cities with largest percentage of females in industries: transportation and warehousing (population 50,000+)"
#4 on the list of "Top 101 cities with largest percentage of females in industries: construction (population 50,000+)"
#7 on the list of "Top 101 cities with largest percentage of females in occupations: material moving occupations (population 50,000+)"
#8 on the list of "Top 101 cities with largest percentage of males in occupations: building and grounds cleaning and maintenance occupations (population 50,000+)"
#8 on the list of "Top 101 cities with the largest differences between daily high and daily low temperatures (population 50,000+)"
#12 on the list of "Top 101 cities with the highest number of auto thefts per 100,000 residents, excludes tourist destinations and others with a lot of outsiders visiting based on city industries data (population 50,000+)"
#15 on the list of "Top 100 cities with longest commuting times (pop. 50,000+)"
#20 on the list of "Top 100 cities with youngest residents (pop. 50,000+)"
#23 on the list of "Top 101 cities with largest percentage of males in occupations: transportation occupations (population 50,000+)"
#23 on the list of "Top 100 least-educated cities (pop. 50,000+)"
#25 on the list of "Top 101 cities with largest percentage of males in occupations: material moving occupations (population 50,000+)"
#25 on the list of "Top 101 cities with the largest percentage population increase from 2000 (population 50,000+)"
#26 on the list of "Top 101 cities with largest percentage of females in occupations: construction and extraction occupations (population 50,000+)"
#26 on the list of "Top 101 cities with largest percentage of males in occupations: health technologists and technicians (population 50,000+)"
#28 on the list of "Top 101 cities with largest percentage of males in industries: construction (population 50,000+)"
#32 on the list of "Top 101 cities with largest percentage of males in industries: transportation and warehousing (population 50,000+)"
#35 on the list of "Top 101 cities with largest percentage of females in industries: other services, except public administration (population 50,000+)"
#35 on the list of "Top 101 cities with largest percentage of males in industries: agriculture, forestry, fishing and hunting (population 50,000+)"
#36 on the list of "Top 101 cities with the least people having Master's or Doctorate degrees (population 50,000+)"
#38 on the list of "Top 101 cities with largest percentage of females in occupations: sales and related occupations (population 50,000+)"
#32 (92571) on the list of "Top 101 zip codes with the lowest 2012 average taxable interest for individuals (pop 5,000+)"
#3 on the list of "Top 101 counties with the highest lead air pollution readings in 2012 (µg/m3 )"
#4 on the list of "Top 101 counties with the highest ground withdrawal of fresh water for public supply"
#11 on the list of "Top 101 counties with the most Catholic adherents"
#11 on the list of "Top 101 counties with the highest total withdrawal of fresh water for public supply"
#12 on the list of "Top 101 counties with the highest carbon monoxide air pollution readings in 2012 (ppm)"
Top Patent Applicants
Gary A. Demos (25)
Jesse Flores (9)
Robert Harrison (9)
Felipe Almanza (7)
Jesus Flores (5)
Robert P. Barbier (5)
Robert Barbier (4)
Gary Demos (3)
Oviedo Arciniega (3)
Steven L. Harris (3)
Total of 110 patent applications in 2008-2024.
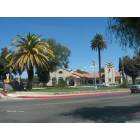
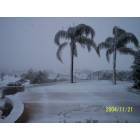
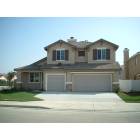
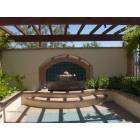
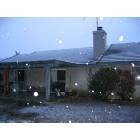
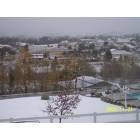
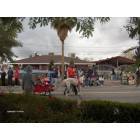


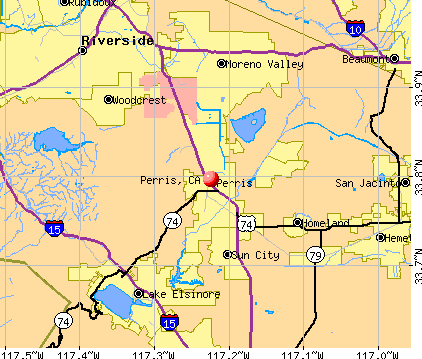


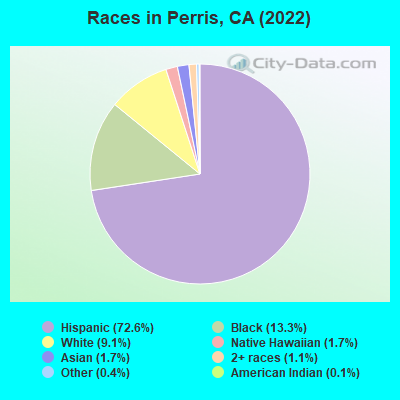
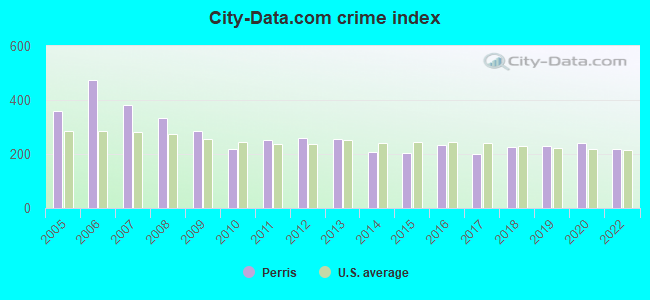
 Recent articles from our blog. Our writers, many of them Ph.D. graduates or candidates, create easy-to-read articles on a wide variety of topics.


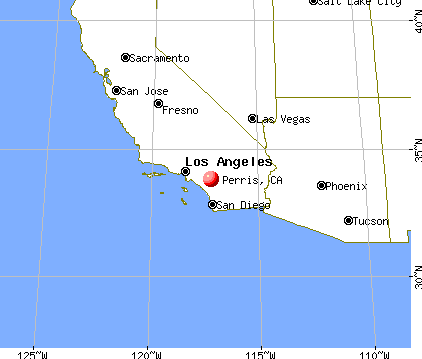
 , pop. 144,533).
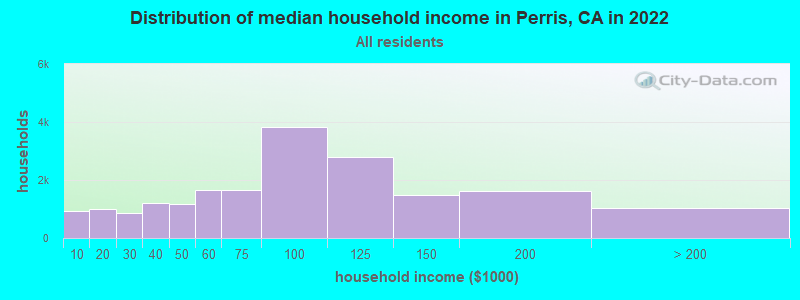
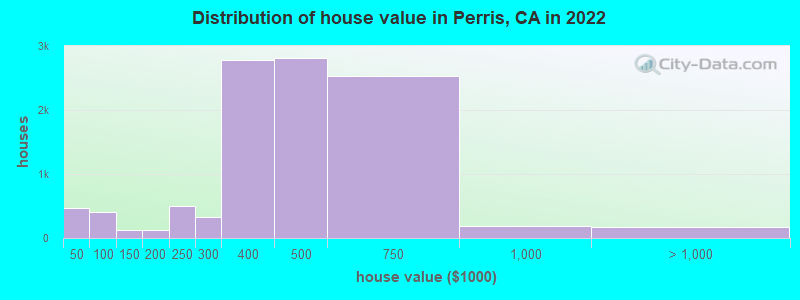
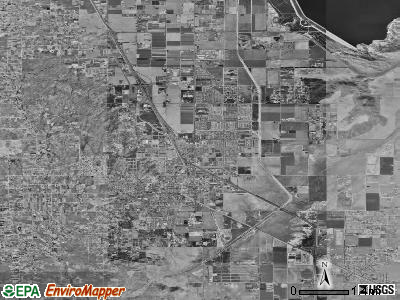
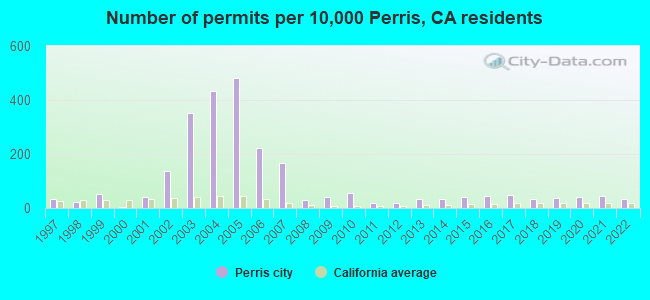
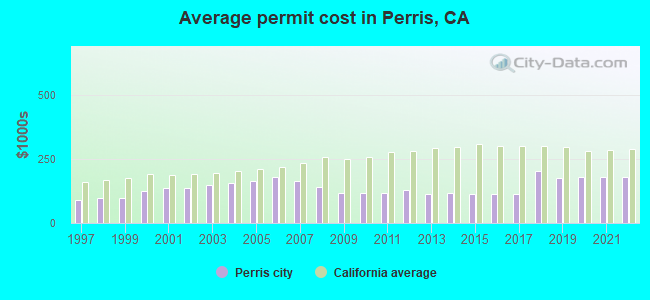
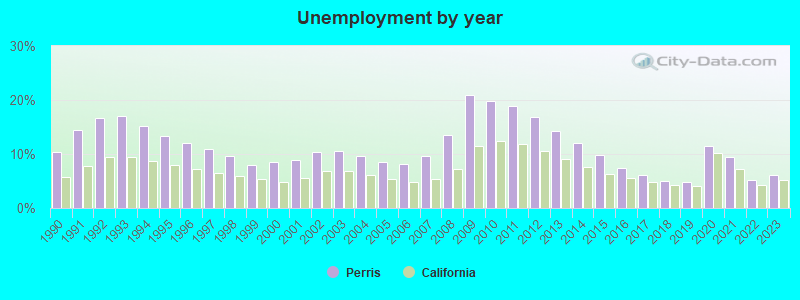
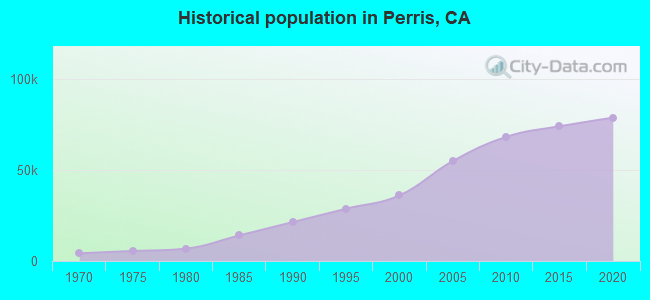
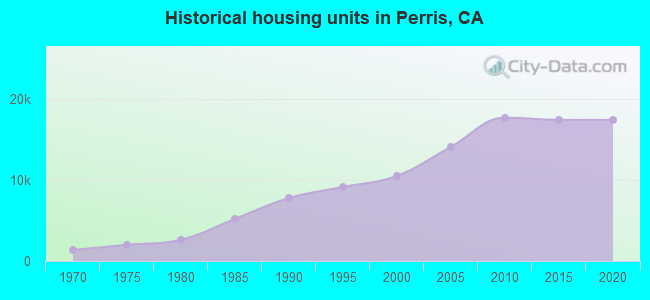
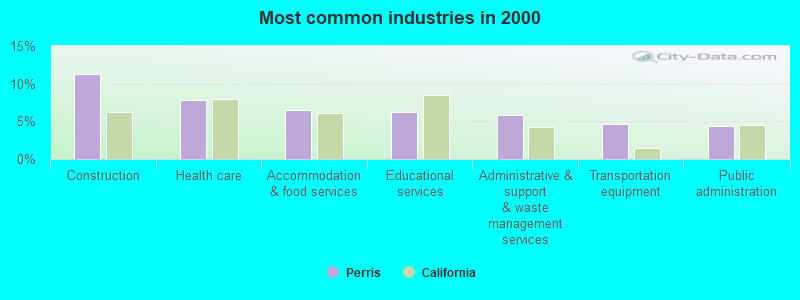
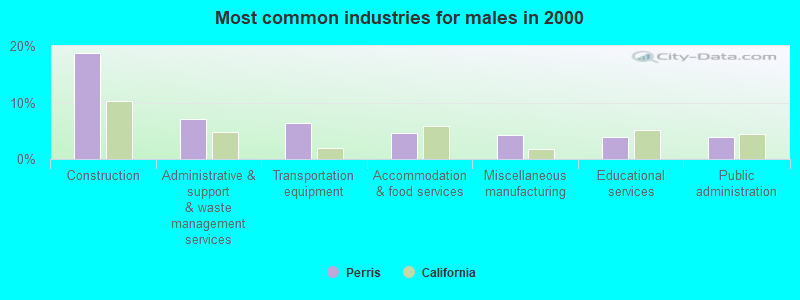
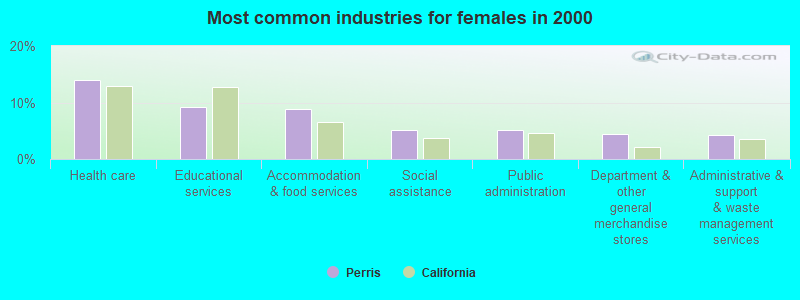
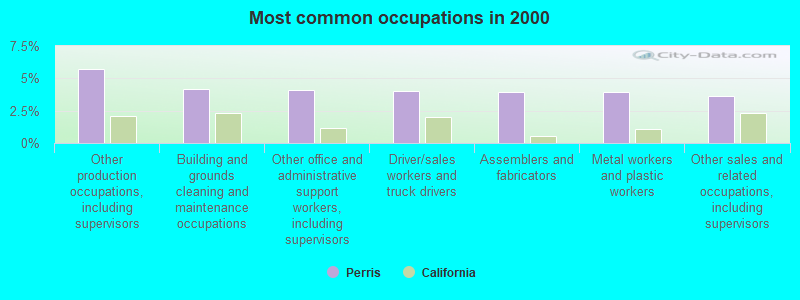
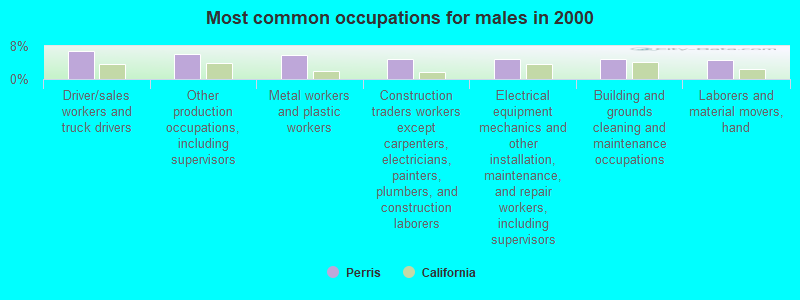
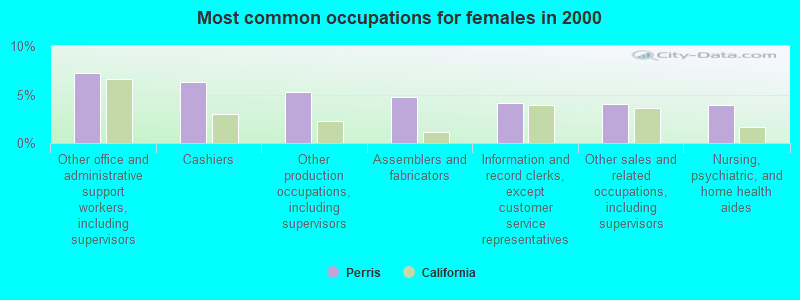

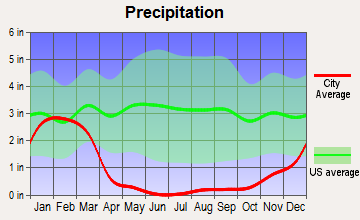
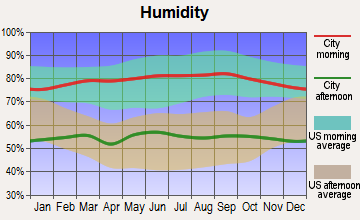
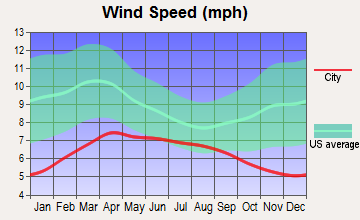
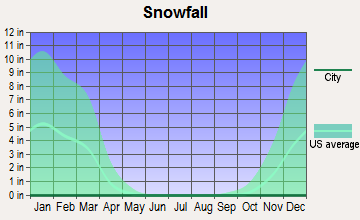
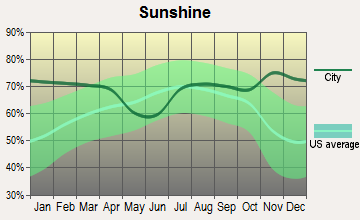
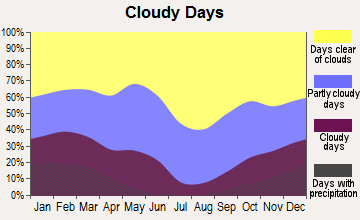
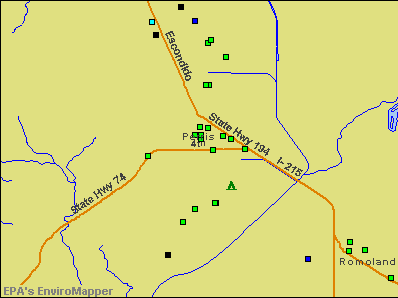

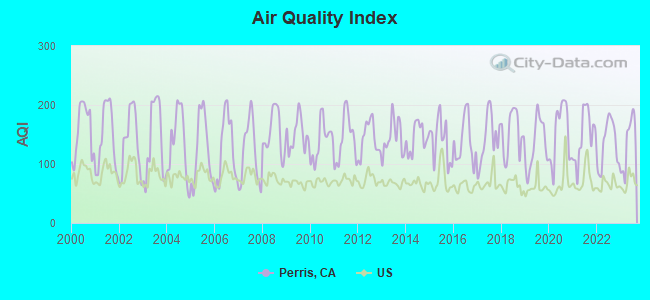
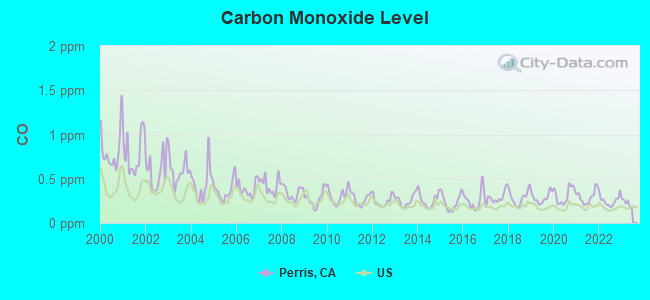
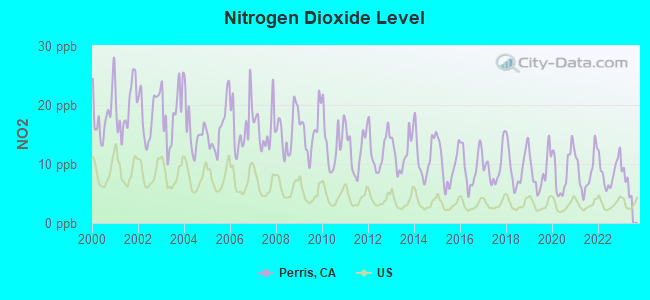
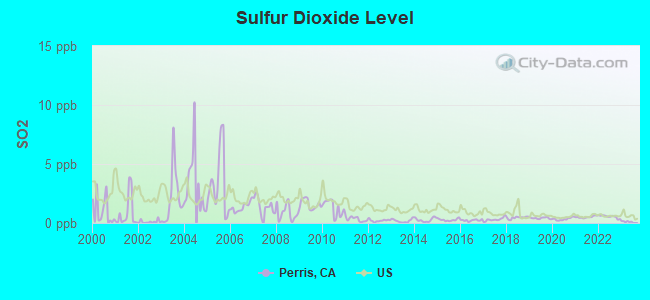
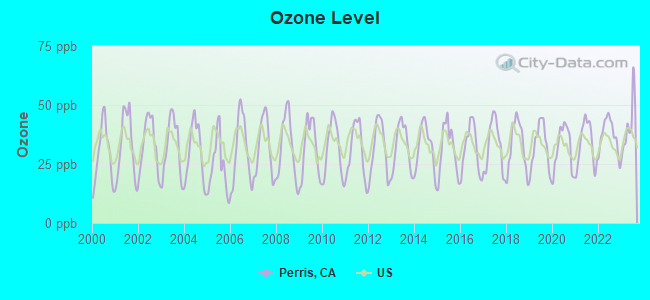
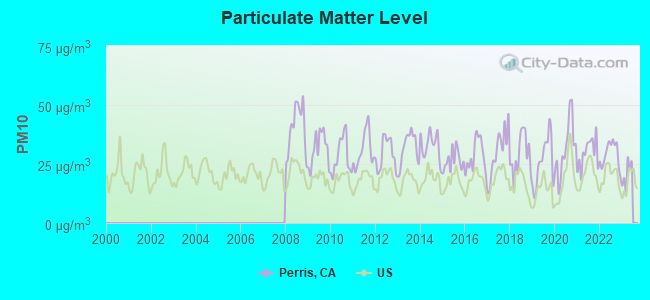
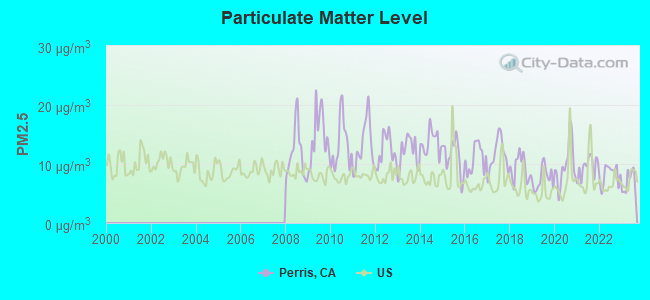
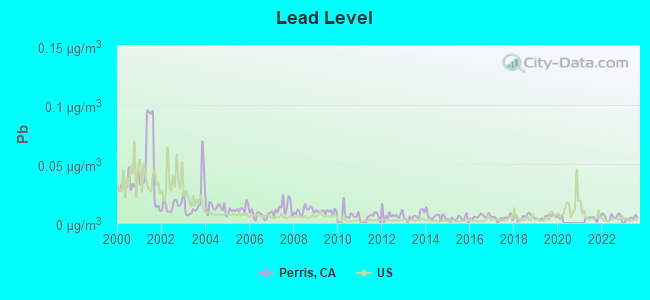
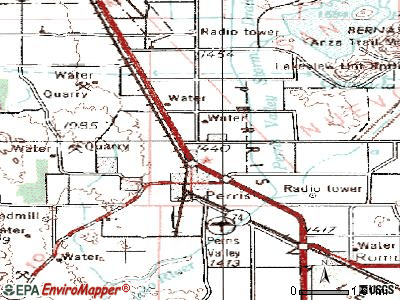
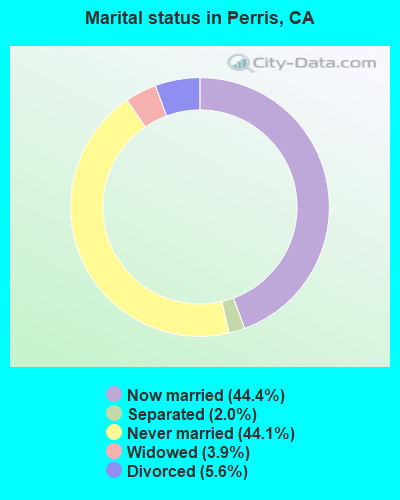
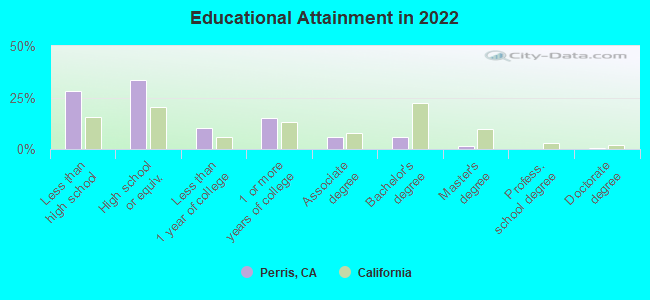
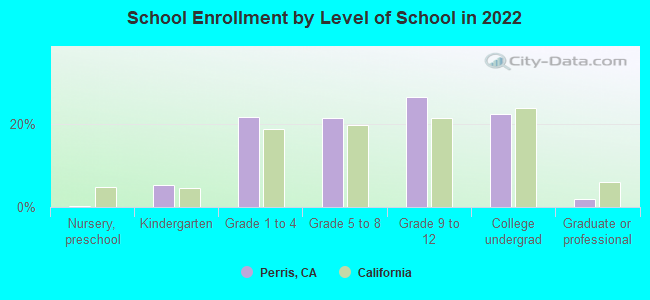

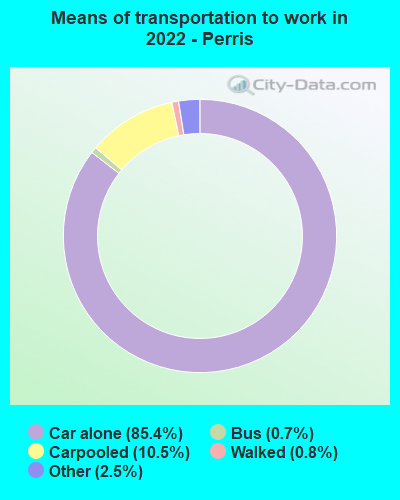


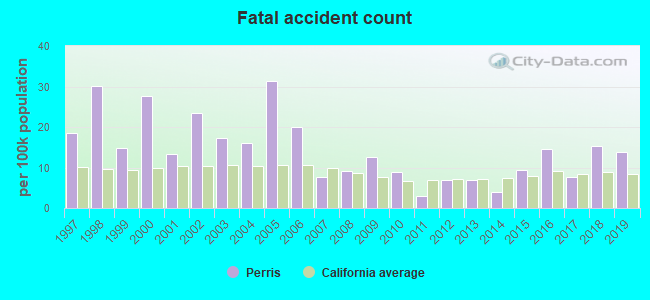
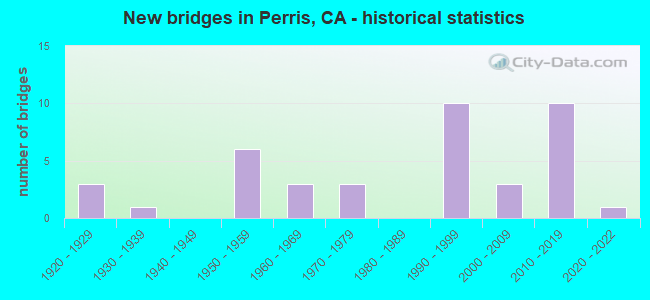
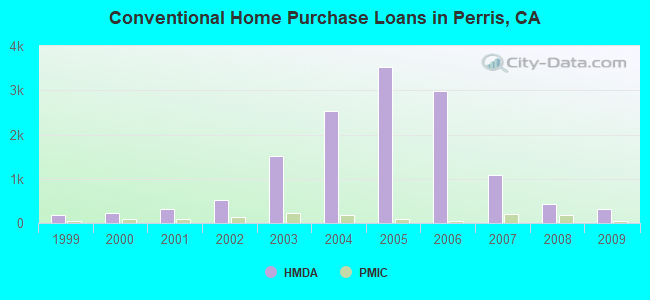
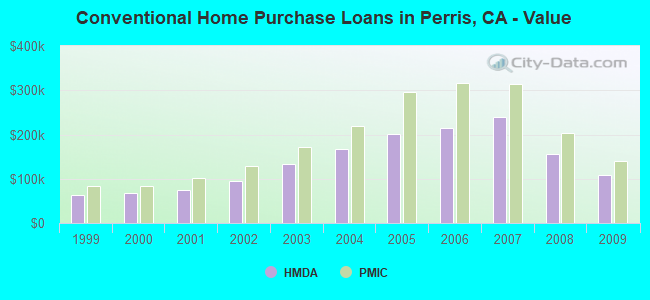
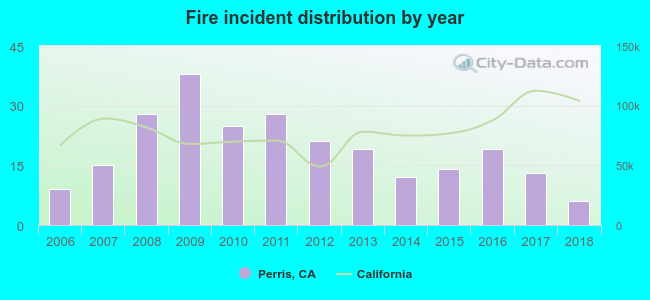 Based on the data from the years 2006 - 2018 the average number of fires per year is 19. The highest number of reported fire incidents - 38 took place in 2009, and the least - 6 in 2018. The data has a decreasing trend.
 When looking into fire subcategories, the most reports belonged to: Outside Fires (61.5%), and Mobile Property/Vehicle Fires (19.4%).