Ridgeland, Mississippi Submit your own pictures of this city and show them to the world
OSM Map
General Map
Google Map
MSN Map
OSM Map
General Map
Google Map
MSN Map
OSM Map
General Map
Google Map
MSN Map
OSM Map
General Map
Google Map
MSN Map
Please wait while loading the map...
Population in 2022: 24,404 (98% urban, 2% rural). Population change since 2000: +21.0%Males: 11,226 Females: 13,178
March 2022 cost of living index in Ridgeland: 85.5 (less than average, U.S. average is 100) Percentage of residents living in poverty in 2022: 7.3%for White Non-Hispanic residents , 6.1% for Black residents , 13.9% for Hispanic or Latino residents , 1.3% for other race residents , 30.9% for two or more races residents )
Profiles of local businesses
Business Search - 14 Million verified businesses
Data:
Median household income ($)
Median household income (% change since 2000)
Household income diversity
Ratio of average income to average house value (%)
Ratio of average income to average rent
Median household income ($) - White
Median household income ($) - Black or African American
Median household income ($) - Asian
Median household income ($) - Hispanic or Latino
Median household income ($) - American Indian and Alaska Native
Median household income ($) - Multirace
Median household income ($) - Other Race
Median household income for houses/condos with a mortgage ($)
Median household income for apartments without a mortgage ($)
Races - White alone (%)
Races - White alone (% change since 2000)
Races - Black alone (%)
Races - Black alone (% change since 2000)
Races - American Indian alone (%)
Races - American Indian alone (% change since 2000)
Races - Asian alone (%)
Races - Asian alone (% change since 2000)
Races - Hispanic (%)
Races - Hispanic (% change since 2000)
Races - Native Hawaiian and Other Pacific Islander alone (%)
Races - Native Hawaiian and Other Pacific Islander alone (% change since 2000)
Races - Two or more races (%)
Races - Two or more races (% change since 2000)
Races - Other race alone (%)
Races - Other race alone (% change since 2000)
Racial diversity
Unemployment (%)
Unemployment (% change since 2000)
Unemployment (%) - White
Unemployment (%) - Black or African American
Unemployment (%) - Asian
Unemployment (%) - Hispanic or Latino
Unemployment (%) - American Indian and Alaska Native
Unemployment (%) - Multirace
Unemployment (%) - Other Race
Population density (people per square mile)
Population - Males (%)
Population - Females (%)
Population - Males (%) - White
Population - Males (%) - Black or African American
Population - Males (%) - Asian
Population - Males (%) - Hispanic or Latino
Population - Males (%) - American Indian and Alaska Native
Population - Males (%) - Multirace
Population - Males (%) - Other Race
Population - Females (%) - White
Population - Females (%) - Black or African American
Population - Females (%) - Asian
Population - Females (%) - Hispanic or Latino
Population - Females (%) - American Indian and Alaska Native
Population - Females (%) - Multirace
Population - Females (%) - Other Race
Coronavirus confirmed cases (Apr 24, 2024)
Deaths caused by coronavirus (Apr 24, 2024)
Coronavirus confirmed cases (per 100k population) (Apr 24, 2024)
Deaths caused by coronavirus (per 100k population) (Apr 24, 2024)
Daily increase in number of cases (Apr 24, 2024)
Weekly increase in number of cases (Apr 24, 2024)
Cases doubled (in days) (Apr 24, 2024)
Hospitalized patients (Apr 18, 2022)
Negative test results (Apr 18, 2022)
Total test results (Apr 18, 2022)
COVID Vaccine doses distributed (per 100k population) (Sep 19, 2023)
COVID Vaccine doses administered (per 100k population) (Sep 19, 2023)
COVID Vaccine doses distributed (Sep 19, 2023)
COVID Vaccine doses administered (Sep 19, 2023)
Likely homosexual households (%)
Likely homosexual households (% change since 2000)
Likely homosexual households - Lesbian couples (%)
Likely homosexual households - Lesbian couples (% change since 2000)
Likely homosexual households - Gay men (%)
Likely homosexual households - Gay men (% change since 2000)
Cost of living index
Median gross rent ($)
Median contract rent ($)
Median monthly housing costs ($)
Median house or condo value ($)
Median house or condo value ($ change since 2000)
Mean house or condo value by units in structure - 1, detached ($)
Mean house or condo value by units in structure - 1, attached ($)
Mean house or condo value by units in structure - 2 ($)
Mean house or condo value by units in structure by units in structure - 3 or 4 ($)
Mean house or condo value by units in structure - 5 or more ($)
Mean house or condo value by units in structure - Boat, RV, van, etc. ($)
Mean house or condo value by units in structure - Mobile home ($)
Median house or condo value ($) - White
Median house or condo value ($) - Black or African American
Median house or condo value ($) - Asian
Median house or condo value ($) - Hispanic or Latino
Median house or condo value ($) - American Indian and Alaska Native
Median house or condo value ($) - Multirace
Median house or condo value ($) - Other Race
Median resident age
Resident age diversity
Median resident age - Males
Median resident age - Females
Median resident age - White
Median resident age - Black or African American
Median resident age - Asian
Median resident age - Hispanic or Latino
Median resident age - American Indian and Alaska Native
Median resident age - Multirace
Median resident age - Other Race
Median resident age - Males - White
Median resident age - Males - Black or African American
Median resident age - Males - Asian
Median resident age - Males - Hispanic or Latino
Median resident age - Males - American Indian and Alaska Native
Median resident age - Males - Multirace
Median resident age - Males - Other Race
Median resident age - Females - White
Median resident age - Females - Black or African American
Median resident age - Females - Asian
Median resident age - Females - Hispanic or Latino
Median resident age - Females - American Indian and Alaska Native
Median resident age - Females - Multirace
Median resident age - Females - Other Race
Commute - mean travel time to work (minutes)
Travel time to work - Less than 5 minutes (%)
Travel time to work - Less than 5 minutes (% change since 2000)
Travel time to work - 5 to 9 minutes (%)
Travel time to work - 5 to 9 minutes (% change since 2000)
Travel time to work - 10 to 19 minutes (%)
Travel time to work - 10 to 19 minutes (% change since 2000)
Travel time to work - 20 to 29 minutes (%)
Travel time to work - 20 to 29 minutes (% change since 2000)
Travel time to work - 30 to 39 minutes (%)
Travel time to work - 30 to 39 minutes (% change since 2000)
Travel time to work - 40 to 59 minutes (%)
Travel time to work - 40 to 59 minutes (% change since 2000)
Travel time to work - 60 to 89 minutes (%)
Travel time to work - 60 to 89 minutes (% change since 2000)
Travel time to work - 90 or more minutes (%)
Travel time to work - 90 or more minutes (% change since 2000)
Marital status - Never married (%)
Marital status - Now married (%)
Marital status - Separated (%)
Marital status - Widowed (%)
Marital status - Divorced (%)
Median family income ($)
Median family income (% change since 2000)
Median non-family income ($)
Median non-family income (% change since 2000)
Median per capita income ($)
Median per capita income (% change since 2000)
Median family income ($) - White
Median family income ($) - Black or African American
Median family income ($) - Asian
Median family income ($) - Hispanic or Latino
Median family income ($) - American Indian and Alaska Native
Median family income ($) - Multirace
Median family income ($) - Other Race
Median year house/condo built
Median year apartment built
Year house built - Built 2005 or later (%)
Year house built - Built 2000 to 2004 (%)
Year house built - Built 1990 to 1999 (%)
Year house built - Built 1980 to 1989 (%)
Year house built - Built 1970 to 1979 (%)
Year house built - Built 1960 to 1969 (%)
Year house built - Built 1950 to 1959 (%)
Year house built - Built 1940 to 1949 (%)
Year house built - Built 1939 or earlier (%)
Average household size
Household density (households per square mile)
Average household size - White
Average household size - Black or African American
Average household size - Asian
Average household size - Hispanic or Latino
Average household size - American Indian and Alaska Native
Average household size - Multirace
Average household size - Other Race
Occupied housing units (%)
Vacant housing units (%)
Owner occupied housing units (%)
Renter occupied housing units (%)
Vacancy status - For rent (%)
Vacancy status - For sale only (%)
Vacancy status - Rented or sold, not occupied (%)
Vacancy status - For seasonal, recreational, or occasional use (%)
Vacancy status - For migrant workers (%)
Vacancy status - Other vacant (%)
Residents with income below the poverty level (%)
Residents with income below 50% of the poverty level (%)
Children below poverty level (%)
Poor families by family type - Married-couple family (%)
Poor families by family type - Male, no wife present (%)
Poor families by family type - Female, no husband present (%)
Poverty status for native-born residents (%)
Poverty status for foreign-born residents (%)
Poverty among high school graduates not in families (%)
Poverty among people who did not graduate high school not in families (%)
Residents with income below the poverty level (%) - White
Residents with income below the poverty level (%) - Black or African American
Residents with income below the poverty level (%) - Asian
Residents with income below the poverty level (%) - Hispanic or Latino
Residents with income below the poverty level (%) - American Indian and Alaska Native
Residents with income below the poverty level (%) - Multirace
Residents with income below the poverty level (%) - Other Race
Air pollution - Air Quality Index (AQI)
Air pollution - CO
Air pollution - NO2
Air pollution - SO2
Air pollution - Ozone
Air pollution - PM10
Air pollution - PM25
Air pollution - Pb
Crime - Murders per 100,000 population
Crime - Rapes per 100,000 population
Crime - Robberies per 100,000 population
Crime - Assaults per 100,000 population
Crime - Burglaries per 100,000 population
Crime - Thefts per 100,000 population
Crime - Auto thefts per 100,000 population
Crime - Arson per 100,000 population
Crime - City-data.com crime index
Crime - Violent crime index
Crime - Property crime index
Crime - Murders per 100,000 population (5 year average)
Crime - Rapes per 100,000 population (5 year average)
Crime - Robberies per 100,000 population (5 year average)
Crime - Assaults per 100,000 population (5 year average)
Crime - Burglaries per 100,000 population (5 year average)
Crime - Thefts per 100,000 population (5 year average)
Crime - Auto thefts per 100,000 population (5 year average)
Crime - Arson per 100,000 population (5 year average)
Crime - City-data.com crime index (5 year average)
Crime - Violent crime index (5 year average)
Crime - Property crime index (5 year average)
1996 Presidential Elections Results (%) - Democratic Party (Clinton)
1996 Presidential Elections Results (%) - Republican Party (Dole)
1996 Presidential Elections Results (%) - Other
2000 Presidential Elections Results (%) - Democratic Party (Gore)
2000 Presidential Elections Results (%) - Republican Party (Bush)
2000 Presidential Elections Results (%) - Other
2004 Presidential Elections Results (%) - Democratic Party (Kerry)
2004 Presidential Elections Results (%) - Republican Party (Bush)
2004 Presidential Elections Results (%) - Other
2008 Presidential Elections Results (%) - Democratic Party (Obama)
2008 Presidential Elections Results (%) - Republican Party (McCain)
2008 Presidential Elections Results (%) - Other
2012 Presidential Elections Results (%) - Democratic Party (Obama)
2012 Presidential Elections Results (%) - Republican Party (Romney)
2012 Presidential Elections Results (%) - Other
2016 Presidential Elections Results (%) - Democratic Party (Clinton)
2016 Presidential Elections Results (%) - Republican Party (Trump)
2016 Presidential Elections Results (%) - Other
2020 Presidential Elections Results (%) - Democratic Party (Biden)
2020 Presidential Elections Results (%) - Republican Party (Trump)
2020 Presidential Elections Results (%) - Other
Ancestries Reported - Arab (%)
Ancestries Reported - Czech (%)
Ancestries Reported - Danish (%)
Ancestries Reported - Dutch (%)
Ancestries Reported - English (%)
Ancestries Reported - French (%)
Ancestries Reported - French Canadian (%)
Ancestries Reported - German (%)
Ancestries Reported - Greek (%)
Ancestries Reported - Hungarian (%)
Ancestries Reported - Irish (%)
Ancestries Reported - Italian (%)
Ancestries Reported - Lithuanian (%)
Ancestries Reported - Norwegian (%)
Ancestries Reported - Polish (%)
Ancestries Reported - Portuguese (%)
Ancestries Reported - Russian (%)
Ancestries Reported - Scotch-Irish (%)
Ancestries Reported - Scottish (%)
Ancestries Reported - Slovak (%)
Ancestries Reported - Subsaharan African (%)
Ancestries Reported - Swedish (%)
Ancestries Reported - Swiss (%)
Ancestries Reported - Ukrainian (%)
Ancestries Reported - United States (%)
Ancestries Reported - Welsh (%)
Ancestries Reported - West Indian (%)
Ancestries Reported - Other (%)
Educational Attainment - No schooling completed (%)
Educational Attainment - Less than high school (%)
Educational Attainment - High school or equivalent (%)
Educational Attainment - Less than 1 year of college (%)
Educational Attainment - 1 or more years of college (%)
Educational Attainment - Associate degree (%)
Educational Attainment - Bachelor's degree (%)
Educational Attainment - Master's degree (%)
Educational Attainment - Professional school degree (%)
Educational Attainment - Doctorate degree (%)
School Enrollment - Nursery, preschool (%)
School Enrollment - Kindergarten (%)
School Enrollment - Grade 1 to 4 (%)
School Enrollment - Grade 5 to 8 (%)
School Enrollment - Grade 9 to 12 (%)
School Enrollment - College undergrad (%)
School Enrollment - Graduate or professional (%)
School Enrollment - Not enrolled in school (%)
School enrollment - Public schools (%)
School enrollment - Private schools (%)
School enrollment - Not enrolled (%)
Median number of rooms in houses and condos
Median number of rooms in apartments
Housing units lacking complete plumbing facilities (%)
Housing units lacking complete kitchen facilities (%)
Density of houses
Urban houses (%)
Rural houses (%)
Households with people 60 years and over (%)
Households with people 65 years and over (%)
Households with people 75 years and over (%)
Households with one or more nonrelatives (%)
Households with no nonrelatives (%)
Population in households (%)
Family households (%)
Nonfamily households (%)
Population in families (%)
Family households with own children (%)
Median number of bedrooms in owner occupied houses
Mean number of bedrooms in owner occupied houses
Median number of bedrooms in renter occupied houses
Mean number of bedrooms in renter occupied houses
Median number of vehichles in owner occupied houses
Mean number of vehichles in owner occupied houses
Median number of vehichles in renter occupied houses
Mean number of vehichles in renter occupied houses
Mortgage status - with mortgage (%)
Mortgage status - with second mortgage (%)
Mortgage status - with home equity loan (%)
Mortgage status - with both second mortgage and home equity loan (%)
Mortgage status - without a mortgage (%)
Average family size
Average family size - White
Average family size - Black or African American
Average family size - Asian
Average family size - Hispanic or Latino
Average family size - American Indian and Alaska Native
Average family size - Multirace
Average family size - Other Race
Geographical mobility - Same house 1 year ago (%)
Geographical mobility - Moved within same county (%)
Geographical mobility - Moved from different county within same state (%)
Geographical mobility - Moved from different state (%)
Geographical mobility - Moved from abroad (%)
Place of birth - Born in state of residence (%)
Place of birth - Born in other state (%)
Place of birth - Native, outside of US (%)
Place of birth - Foreign born (%)
Housing units in structures - 1, detached (%)
Housing units in structures - 1, attached (%)
Housing units in structures - 2 (%)
Housing units in structures - 3 or 4 (%)
Housing units in structures - 5 to 9 (%)
Housing units in structures - 10 to 19 (%)
Housing units in structures - 20 to 49 (%)
Housing units in structures - 50 or more (%)
Housing units in structures - Mobile home (%)
Housing units in structures - Boat, RV, van, etc. (%)
House/condo owner moved in on average (years ago)
Renter moved in on average (years ago)
Year householder moved into unit - Moved in 1999 to March 2000 (%)
Year householder moved into unit - Moved in 1995 to 1998 (%)
Year householder moved into unit - Moved in 1990 to 1994 (%)
Year householder moved into unit - Moved in 1980 to 1989 (%)
Year householder moved into unit - Moved in 1970 to 1979 (%)
Year householder moved into unit - Moved in 1969 or earlier (%)
Means of transportation to work - Drove car alone (%)
Means of transportation to work - Carpooled (%)
Means of transportation to work - Public transportation (%)
Means of transportation to work - Bus or trolley bus (%)
Means of transportation to work - Streetcar or trolley car (%)
Means of transportation to work - Subway or elevated (%)
Means of transportation to work - Railroad (%)
Means of transportation to work - Ferryboat (%)
Means of transportation to work - Taxicab (%)
Means of transportation to work - Motorcycle (%)
Means of transportation to work - Bicycle (%)
Means of transportation to work - Walked (%)
Means of transportation to work - Other means (%)
Working at home (%)
Industry diversity
Most Common Industries - Agriculture, forestry, fishing and hunting, and mining (%)
Most Common Industries - Agriculture, forestry, fishing and hunting (%)
Most Common Industries - Mining, quarrying, and oil and gas extraction (%)
Most Common Industries - Construction (%)
Most Common Industries - Manufacturing (%)
Most Common Industries - Wholesale trade (%)
Most Common Industries - Retail trade (%)
Most Common Industries - Transportation and warehousing, and utilities (%)
Most Common Industries - Transportation and warehousing (%)
Most Common Industries - Utilities (%)
Most Common Industries - Information (%)
Most Common Industries - Finance and insurance, and real estate and rental and leasing (%)
Most Common Industries - Finance and insurance (%)
Most Common Industries - Real estate and rental and leasing (%)
Most Common Industries - Professional, scientific, and management, and administrative and waste management services (%)
Most Common Industries - Professional, scientific, and technical services (%)
Most Common Industries - Management of companies and enterprises (%)
Most Common Industries - Administrative and support and waste management services (%)
Most Common Industries - Educational services, and health care and social assistance (%)
Most Common Industries - Educational services (%)
Most Common Industries - Health care and social assistance (%)
Most Common Industries - Arts, entertainment, and recreation, and accommodation and food services (%)
Most Common Industries - Arts, entertainment, and recreation (%)
Most Common Industries - Accommodation and food services (%)
Most Common Industries - Other services, except public administration (%)
Most Common Industries - Public administration (%)
Occupation diversity
Most Common Occupations - Management, business, science, and arts occupations (%)
Most Common Occupations - Management, business, and financial occupations (%)
Most Common Occupations - Management occupations (%)
Most Common Occupations - Business and financial operations occupations (%)
Most Common Occupations - Computer, engineering, and science occupations (%)
Most Common Occupations - Computer and mathematical occupations (%)
Most Common Occupations - Architecture and engineering occupations (%)
Most Common Occupations - Life, physical, and social science occupations (%)
Most Common Occupations - Education, legal, community service, arts, and media occupations (%)
Most Common Occupations - Community and social service occupations (%)
Most Common Occupations - Legal occupations (%)
Most Common Occupations - Education, training, and library occupations (%)
Most Common Occupations - Arts, design, entertainment, sports, and media occupations (%)
Most Common Occupations - Healthcare practitioners and technical occupations (%)
Most Common Occupations - Health diagnosing and treating practitioners and other technical occupations (%)
Most Common Occupations - Health technologists and technicians (%)
Most Common Occupations - Service occupations (%)
Most Common Occupations - Healthcare support occupations (%)
Most Common Occupations - Protective service occupations (%)
Most Common Occupations - Fire fighting and prevention, and other protective service workers including supervisors (%)
Most Common Occupations - Law enforcement workers including supervisors (%)
Most Common Occupations - Food preparation and serving related occupations (%)
Most Common Occupations - Building and grounds cleaning and maintenance occupations (%)
Most Common Occupations - Personal care and service occupations (%)
Most Common Occupations - Sales and office occupations (%)
Most Common Occupations - Sales and related occupations (%)
Most Common Occupations - Office and administrative support occupations (%)
Most Common Occupations - Natural resources, construction, and maintenance occupations (%)
Most Common Occupations - Farming, fishing, and forestry occupations (%)
Most Common Occupations - Construction and extraction occupations (%)
Most Common Occupations - Installation, maintenance, and repair occupations (%)
Most Common Occupations - Production, transportation, and material moving occupations (%)
Most Common Occupations - Production occupations (%)
Most Common Occupations - Transportation occupations (%)
Most Common Occupations - Material moving occupations (%)
People in Group quarters - Institutionalized population (%)
People in Group quarters - Correctional institutions (%)
People in Group quarters - Federal prisons and detention centers (%)
People in Group quarters - Halfway houses (%)
People in Group quarters - Local jails and other confinement facilities (including police lockups) (%)
People in Group quarters - Military disciplinary barracks (%)
People in Group quarters - State prisons (%)
People in Group quarters - Other types of correctional institutions (%)
People in Group quarters - Nursing homes (%)
People in Group quarters - Hospitals/wards, hospices, and schools for the handicapped (%)
People in Group quarters - Hospitals/wards and hospices for chronically ill (%)
People in Group quarters - Hospices or homes for chronically ill (%)
People in Group quarters - Military hospitals or wards for chronically ill (%)
People in Group quarters - Other hospitals or wards for chronically ill (%)
People in Group quarters - Hospitals or wards for drug/alcohol abuse (%)
People in Group quarters - Mental (Psychiatric) hospitals or wards (%)
People in Group quarters - Schools, hospitals, or wards for the mentally retarded (%)
People in Group quarters - Schools, hospitals, or wards for the physically handicapped (%)
People in Group quarters - Institutions for the deaf (%)
People in Group quarters - Institutions for the blind (%)
People in Group quarters - Orthopedic wards and institutions for the physically handicapped (%)
People in Group quarters - Wards in general hospitals for patients who have no usual home elsewhere (%)
People in Group quarters - Wards in military hospitals for patients who have no usual home elsewhere (%)
People in Group quarters - Juvenile institutions (%)
People in Group quarters - Long-term care (%)
People in Group quarters - Homes for abused, dependent, and neglected children (%)
People in Group quarters - Residential treatment centers for emotionally disturbed children (%)
People in Group quarters - Training schools for juvenile delinquents (%)
People in Group quarters - Short-term care, detention or diagnostic centers for delinquent children (%)
People in Group quarters - Type of juvenile institution unknown (%)
People in Group quarters - Noninstitutionalized population (%)
People in Group quarters - College dormitories (includes college quarters off campus) (%)
People in Group quarters - Military quarters (%)
People in Group quarters - On base (%)
People in Group quarters - Barracks, unaccompanied personnel housing (UPH), (Enlisted/Officer), ;and similar group living quarters for military personnel (%)
People in Group quarters - Transient quarters for temporary residents (%)
People in Group quarters - Military ships (%)
People in Group quarters - Group homes (%)
People in Group quarters - Homes or halfway houses for drug/alcohol abuse (%)
People in Group quarters - Homes for the mentally ill (%)
People in Group quarters - Homes for the mentally retarded (%)
People in Group quarters - Homes for the physically handicapped (%)
People in Group quarters - Other group homes (%)
People in Group quarters - Religious group quarters (%)
People in Group quarters - Dormitories (%)
People in Group quarters - Agriculture workers' dormitories on farms (%)
People in Group quarters - Job Corps and vocational training facilities (%)
People in Group quarters - Other workers' dormitories (%)
People in Group quarters - Crews of maritime vessels (%)
People in Group quarters - Other nonhousehold living situations (%)
People in Group quarters - Other noninstitutional group quarters (%)
Residents speaking English at home (%)
Residents speaking English at home - Born in the United States (%)
Residents speaking English at home - Native, born elsewhere (%)
Residents speaking English at home - Foreign born (%)
Residents speaking Spanish at home (%)
Residents speaking Spanish at home - Born in the United States (%)
Residents speaking Spanish at home - Native, born elsewhere (%)
Residents speaking Spanish at home - Foreign born (%)
Residents speaking other language at home (%)
Residents speaking other language at home - Born in the United States (%)
Residents speaking other language at home - Native, born elsewhere (%)
Residents speaking other language at home - Foreign born (%)
Class of Workers - Employee of private company (%)
Class of Workers - Self-employed in own incorporated business (%)
Class of Workers - Private not-for-profit wage and salary workers (%)
Class of Workers - Local government workers (%)
Class of Workers - State government workers (%)
Class of Workers - Federal government workers (%)
Class of Workers - Self-employed workers in own not incorporated business and Unpaid family workers (%)
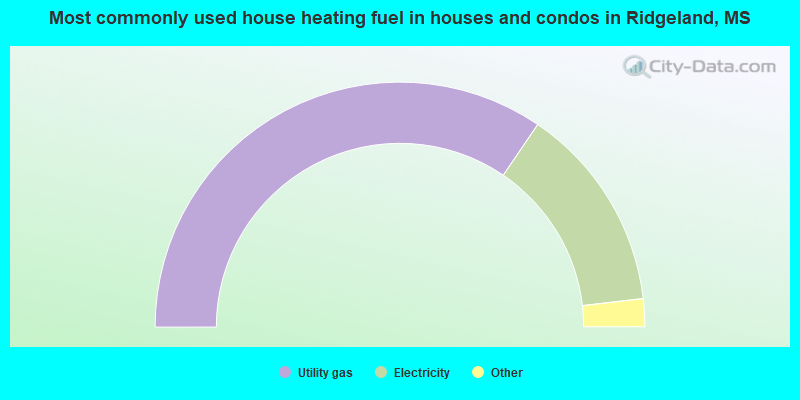
House heating fuel used in houses and condos - Utility gas (%)
House heating fuel used in houses and condos - Bottled, tank, or LP gas (%)
House heating fuel used in houses and condos - Electricity (%)
House heating fuel used in houses and condos - Fuel oil, kerosene, etc. (%)
House heating fuel used in houses and condos - Coal or coke (%)
House heating fuel used in houses and condos - Wood (%)
House heating fuel used in houses and condos - Solar energy (%)
House heating fuel used in houses and condos - Other fuel (%)
House heating fuel used in houses and condos - No fuel used (%)
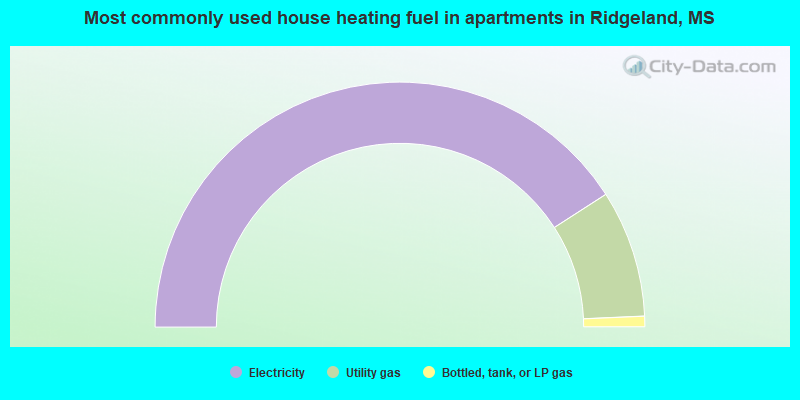
House heating fuel used in apartments - Utility gas (%)
House heating fuel used in apartments - Bottled, tank, or LP gas (%)
House heating fuel used in apartments - Electricity (%)
House heating fuel used in apartments - Fuel oil, kerosene, etc. (%)
House heating fuel used in apartments - Coal or coke (%)
House heating fuel used in apartments - Wood (%)
House heating fuel used in apartments - Solar energy (%)
House heating fuel used in apartments - Other fuel (%)
House heating fuel used in apartments - No fuel used (%)
Armed forces status - In Armed Forces (%)
Armed forces status - Civilian (%)
Armed forces status - Civilian - Veteran (%)
Armed forces status - Civilian - Nonveteran (%)
Fatal accidents locations in years 2005-2021
Fatal accidents locations in 2005
Fatal accidents locations in 2006
Fatal accidents locations in 2007
Fatal accidents locations in 2008
Fatal accidents locations in 2009
Fatal accidents locations in 2010
Fatal accidents locations in 2011
Fatal accidents locations in 2012
Fatal accidents locations in 2013
Fatal accidents locations in 2014
Fatal accidents locations in 2015
Fatal accidents locations in 2016
Fatal accidents locations in 2017
Fatal accidents locations in 2018
Fatal accidents locations in 2019
Fatal accidents locations in 2020
Fatal accidents locations in 2021
Alcohol use - People drinking some alcohol every month (%)
Alcohol use - People not drinking at all (%)
Alcohol use - Average days/month drinking alcohol
Alcohol use - Average drinks/week
Alcohol use - Average days/year people drink much
Audiometry - Average condition of hearing (%)
Audiometry - People that can hear a whisper from across a quiet room (%)
Audiometry - People that can hear normal voice from across a quiet room (%)
Audiometry - Ears ringing, roaring, buzzing (%)
Audiometry - Had a job exposure to loud noise (%)
Audiometry - Had off-work exposure to loud noise (%)
Blood Pressure & Cholesterol - Has high blood pressure (%)
Blood Pressure & Cholesterol - Checking blood pressure at home (%)
Blood Pressure & Cholesterol - Frequently checking blood cholesterol (%)
Blood Pressure & Cholesterol - Has high cholesterol level (%)
Consumer Behavior - Money monthly spent on food at supermarket/grocery store
Consumer Behavior - Money monthly spent on food at other stores
Consumer Behavior - Money monthly spent on eating out
Consumer Behavior - Money monthly spent on carryout/delivered foods
Consumer Behavior - Income spent on food at supermarket/grocery store (%)
Consumer Behavior - Income spent on food at other stores (%)
Consumer Behavior - Income spent on eating out (%)
Consumer Behavior - Income spent on carryout/delivered foods (%)
Current Health Status - General health condition (%)
Current Health Status - Blood donors (%)
Current Health Status - Has blood ever tested for HIV virus (%)
Current Health Status - Left-handed people (%)
Dermatology - People using sunscreen (%)
Diabetes - Diabetics (%)
Diabetes - Had a blood test for high blood sugar (%)
Diabetes - People taking insulin (%)
Diet Behavior & Nutrition - Diet health (%)
Diet Behavior & Nutrition - Milk product consumption (# of products/month)
Diet Behavior & Nutrition - Meals not home prepared (#/week)
Diet Behavior & Nutrition - Meals from fast food or pizza place (#/week)
Diet Behavior & Nutrition - Ready-to-eat foods (#/month)
Diet Behavior & Nutrition - Frozen meals/pizza (#/month)
Drug Use - People that ever used marijuana or hashish (%)
Drug Use - Ever used hard drugs (%)
Drug Use - Ever used any form of cocaine (%)
Drug Use - Ever used heroin (%)
Drug Use - Ever used methamphetamine (%)
Health Insurance - People covered by health insurance (%)
Kidney Conditions-Urology - Avg. # of times urinating at night
Medical Conditions - People with asthma (%)
Medical Conditions - People with anemia (%)
Medical Conditions - People with psoriasis (%)
Medical Conditions - People with overweight (%)
Medical Conditions - Elderly people having difficulties in thinking or remembering (%)
Medical Conditions - People who ever received blood transfusion (%)
Medical Conditions - People having trouble seeing even with glass/contacts (%)
Medical Conditions - People with arthritis (%)
Medical Conditions - People with gout (%)
Medical Conditions - People with congestive heart failure (%)
Medical Conditions - People with coronary heart disease (%)
Medical Conditions - People with angina pectoris (%)
Medical Conditions - People who ever had heart attack (%)
Medical Conditions - People who ever had stroke (%)
Medical Conditions - People with emphysema (%)
Medical Conditions - People with thyroid problem (%)
Medical Conditions - People with chronic bronchitis (%)
Medical Conditions - People with any liver condition (%)
Medical Conditions - People who ever had cancer or malignancy (%)
Mental Health - People who have little interest in doing things (%)
Mental Health - People feeling down, depressed, or hopeless (%)
Mental Health - People who have trouble sleeping or sleeping too much (%)
Mental Health - People feeling tired or having little energy (%)
Mental Health - People with poor appetite or overeating (%)
Mental Health - People feeling bad about themself (%)
Mental Health - People who have trouble concentrating on things (%)
Mental Health - People moving or speaking slowly or too fast (%)
Mental Health - People having thoughts they would be better off dead (%)
Oral Health - Average years since last visit a dentist
Oral Health - People embarrassed because of mouth (%)
Oral Health - People with gum disease (%)
Oral Health - General health of teeth and gums (%)
Oral Health - Average days a week using dental floss/device
Oral Health - Average days a week using mouthwash for dental problem
Oral Health - Average number of teeth
Pesticide Use - Households using pesticides to control insects (%)
Pesticide Use - Households using pesticides to kill weeds (%)
Physical Activity - People doing vigorous-intensity work activities (%)
Physical Activity - People doing moderate-intensity work activities (%)
Physical Activity - People walking or bicycling (%)
Physical Activity - People doing vigorous-intensity recreational activities (%)
Physical Activity - People doing moderate-intensity recreational activities (%)
Physical Activity - Average hours a day doing sedentary activities
Physical Activity - Average hours a day watching TV or videos
Physical Activity - Average hours a day using computer
Physical Functioning - People having limitations keeping them from working (%)
Physical Functioning - People limited in amount of work they can do (%)
Physical Functioning - People that need special equipment to walk (%)
Physical Functioning - People experiencing confusion/memory problems (%)
Physical Functioning - People requiring special healthcare equipment (%)
Prescription Medications - Average number of prescription medicines taking
Preventive Aspirin Use - Adults 40+ taking low-dose aspirin (%)
Reproductive Health - Vaginal deliveries (%)
Reproductive Health - Cesarean deliveries (%)
Reproductive Health - Deliveries resulted in a live birth (%)
Reproductive Health - Pregnancies resulted in a delivery (%)
Reproductive Health - Women breastfeeding newborns (%)
Reproductive Health - Women that had a hysterectomy (%)
Reproductive Health - Women that had both ovaries removed (%)
Reproductive Health - Women that have ever taken birth control pills (%)
Reproductive Health - Women taking birth control pills (%)
Reproductive Health - Women that have ever used Depo-Provera or injectables (%)
Reproductive Health - Women that have ever used female hormones (%)
Sexual Behavior - People 18+ that ever had sex (vaginal, anal, or oral) (%)
Sexual Behavior - Males 18+ that ever had vaginal sex with a woman (%)
Sexual Behavior - Males 18+ that ever performed oral sex on a woman (%)
Sexual Behavior - Males 18+ that ever had anal sex with a woman (%)
Sexual Behavior - Males 18+ that ever had any sex with a man (%)
Sexual Behavior - Females 18+ that ever had vaginal sex with a man (%)
Sexual Behavior - Females 18+ that ever performed oral sex on a man (%)
Sexual Behavior - Females 18+ that ever had anal sex with a man (%)
Sexual Behavior - Females 18+ that ever had any kind of sex with a woman (%)
Sexual Behavior - Average age people first had sex
Sexual Behavior - Average number of female sex partners in lifetime (males 18+)
Sexual Behavior - Average number of female vaginal sex partners in lifetime (males 18+)
Sexual Behavior - Average age people first performed oral sex on a woman (18+)
Sexual Behavior - Average number of woman performed oral sex on in lifetime (18+)
Sexual Behavior - Average number of male sex partners in lifetime (males 18+)
Sexual Behavior - Average number of male anal sex partners in lifetime (males 18+)
Sexual Behavior - Average age people first performed oral sex on a man (18+)
Sexual Behavior - Average number of male oral sex partners in lifetime (18+)
Sexual Behavior - People using protection when performing oral sex (%)
Sexual Behavior - Average number of times people have vaginal or anal sex a year
Sexual Behavior - People having sex without condom (%)
Sexual Behavior - Average number of male sex partners in lifetime (females 18+)
Sexual Behavior - Average number of male vaginal sex partners in lifetime (females 18+)
Sexual Behavior - Average number of female sex partners in lifetime (females 18+)
Sexual Behavior - Circumcised males 18+ (%)
Sleep Disorders - Average hours sleeping at night
Sleep Disorders - People that has trouble sleeping (%)
Smoking-Cigarette Use - People smoking cigarettes (%)
Taste & Smell - People 40+ having problems with smell (%)
Taste & Smell - People 40+ having problems with taste (%)
Taste & Smell - People 40+ that ever had wisdom teeth removed (%)
Taste & Smell - People 40+ that ever had tonsils teeth removed (%)
Taste & Smell - People 40+ that ever had a loss of consciousness because of a head injury (%)
Taste & Smell - People 40+ that ever had a broken nose or other serious injury to face or skull (%)
Taste & Smell - People 40+ that ever had two or more sinus infections (%)
Weight - Average height (inches)
Weight - Average weight (pounds)
Weight - Average BMI
Weight - People that are obese (%)
Weight - People that ever were obese (%)
Weight - People trying to lose weight (%)
According to our research of Mississippi and other state lists, there were 18 registered sex offenders living in Ridgeland, Mississippi as of April 24, 2024 . The ratio of all residents to sex offenders in Ridgeland is 1,352 to 1.The ratio of registered sex offenders to all residents in this city is much lower than the state average.
Officers per 1,000 residents here:
2.47Mississippi average:
2.18
Latest news from Ridgeland, MS collected exclusively by city-data.com from local newspapers, TV, and radio stations
Ancestries: English (9.7%), European (6.3%), American (4.8%), Irish (4.1%), Scotch-Irish (1.8%), Italian (1.6%).
Current Local Time:
Incorporated on 12/29/1899
Land area: 15.9 square miles.
Population density: 1,533 people per square mile (low).
1,831 residents are foreign born (3.1% Asia , 3.1% Latin America ).
This city:
7.3%Mississippi:
2.3%
Median real estate property taxes paid for housing units with mortgages in 2022: $2,053 (0.8%)Median real estate property taxes paid for housing units with no mortgage in 2022: $2,064 (0.8%)
Nearest city with pop. 50,000+: Jackson, MS
Nearest city with pop. 200,000+: Baton Rouge, LA
Nearest city with pop. 1,000,000+: Houston, TX
Nearest cities:
Latitude: 32.42 N, Longitude: 90.12 W
Daytime population change due to commuting: +7,590 (+30.3%)Workers who live and work in this city: 4,824 (34.3%)
Area code commonly used in this area: 601
Single-family new house construction building permits:
2022: 41 buildings , average cost: $715,5002021: 38 buildings , average cost: $526,7002020: 24 buildings , average cost: $763,6002019: 10 buildings , average cost: $608,9002018: 49 buildings , average cost: $420,1002017: 51 buildings , average cost: $438,2002016: 69 buildings , average cost: $388,8002015: 85 buildings , average cost: $383,6002014: 71 buildings , average cost: $408,7002013: 55 buildings , average cost: $352,4002012: 28 buildings , average cost: $498,4002011: 35 buildings , average cost: $549,2002010: 23 buildings , average cost: $410,7002009: 15 buildings , average cost: $526,8002008: 43 buildings , average cost: $512,7002007: 60 buildings , average cost: $347,1002006: 94 buildings , average cost: $258,5002005: 101 buildings , average cost: $208,9002004: 130 buildings , average cost: $289,4002003: 118 buildings , average cost: $279,3002002: 94 buildings , average cost: $257,7002001: 127 buildings , average cost: $196,1002000: 163 buildings , average cost: $154,0001999: 258 buildings , average cost: $131,1001998: 265 buildings , average cost: $116,9001997: 219 buildings , average cost: $108,800Unemployment in December 2023: Here:
2.0%Mississippi:
2.6%
Population change in the 1990s: +7,221 (+55.8%).
Most common occupations in Ridgeland, MS (%)
Both Males Females
Other management occupations, except farmers and farm managers (6.2%)
Other sales and related occupations, including supervisors (5.6%)
Sales representatives, services, wholesale and manufacturing (5.3%)
Other office and administrative support workers, including supervisors (4.5%)
Preschool, kindergarten, elementary, and middle school teachers (4.0%)
Retail sales workers, except cashiers (3.3%)
Top executives (3.3%)
Other sales and related occupations, including supervisors (6.7%)
Other management occupations, except farmers and farm managers (6.6%)
Sales representatives, services, wholesale and manufacturing (5.7%)
Top executives (4.5%)
Computer specialists (4.1%)
Retail sales workers, except cashiers (3.3%)
Physicians and surgeons (3.2%)
Preschool, kindergarten, elementary, and middle school teachers (7.4%)
Other office and administrative support workers, including supervisors (7.0%)
Other management occupations, except farmers and farm managers (5.8%)
Secretaries and administrative assistants (5.8%)
Registered nurses (5.0%)
Sales representatives, services, wholesale and manufacturing (4.8%)
Other sales and related occupations, including supervisors (4.4%)
Tornado activity:
Ridgeland-area historical tornado activity is slightly above Mississippi state average. It is 166% greater than the overall U.S. average.
On 11/24/2001, a category F4 (max. wind speeds 207-260 mph) tornado 4.5 miles away from the Ridgeland city center killed 2 people and injured 21 people and caused $12 million in damages.
On 3/3/1966, a category F5 (max. wind speeds 261-318 mph) tornado 29.8 miles away from the city center killed 58 people and injured 518 people and caused between $5,000,000 and $50,000,000 in damages.
Earthquake activity:
Ridgeland-area historical earthquake activity is significantly above Mississippi state average. It is 205% greater than the overall U.S. average. On 10/24/1997 at 08:35:17, a magnitude 4.9 (4.8 MB, 4.2 MS, 4.9 LG, Depth: 6.2 mi, Class: Light, Intensity: IV - V) earthquake occurred 190.2 miles away from Ridgeland center On 1/18/1999 at 07:00:53, a magnitude 4.8 (4.8 MB, 4.0 LG, Depth: 0.6 mi) earthquake occurred 180.1 miles away from the city center On 3/25/1976 at 00:41:20, a magnitude 5.0 (4.9 MB, 5.0 LG, Class: Moderate, Intensity: VI - VII) earthquake occurred 222.9 miles away from the city center On 6/24/1975 at 11:11:36, a magnitude 4.5 (4.5 MB) earthquake occurred 160.1 miles away from the city center On 11/7/2004 at 11:20:21, a magnitude 4.3 (4.3 MW, Depth: 3.1 mi) earthquake occurred 128.8 miles away from the city center On 1/21/1982 at 00:33:54, a magnitude 4.7 (4.5 MB, 4.7 LG, 4.5 LG) earthquake occurred 224.8 miles away from the city center Magnitude types: regional Lg-wave magnitude (LG), body-wave magnitude (MB), surface-wave magnitude (MS), moment magnitude (MW) Natural disasters: The number of natural disasters in Madison County (17) is near the US average (15).Major Disasters (Presidential) Declared: 14Emergencies Declared: 2Storms: 10, Tornadoes: 10, Floods: 8, Hurricanes: 4, Drought: 1, Freeze: 1, Tropical Storm: 1, Other: 1 (Note: some incidents may be assigned to more than one category). Hospitals and medical centers in Ridgeland: HOSPICE MINISTRIES, INC (450 TOWNE CENTER BLVD) HIGHLAND HOME (638 HIGHLAND COLONY PARKWAY)
Other hospitals and medical centers near Ridgeland: LIFE SOURCES SERVICES, LLC (Hospital, about 2 miles away; MADISON, MS)
PROVIDENCE HOSPICE LLC (Hospital, about 3 miles away; JACKSON, MS)
STA HOME HOSPICE (Hospital, about 4 miles away; JACKSON, MS)
ALPHA HEALTHCARE, LLC (Hospital, about 4 miles away; JACKSON, MS)
DSI JACKSON NORTH (Dialysis Facility, about 4 miles away; JACKSON, MS)
THE NICHOLS CENTER (Nursing Home, about 5 miles away; MADISON, MS)
MANHATTAN NURSING AND REHABILITATION CENTER LLC (Nursing Home, about 5 miles away; JACKSON, MS)
Amtrak station near Ridgeland: 10 miles: JACKSON (300 W. CAPITOL ST.) Services: ticket office, partially wheelchair accessible, enclosed waiting area, public restrooms, public payphones, vending machines, paid short-term parking, paid long-term parking, call for taxi service, public transit connection.
College/University in Ridgeland: Midwest Technical Institute-Ridgeland Full-time enrollment: 604; Location: 113 Market Ridge Drive; Private, for-profit; Website: deltatechnicalcollege.com/)
Colleges/universities with over 2000 students nearest to Ridgeland:
Belhaven University (about 8 miles; Jackson, MS ; Full-time enrollment: 3,147)
Jackson State University (about 10 miles; Jackson, MS ; FT enrollment: 7,485)
Mississippi College (about 14 miles; Clinton, MS ; FT enrollment: 3,919)
Hinds Community College (about 21 miles; Raymond, MS ; FT enrollment: 9,115)
Holmes Community College (about 41 miles; Goodman, MS ; FT enrollment: 5,352)
Copiah-Lincoln Community College (about 53 miles; Wesson, MS ; FT enrollment: 2,532)
East Central Community College (about 60 miles; Decatur, MS ; FT enrollment: 2,380)
Public high school in Ridgeland:
Private high schools in Ridgeland: ST ANDREW'S EPISCOPAL SCHOOL Students: 1,184, Location: 370 OLD AGENCY RD, Grades: PK-12)
THE VERITAS SCHOOL Students: 93, Location: 1202 HIGHLAND COLONY PKWY, Grades: 6-12)
Public elementary/middle schools in Ridgeland:
Private elementary/middle school in Ridgeland: CHRIST COVENANT SCHOOL Students: 410, Location: 752 S PEAR ORCHARD RD, Grades: PK-8)
See full list of schools located in Ridgeland
Notable locations in Ridgeland: (A) , Main Harbor (B) , Ridgeland Fire Department Station 4 (C) , Ridgeland Public Library (D) , Mississippi Crafts Center (E) , Ridgeland Fire Department Station 3 (F) , Ridgeland Fire Department Station 2 (G) , Ridgeland Fire Department Station 1 (H) . Display/hide their locations on the map
Shopping Centers: (1) , Oak Plaza Shopping Center (2) , North Park Mall Shopping Center (3) , Ridgeland Plaza Shopping Center (4) . Display/hide their locations on the map
Churches in Ridgeland include: (A) , New Covenant Church (B) , Zion Hill Methodist Church (C) , Simon Hill Church (D) , First United Methodist Church (E) , First Baptist Church of Ridgeland (F) , Apostolic Revival Center (G) , Mount Charity Church (H) . Display/hide their locations on the map
Cemeteries: (1) , Jones Cemetery (2) , New Hope Grove Cemetery (3) , Mount Charity Missionary Baptist Church Cemetery (4) . Display/hide their locations on the map
Creek: (A) . Display/hide its location on the map
Park in Ridgeland: (1) . Display/hide its location on the map
Tourist attractions: (1) , Ridgeland Tourism Commission (357 Towne Center Boulevard Suite 301) (2) . Display/hide their approximate locations on the map
Hotels: (1) , Studio Plus - Jackson/Ridgeland (800 Ridgewood Rd) (2) , Econo Lodge North (839 Ridgewood Road) (3) , Homewood Suites Jackson (853 Centre Street) (4) , Comfort Suites Ridgeland (6485 Frontage Road) (5) , Drury Inn & Suites (610 East County Line Road) (6) , Quality Inn North (839 Ridgewood Road) (7) , Ridgeland Days Inn & Suites (150 Centre St) (8) , Cabot Lodge-Jackson North (120 Dyess Road) (9) . Display/hide their approximate locations on the map
Courts: (1) , Madison County Drug Court (299 Highway 51) (2) . Display/hide their approximate locations on the map
Birthplace of: Faith Hill - Singer, Bianca Knight - Sprinter, Jason Bridges - College basketball player (Rice Owls).
Madison County has a predicted average indoor radon screening level less than 2 pCi/L (pico curies per liter) - Low Potential Drinking water stations with addresses in Ridgeland and their reported violations in the past:
CITY OF JACKSON (Population served: 175,788, Surface water):
Past health violations:
MCL, Average - Between APR-2005 and JUN-2005, Contaminant: Total Haloacetic Acids (HAA5)
Past monitoring violations:
Monitoring, Repeat Major (TCR) - In AUG-2011, Contaminant: Coliform (TCR). Follow-up actions: St Public Notif requested (SEP-09-2011), St Formal NOV issued (SEP-09-2011), St Compliance achieved (SEP-30-2011), St Public Notif received (JUN-28-2012)
42 regular monitoring violations
Population served: 24,661, Groundwater):
Past health violations:
MCL, Average - Between JAN-2009 and MAR-2009, Contaminant: TTHM. Follow-up actions: St Compliance achieved (MAY-19-2009), St Public Notif requested (JUL-21-2009), St Formal NOV issued (JUL-21-2009), St Public Notif received (AUG-04-2009)
MCL, Average - Between OCT-2008 and DEC-2008, Contaminant: TTHM. Follow-up actions: St Public Notif requested (APR-21-2009), St Formal NOV issued (APR-21-2009), St Compliance achieved (MAY-19-2009), St Public Notif received (JUN-02-2009)
MCL, Average - Between JUL-2008 and SEP-2008, Contaminant: TTHM. Follow-up actions: St Public Notif requested (APR-21-2009), St Formal NOV issued (APR-21-2009), St Compliance achieved (MAY-19-2009), St Public Notif received (JUN-02-2009)
MCL, Average - Between APR-2008 and JUN-2008, Contaminant: TTHM. Follow-up actions: St Formal NOV issued (DEC-10-2008), St Public Notif requested (DEC-10-2008), St Public Notif received (JAN-08-2009), St Compliance achieved (MAY-19-2009)
MCL, Average - Between JAN-2008 and MAR-2008, Contaminant: TTHM. Follow-up actions: St Formal NOV issued (DEC-10-2008), St Public Notif requested (DEC-10-2008), St Public Notif received (JAN-08-2009), St Compliance achieved (MAY-19-2009)
MCL, Average - Between JAN-2008 and MAR-2008, Contaminant: Total Haloacetic Acids (HAA5). Follow-up actions: St Compliance achieved (JUN-02-2008), St Formal NOV issued (DEC-10-2008), St Public Notif requested (DEC-10-2008), St Public Notif received (JAN-08-2009)
5 other older health violations
Past monitoring violations:
187 regular monitoring violations
Population served: 16,530, Groundwater):
Past health violations:
MCL, Average - Between APR-2012 and JUN-2012, Contaminant: Total Haloacetic Acids (HAA5). Follow-up actions: St Compliance achieved (AUG-14-2012), St Formal NOV issued (AUG-31-2012), St Public Notif requested (AUG-31-2012), St Public Notif received (SEP-19-2012)
MCL, Monthly (TCR) - In JUL-2008, Contaminant: Coliform. Follow-up actions: St Boil Water Order (JUL-10-2008), St Formal NOV issued (JUL-15-2008), St Public Notif received (AUG-14-2008)
MCL, Monthly (TCR) - In AUG-2007, Contaminant: Coliform. Follow-up actions: St Public Notif requested (SEP-11-2007), St Violation/Reminder Notice (SEP-11-2007), St Public Notif received (OCT-16-2007)
MCL, Average - Between APR-2007 and JUN-2007, Contaminant: TTHM. Follow-up actions: St Compliance achieved (SEP-06-2007), St Violation/Reminder Notice (OCT-03-2007), St Public Notif requested (OCT-03-2007)
MCL, Average - Between JUL-2006 and SEP-2006, Contaminant: Total Haloacetic Acids (HAA5). Follow-up actions: St Violation/Reminder Notice (JUL-23-2007), St Public Notif requested (JUL-23-2007), St Compliance achieved (SEP-06-2007)
MCL, Average - Between APR-2006 and JUN-2006, Contaminant: Total Haloacetic Acids (HAA5). Follow-up actions: St Violation/Reminder Notice (JUL-23-2007), St Public Notif requested (JUL-23-2007), St Compliance achieved (SEP-06-2007)
4 other older health violations
Past monitoring violations:
Monitoring and Reporting (DBP) - Between OCT-2007 and DEC-2007, Contaminant: Chlorine. Follow-up actions: St Compliance achieved (MAR-31-2007), St Formal NOV issued (FEB-05-2009)
One minor monitoring violation
211 regular monitoring violations
Average household size: This city:
2.2 peopleMississippi:
2.6 people
Percentage of family households: This city:
55.1%Whole state:
69.0%
Percentage of households with unmarried partners: This city:
5.4%Whole state:
5.7%
Likely homosexual households (counted as self-reported same-sex unmarried-partner households)
Lesbian couples: 0.3% of all households Gay men: 0.2% of all households
People in group quarters in Ridgeland in 2010:
173 people in nursing facilities/skilled-nursing facilities
68 people in group homes intended for adults
24 people in in-patient hospice facilities
14 people in workers' group living quarters and job corps centers
13 people in group homes for juveniles (non-correctional)
People in group quarters in Ridgeland in 2000:
198 people in nursing homes
44 people in homes or halfway houses for drug/alcohol abuse
42 people in hospitals/wards and hospices for chronically ill
42 people in hospices or homes for chronically ill
Banks with most branches in Ridgeland (2011 data):
BankPlus: 7 branches. Info updated 2006/11/03: Bank assets: $2,177.0 mil, Deposits: $1,696.4 mil, headquarters in Belzoni, MS, positive income , Commercial Lending Specialization, 62 total offices , Holding Company: Bancplus Corporation
Trustmark National Bank: The Orchard Branch, Chateau Ridgeland Branch, Lake Harbour Branch, Ridgeland Branch, Colony Park Branch, Northpark Branch. Info updated 2012/03/26: Bank assets: $9,612.1 mil, Deposits: $7,410.1 mil, headquarters in Jackson, MS, positive income , Commercial Lending Specialization, 186 total offices , Holding Company: Trustmark Corporation
Regions Bank: Northpark-Ridgeland Branch, Ridgeland Highway 51 Branch, Lake Harbour Branch, Renaissance At Colony Park Branch, Steed Road Branch. Info updated 2011/02/24: Bank assets: $123,368.2 mil, Deposits: $98,301.3 mil, headquarters in Birmingham, AL, positive income , Commercial Lending Specialization, 1778 total offices , Holding Company: Regions Financial Corporation
BancorpSouth Bank: Ridgeland Branch at 758 Pear Orchard Road, branch established on 1991/03/11; Colony Park Branch at 1049 Highland Colony Parkway, branch established on 2008/11/17. Info updated 2007/07/18: Bank assets: $12,990.3 mil, Deposits: $10,863.8 mil, headquarters in Tupelo, MS, positive income , Commercial Lending Specialization, 271 total offices , Holding Company: Bancorpsouth, Inc.
Metropolitan Bank: Branch at 1069 Highland Colony Parkway, branch established on 2008/06/23; Ridgeland Area Mobile at 1069 Highland Colony Parkway, branch established on 2008/06/23. Info updated 2008/04/01: Bank assets: $587.1 mil, Deposits: $498.5 mil, headquarters in Crystal Springs, MS, positive income , Commercial Lending Specialization, 8 total offices , Holding Company: Metropolitan Bancgroup, Inc.
State Bank & Trust Company: Ridgeland Branch at 414 Highway 51 North, branch established on 1989/06/30; Ridgeland Branch at 618 Crescent Boulevard, Suite 100, branch established on 2006/05/09. Info updated 2007/07/17: Bank assets: $921.1 mil, Deposits: $738.4 mil, headquarters in Greenwood, MS, positive income , Commercial Lending Specialization, 37 total offices , Holding Company: State Bank & Trust Company Employee Stock Ownership Plan
BankFirst Financial Services: Ridgeland Branch at 400 Fontaine Place Suite 101, branch established on 2004/11/02; Ridgeland Branch at 751 Lake Harbor Drive, branch established on 2006/10/18. Info updated 2006/11/03: Bank assets: $718.9 mil, Deposits: $600.2 mil, headquarters in Macon, MS, positive income , Commercial Lending Specialization, 14 total offices , Holding Company: Bankfirst Capital Corporation
Community Trust Bank: Ridgeland Branch at 775 Lake Harbour Drive, Suite A, branch established on 2007/01/09; Highland Colony Banking Center at 605 Crescent Boulevard, Suite 100, branch established on 2010/08/11. Info updated 2011/10/14: Bank assets: $2,472.6 mil, Deposits: $1,908.3 mil, headquarters in Choudrant, LA, positive income , Commercial Lending Specialization, 32 total offices , Holding Company: Community Trust Financial Corporation
First National Banker's Bank: Mississippi Branch at 300 Concourse Boulevard, branch established on 2000/12/27. Info updated 2011/04/12: Bank assets: $851.7 mil, Deposits: $364.9 mil, headquarters in Baton Rouge, LA, positive income , Commercial Lending Specialization, 4 total offices , Holding Company: First National Bankers Bankshares, Inc.
4 other banks with 4 local branches
For population 15 years and over in Ridgeland:
Never married: 39.7%Now married: 40.5%Separated: 3.0%Widowed: 5.4%Divorced: 11.4% For population 25 years and over in Ridgeland:
High school or higher: 94.4%Bachelor's degree or higher: 51.8%Graduate or professional degree: 19.7%Unemployed: 3.1%Mean travel time to work (commute): 19.0 minutes
Education Gini index (Inequality in education) Here:
12.1Mississippi average:
11.8
Religion statistics for Ridgeland, MS (based on Madison County data)
Religion Adherents Congregations Evangelical Protestant 28,607 54 Mainline Protestant 8,631 20 Black Protestant 5,650 31 Catholic 5,242 5 Other 1,445 5 Orthodox 135 1 None 45,493 -
Source: Clifford Grammich, Kirk Hadaway, Richard Houseal, Dale E.Jones, Alexei Krindatch, Richie Stanley and Richard H.Taylor. 2012. 2010 U.S.Religion Census: Religious Congregations & Membership Study. Association of Statisticians of American Religious Bodies. Jones, Dale E., et al. 2002. Congregations and Membership in the United States 2000. Nashville, TN: Glenmary Research Center. Graphs represent county-level data
Food Environment Statistics: Number of grocery stores : 12Here :
1.34 / 10,000 pop.State :
2.08 / 10,000 pop.
Number of supercenters and club stores : 1Here :
0.11 / 10,000 pop.Mississippi :
0.24 / 10,000 pop.
Number of convenience stores (no gas) : 4Here :
0.45 / 10,000 pop.Mississippi :
0.80 / 10,000 pop.
Number of convenience stores (with gas) : 47This county :
5.26 / 10,000 pop.Mississippi :
6.36 / 10,000 pop.
Number of full-service restaurants : 65This county :
7.28 / 10,000 pop.Mississippi :
5.03 / 10,000 pop.
Adult diabetes rate : This county :
10.4%Mississippi :
12.3%
Adult obesity rate : Madison County :
28.4%State :
33.1%
Low-income preschool obesity rate : Here :
10.2%Mississippi :
14.4%
Health and Nutrition:
Average overall health of teeth and gums : Ridgeland:
43.3%State:
45.3%
Average BMI : Here:
28.6Mississippi:
29.2
People feeling badly about themselves : Ridgeland:
21.0%State:
20.5%
People not drinking alcohol at all : Ridgeland:
10.9%Mississippi:
11.6%
Average hours sleeping at night : This city:
6.7Mississippi:
6.7
Overweight people : Ridgeland:
31.0%Mississippi:
34.8%
General health condition : This city:
55.5%Mississippi:
54.9%
Average condition of hearing : This city:
80.9%State:
79.9%
More about Health and Nutrition of Ridgeland, MS Residents
Local government employment and payroll (March 2022)
Function
Full-time employees
Monthly full-time payroll
Average yearly full-time wage
Part-time employees
Monthly part-time payroll
Police Protection - Officers
63 $262,333 $49,968 1 $164 Firefighters
55 $211,588 $46,165 0 $0 Police - Other
19 $66,827 $42,207 5 $547 Streets and Highways
19 $83,727 $52,880 0 $0 Other and Unallocable
13 $92,136 $85,049 0 $0 Parks and Recreation
13 $62,432 $57,630 15 $4,562 Financial Administration
12 $66,435 $66,435 0 $0 Judicial and Legal
10 $38,348 $46,018 0 $0 Other Government Administration
9 $42,833 $57,111 0 $0 Housing and Community Development (Local)
8 $45,353 $68,030 0 $0 Fire - Other
5 $27,415 $65,796 0 $0 Water Supply
5 $19,862 $47,669 0 $0 Sewerage
5 $16,981 $40,754 0 $0
Totals for Government
236 $1,036,271 $52,692 21 $5,273
Ridgeland government finances - Expenditure in 2021 (per resident):
Construction - Regular Highways: $11,038,000 ($452.30)
General - Other: $7,524,000 ($308.31)Parks and Recreation: $1,491,000 ($61.10)Water Utilities: $523,000 ($21.43)Sewerage: $178,000 ($7.29)Current Operations - Police Protection: $6,189,000 ($253.61)
Regular Highways: $5,868,000 ($240.45)Local Fire Protection: $4,301,000 ($176.24)Water Utilities: $3,283,000 ($134.53)Parks and Recreation: $1,861,000 ($76.26)Solid Waste Management: $1,492,000 ($61.14)Financial Administration: $1,343,000 ($55.03)Judicial and Legal Services: $1,148,000 ($47.04)Protective Inspection and Regulation - Other: $1,021,000 ($41.84)Sewerage: $821,000 ($33.64)General Public Buildings: $540,000 ($22.13)Central Staff Services: $456,000 ($18.69)Libraries: $148,000 ($6.06)General - Other: $127,000 ($5.20)Health - Other: $115,000 ($4.71)General - Interest on Debt: $3,626,000 ($148.58)
Intergovernmental to Local - Other - Sewerage: $1,888,000 ($77.36)
Other Capital Outlay - Police Protection: $797,000 ($32.66)
Local Fire Protection: $533,000 ($21.84)Parks and Recreation: $88,000 ($3.61)Financial Administration: $54,000 ($2.21)Regular Highways: $23,000 ($0.94)Water Utilities - Interest on Debt: $332,000 ($13.60)
Ridgeland government finances - Revenue in 2021 (per resident):
Charges - Sewerage: $3,344,000 ($137.03)
Solid Waste Management: $1,575,000 ($64.54)Other: $627,000 ($25.69)Parks and Recreation: $176,000 ($7.21)Local Intergovernmental - Sewerage: $2,126,000 ($87.12)
Miscellaneous - Interest Earnings: $1,232,000 ($50.48)
Fines and Forfeits: $1,044,000 ($42.78)General Revenue - Other: $168,000 ($6.88)Sale of Property: $36,000 ($1.48)Donations From Private Sources: $9,000 ($0.37)Revenue - Water Utilities: $3,618,000 ($148.25)
State Intergovernmental - General Local Government Support: $15,670,000 ($642.11)
Highways: $4,950,000 ($202.84)Other: $1,124,000 ($46.06)Tax - Property: $10,212,000 ($418.46)
Public Utilities Sales: $1,247,000 ($51.10)Other License: $258,000 ($10.57)Occupation and Business License - Other: $81,000 ($3.32)
Ridgeland government finances - Debt in 2021 (per resident):
Long Term Debt - Beginning Outstanding - Unspecified Public Purpose: $80,632,000 ($3304.05)
Outstanding Unspecified Public Purpose: $78,469,000 ($3215.42)Retired Unspecified Public Purpose: $27,628,000 ($1132.11)Issue, Unspecified Public Purpose: $25,465,000 ($1043.48)Beginning Outstanding - Public Debt for Private Purpose: $6,040,000 ($247.50)Outstanding Nonguaranteed - Industrial Revenue: $5,370,000 ($220.05)Retired Nonguaranteed - Public Debt for Private Purpose: $670,000 ($27.45)
Ridgeland government finances - Cash and Securities in 2021 (per resident):
Bond Funds - Cash and Securities: $15,436,000 ($632.52)
Other Funds - Cash and Securities: $27,061,000 ($1108.88)
Sinking Funds - Cash and Securities: $12,351,000 ($506.11)
Businesses in Ridgeland, MS
Name Count Name Count
AT&T 4 KFC 2 Abercrombie Kids 1 Kroger 2 Advance Auto Parts 1 La-Z-Boy 1 Aeropostale 1 Lane Bryant 1 American Eagle Outfitters 1 LensCrafters 1 Ann Taylor 2 Little Caesars Pizza 1 Apple Store 1 Lowe's 1 Applebee's 2 Marriott 1 Arby's 1 Mazda 1 AutoZone 1 McDonald's 2 Banana Republic 1 New Balance 6 Barnes & Noble 1 New York & Co 1 Baskin-Robbins 1 Nike 15 Bath & Body Works 1 Pac Sun 1 Brookstone 1 Papa John's Pizza 1 Buffalo Wild Wings 1 Payless 1 Burger King 1 Penske 1 CVS 1 Pier 1 Imports 1 Cache 1 Pizza Hut 1 Charlotte Russe 1 Plato's Closet 1 Chick-Fil-A 1 Popeyes 1 Chico's 2 Quality 1 Coldwater Creek 1 RadioShack 1 Dairy Queen 1 Red Roof Inn 1 Days Inn 1 Rite Aid 1 Domino's Pizza 1 Rue21 1 Econo Lodge 1 SAS Shoes 1 Ethan Allen 1 SONIC Drive-In 2 Express 1 Sears 1 FedEx 11 Sephora 1 Finish Line 1 Soma Intimates 1 Foot Locker 1 Spencer Gifts 1 GNC 2 Studio Plus Deluxe Studios 1 GameStop 2 Subway 3 Gap 1 T-Mobile 3 Goodwill 6 Taco Bell 1 Gymboree 1 Talbots 1 H&R Block 1 The Athlete's Foot 1 Haworth 1 The Limited 1 Hilton 1 U-Haul 3 Holiday Inn 2 UPS 16 Hollister Co. 1 Vans 2 Honda 1 Verizon Wireless 1 Hot Topic 1 Victoria's Secret 1 Hyundai 1 Waffle House 1 J. Jill 1 Walgreens 1 J.Crew 1 Walmart 1 JCPenney 1 Wendy's 2 Jones New York 2 Wet Seal 1 Journeys 1 YMCA 1 Justice 1
Strongest AM radio stations in Ridgeland:
WJNT (1180 AM; 50 kW; PEARL, MS; Owner: BUCHANAN BROADCASTING CO., INC.)
WSLI (930 AM; 5 kW; JACKSON, MS; Owner: SPORTSRAD, INC.)
WOAD (1300 AM; 5 kW; JACKSON, MS; Owner: URBAN RADIO OF MISSISSIPPI, L.L.C.)
WJDX (620 AM; 5 kW; JACKSON, MS; Owner: CAPSTAR TX LIMITED PARTNERSHIP)
WIIN (780 AM; daytime; 5 kW; RIDGELAND, MS; Owner: NEW SOUTH RADIO, INC)
WWDF (720 AM; daytime; 5 kW; RICHLAND, MS; Owner: WILLIS BROADCASTING CORPORATION)
WZRX (1590 AM; 5 kW; JACKSON, MS; Owner: CAPSTAR TX LIMITED PARTNERSHIP)
WTWZ (1120 AM; daytime; 8 kW; CLINTON, MS; Owner: WOOD BROADCASTING CO.)
WSJC (810 AM; 50 kW; MAGEE, MS; Owner: FAMILY TALK RADIO)
WKXI (1400 AM; 1 kW; JACKSON, MS; Owner: URBAN RADIO OF MISSISSIPPI, L.L.C.)
WJXN (1450 AM; 1 kW; JACKSON, MS; Owner: WILLIS BROADCASTING CORPORATION)
WPBQ (1240 AM; 1 kW; FLOWOOD, MS; Owner: PDB CORPORATION)
WRKN (970 AM; 1 kW; BRANDON, MS; Owner: RADIO STATION WRKN, INC.)
Strongest FM radio stations in Ridgeland:
WYOY (101.7 FM; GLUCKSTADT, MS; Owner: NEW SOUTH RADIO, INC)
WDBT (95.5 FM; JACKSON, MS; Owner: CAPSTAR TX LIMITED PARTNERSHIP)
WTYX (94.7 FM; JACKSON, MS; Owner: BACKYARD BROADCASTING MISSISSIPPI, LLC)
WMSI-FM (102.9 FM; JACKSON, MS; Owner: CAPSTAR TX LIMITED PARTNERSHIP)
WJMI (99.7 FM; JACKSON, MS; Owner: URBAN RADIO OF MISSISSIPPI, L.L.C.)
WSTZ-FM (106.7 FM; VICKSBURG, MS; Owner: CAPSTAR TX LIMITED PARTNERSHIP)
WMPN-FM (91.3 FM; JACKSON, MS; Owner: MISSISSIPPI AUTHORITY FOR EDUCATIONAL TV)
WUSJ (96.3 FM; JACKSON, MS; Owner: NEW SOUTH COMMUNICATIONS, INC.)
WJKK (98.7 FM; VICKSBURG, MS; Owner: NEW SOUTH RADIO, INC.)
WYJS (105.9 FM; PICKENS, MS; Owner: URBAN RADIO OF MISSISSIPPI, LLC)
WKXI-FM (107.5 FM; MAGEE, MS; Owner: URBAN RADIO OF MISSISSIPPI, L.L.C.)
WRXW (93.9 FM; PEARL, MS; Owner: BACKYARD BROADCASTING MISSISSIPPI, LLC)
WMPR (90.1 FM; JACKSON, MS; Owner: J.C. MAXWELL BROADCASTING GROUP, INC)
WHJT (93.5 FM; CLINTON, MS; Owner: MISSISSIPPI COLLEGE)
WQST-FM (92.5 FM; FOREST, MS; Owner: AMERICAN FAMILY ASSOCIATION, INC.)
WJSU-FM (88.5 FM; JACKSON, MS; Owner: JACKSON STATE UNIVERSITY)
WJXN-FM (100.9 FM; UTICA, MS; Owner: FLINN BROADCASTING CORPORATION)
WFMN (97.3 FM; FLORA, MS; Owner: WFMN RADIO, INC.)
WRJH (97.7 FM; BRANDON, MS; Owner: ON TOP COMMUNICATIONS OF MISSISSIPPI, LLC)
TV broadcast stations around Ridgeland:
W46CW (Channel 46; JACKSON/BRANDON, MS; Owner: MISSISSIPPI TELEVISION, LLC)
WJTV (Channel 12; JACKSON, MS; Owner: MEDIA GENERAL COMMUNICATIONS, INC.)
WLBT (Channel 3; JACKSON, MS; Owner: CIVCO, INC.)
WBMS-CA (Channel 10; JACKSON, MS; Owner: GENE A. BLAILOCK)
WDBD (Channel 40; JACKSON, MS; Owner: WDBD LICENSE CORP.)
WMPN-TV (Channel 29; JACKSON, MS; Owner: MISSISSIPPI AUTHORITY FOR EDUCATIONAL TV)
WJKO-LP (Channel 64; JACKSON, MS; Owner: WORD OF GOD FELLOWSHIP, INC.)
WJMF-LP (Channel 53; JACKSON, MS; Owner: EQUITY BROADCASTING CORPORATION)
WJXF-LP (Channel 49; JACKSON, MS; Owner: EQUITY BROADCASTING CORPORATION)
WAPT (Channel 16; JACKSON, MS; Owner: WAPT HEARST-ARGYLE TV, INC. (CA CORP.))
WBXK-CA (Channel 8; JACKSON, ETC., MS; Owner: THE BOX WORLDWIDE LLC)
W23BC (Channel 23; JACKSON, MS; Owner: JACKSON STATE UNIVERSITY)
WNTZ (Channel 48; NATCHEZ, MS; Owner: WHITE KNIGHT BROADCASTING OF NATCHEZ LICENSE CORP.)
National Bridge Inventory (NBI) Statistics 49 Number of bridges614ft / 187m Total length $1,344,295,000 Total costs1,092,380 Total average daily traffic101,852 Total average daily truck traffic
New bridges - historical statistics
9 1960-1969 8 1970-1979 9 1980-1989 9 1990-1999 8 2000-2009 4 2010-2019 2 2020-2022
See full National Bridge Inventory statistics for Ridgeland, MS
Home Mortgage Disclosure Act Aggregated Statistics For Year 2009(Based on 2 full and 5 partial tracts) A) FHA, FSA/RHS & VA B) Conventional C) Refinancings D) Home Improvement Loans E) Loans on Dwellings For 5+ Families F) Non-occupant Loans on G) Loans On Manufactured Number Average Value Number Average Value Number Average Value Number Average Value Number Average Value Number Average Value Number Average Value
LOANS ORIGINATED 67 $140,302 131 $203,187 450 $230,515 21 $54,049 1 $166,920 73 $189,652 5 $31,330 APPLICATIONS APPROVED, NOT ACCEPTED 3 $114,643 7 $189,624 27 $167,105 0 $0 0 $0 1 $241,790 1 $45,920 APPLICATIONS DENIED 20 $157,878 15 $143,783 79 $190,477 13 $36,479 0 $0 7 $118,241 4 $9,452 APPLICATIONS WITHDRAWN 7 $180,000 15 $142,060 64 $232,944 1 $126,170 0 $0 5 $320,156 0 $0 FILES CLOSED FOR INCOMPLETENESS 1 $220,660 2 $152,920 13 $160,613 1 $91,940 0 $0 1 $37,000 0 $0
Aggregated Statistics For Year 2008(Based on 2 full and 5 partial tracts) A) FHA, FSA/RHS & VA B) Conventional C) Refinancings D) Home Improvement Loans E) Loans on Dwellings For 5+ Families F) Non-occupant Loans on G) Loans On Manufactured Number Average Value Number Average Value Number Average Value Number Average Value Number Average Value Number Average Value Number Average Value
LOANS ORIGINATED 66 $158,498 171 $230,758 263 $204,865 24 $47,463 1 $316,000 83 $154,085 4 $36,780 APPLICATIONS APPROVED, NOT ACCEPTED 3 $188,763 18 $188,193 29 $182,756 3 $61,410 0 $0 0 $0 2 $29,655 APPLICATIONS DENIED 7 $136,944 32 $174,684 87 $178,465 21 $59,994 0 $0 13 $115,828 5 $41,346 APPLICATIONS WITHDRAWN 7 $133,899 19 $220,335 38 $186,695 2 $38,715 0 $0 3 $137,513 0 $0 FILES CLOSED FOR INCOMPLETENESS 0 $0 4 $124,162 16 $208,935 1 $54,020 0 $0 2 $159,500 0 $0
Aggregated Statistics For Year 2007(Based on 2 full and 5 partial tracts) A) FHA, FSA/RHS & VA B) Conventional C) Refinancings D) Home Improvement Loans E) Loans on Dwellings For 5+ Families F) Non-occupant Loans on G) Loans On Manufactured Number Average Value Number Average Value Number Average Value Number Average Value Number Average Value Number Average Value Number Average Value
LOANS ORIGINATED 35 $146,497 317 $193,304 220 $198,344 35 $77,278 2 $15,807,015 73 $124,104 6 $44,943 APPLICATIONS APPROVED, NOT ACCEPTED 4 $137,392 33 $128,835 35 $223,264 4 $41,202 0 $0 3 $64,187 6 $50,823 APPLICATIONS DENIED 1 $250,090 60 $151,992 112 $186,794 24 $409,868 0 $0 14 $745,379 11 $45,768 APPLICATIONS WITHDRAWN 2 $143,300 30 $205,790 46 $211,213 3 $107,983 0 $0 8 $86,228 1 $20,710 FILES CLOSED FOR INCOMPLETENESS 0 $0 12 $224,991 26 $210,408 0 $0 0 $0 3 $119,740 0 $0
Aggregated Statistics For Year 2006(Based on 2 full and 5 partial tracts) A) FHA, FSA/RHS & VA B) Conventional C) Refinancings D) Home Improvement Loans E) Loans on Dwellings For 5+ Families F) Non-occupant Loans on G) Loans On Manufactured Number Average Value Number Average Value Number Average Value Number Average Value Number Average Value Number Average Value Number Average Value
LOANS ORIGINATED 74 $135,780 355 $165,848 218 $209,008 31 $35,967 2 $216,855 85 $147,599 6 $33,082 APPLICATIONS APPROVED, NOT ACCEPTED 1 $162,630 56 $187,397 42 $209,761 4 $23,958 0 $0 3 $145,033 2 $69,315 APPLICATIONS DENIED 13 $120,648 131 $144,326 136 $177,340 22 $37,498 0 $0 13 $107,858 15 $30,939 APPLICATIONS WITHDRAWN 12 $148,316 51 $180,922 67 $214,007 2 $335,970 0 $0 8 $123,830 0 $0 FILES CLOSED FOR INCOMPLETENESS 0 $0 22 $198,528 46 $159,527 2 $58,865 0 $0 4 $277,798 0 $0
Aggregated Statistics For Year 2005(Based on 2 full and 5 partial tracts) A) FHA, FSA/RHS & VA B) Conventional C) Refinancings D) Home Improvement Loans E) Loans on Dwellings For 5+ Families F) Non-occupant Loans on G) Loans On Manufactured Number Average Value Number Average Value Number Average Value Number Average Value Number Average Value Number Average Value Number Average Value
LOANS ORIGINATED 75 $130,767 431 $167,971 258 $184,964 29 $45,422 1 $1,838,000 54 $132,788 3 $36,353 APPLICATIONS APPROVED, NOT ACCEPTED 2 $109,315 62 $159,691 48 $148,835 5 $100,916 0 $0 7 $72,394 4 $54,830 APPLICATIONS DENIED 6 $120,997 124 $137,072 121 $154,010 21 $39,887 0 $0 15 $132,655 11 $35,018 APPLICATIONS WITHDRAWN 11 $127,300 121 $135,294 107 $156,215 11 $215,860 0 $0 16 $119,323 0 $0 FILES CLOSED FOR INCOMPLETENESS 1 $106,690 19 $215,878 21 $171,066 2 $31,960 0 $0 3 $119,333 0 $0
Aggregated Statistics For Year 2004(Based on 2 full and 5 partial tracts) A) FHA, FSA/RHS & VA B) Conventional C) Refinancings D) Home Improvement Loans E) Loans on Dwellings For 5+ Families F) Non-occupant Loans on G) Loans On Manufactured Number Average Value Number Average Value Number Average Value Number Average Value Number Average Value Number Average Value Number Average Value
LOANS ORIGINATED 62 $119,386 347 $166,471 360 $161,182 29 $70,180 1 $97,230 81 $108,837 6 $36,855 APPLICATIONS APPROVED, NOT ACCEPTED 3 $109,613 39 $165,394 55 $148,594 4 $27,588 0 $0 8 $82,514 3 $55,933 APPLICATIONS DENIED 19 $101,872 67 $122,054 144 $133,167 25 $44,359 0 $0 15 $69,510 14 $40,968 APPLICATIONS WITHDRAWN 7 $110,934 57 $140,413 116 $140,486 5 $44,778 0 $0 8 $110,318 3 $28,273 FILES CLOSED FOR INCOMPLETENESS 2 $89,580 13 $144,057 21 $150,022 3 $85,567 0 $0 1 $65,010 0 $0
Aggregated Statistics For Year 2003(Based on 2 full and 5 partial tracts) A) FHA, FSA/RHS & VA B) Conventional C) Refinancings D) Home Improvement Loans E) Loans on Dwellings For 5+ Families F) Non-occupant Loans on Number Average Value Number Average Value Number Average Value Number Average Value Number Average Value Number Average Value
LOANS ORIGINATED 91 $106,679 347 $168,454 997 $148,492 24 $73,278 1 $103,530 82 $94,677 APPLICATIONS APPROVED, NOT ACCEPTED 1 $154,980 27 $194,955 92 $163,127 2 $67,880 0 $0 5 $85,480 APPLICATIONS DENIED 9 $99,999 57 $134,975 160 $120,670 16 $30,026 1 $3,421,140 11 $75,256 APPLICATIONS WITHDRAWN 4 $115,310 38 $147,515 111 $144,349 2 $23,520 0 $0 9 $95,119 FILES CLOSED FOR INCOMPLETENESS 2 $110,400 14 $151,721 29 $150,618 2 $48,305 0 $0 2 $100,630
Aggregated Statistics For Year 2002(Based on 2 partial tracts) A) FHA, FSA/RHS & VA B) Conventional C) Refinancings D) Home Improvement Loans F) Non-occupant Loans on Number Average Value Number Average Value Number Average Value Number Average Value Number Average Value
LOANS ORIGINATED 53 $99,032 134 $131,325 261 $128,479 21 $64,926 47 $81,173 APPLICATIONS APPROVED, NOT ACCEPTED 1 $134,040 12 $152,969 33 $110,044 3 $17,920 6 $94,868 APPLICATIONS DENIED 6 $83,847 25 $67,482 62 $96,460 4 $9,160 13 $61,359 APPLICATIONS WITHDRAWN 3 $97,297 12 $112,607 36 $123,423 0 $0 5 $76,060 FILES CLOSED FOR INCOMPLETENESS 1 $125,580 2 $86,430 15 $129,013 0 $0 0 $0
Aggregated Statistics For Year 2001(Based on 2 partial tracts) A) FHA, FSA/RHS & VA B) Conventional C) Refinancings D) Home Improvement Loans E) Loans on Dwellings For 5+ Families F) Non-occupant Loans on Number Average Value Number Average Value Number Average Value Number Average Value Number Average Value Number Average Value
LOANS ORIGINATED 61 $103,228 111 $125,438 210 $123,240 17 $29,360 2 $9,498,165 20 $95,208 APPLICATIONS APPROVED, NOT ACCEPTED 0 $0 13 $102,496 25 $149,261 2 $22,680 0 $0 0 $0 APPLICATIONS DENIED 1 $66,810 25 $58,702 54 $88,753 7 $30,384 0 $0 5 $76,788 APPLICATIONS WITHDRAWN 1 $95,430 6 $146,393 39 $93,287 1 $10,160 0 $0 4 $131,878 FILES CLOSED FOR INCOMPLETENESS 0 $0 2 $101,240 12 $95,155 0 $0 0 $0 0 $0
Aggregated Statistics For Year 2000(Based on 2 partial tracts) A) FHA, FSA/RHS & VA B) Conventional C) Refinancings D) Home Improvement Loans E) Loans on Dwellings For 5+ Families F) Non-occupant Loans on Number Average Value Number Average Value Number Average Value Number Average Value Number Average Value Number Average Value
LOANS ORIGINATED 47 $95,634 116 $118,103 57 $116,175 27 $17,220 1 $8,566,350 14 $48,216 APPLICATIONS APPROVED, NOT ACCEPTED 0 $0 15 $54,386 10 $68,632 5 $22,514 0 $0 1 $23,410 APPLICATIONS DENIED 6 $94,000 52 $41,361 35 $61,097 12 $12,752 1 $8,642,880 3 $33,310 APPLICATIONS WITHDRAWN 3 $83,433 8 $115,570 21 $83,684 2 $45,295 0 $0 1 $61,220 FILES CLOSED FOR INCOMPLETENESS 2 $109,710 3 $95,153 3 $134,660 0 $0 0 $0 0 $0
Aggregated Statistics For Year 1999(Based on 4 partial tracts) A) FHA, FSA/RHS & VA B) Conventional C) Refinancings D) Home Improvement Loans E) Loans on Dwellings For 5+ Families F) Non-occupant Loans on Number Average Value Number Average Value Number Average Value Number Average Value Number Average Value Number Average Value
LOANS ORIGINATED 87 $94,426 361 $126,305 219 $112,717 40 $28,664 0 $0 25 $73,738 APPLICATIONS APPROVED, NOT ACCEPTED 3 $67,110 32 $121,423 37 $77,479 8 $20,932 0 $0 2 $48,710 APPLICATIONS DENIED 3 $98,240 90 $67,316 85 $78,304 30 $18,287 1 $9,122,190 14 $91,489 APPLICATIONS WITHDRAWN 8 $94,949 36 $112,136 49 $90,671 2 $64,445 0 $0 4 $72,532 FILES CLOSED FOR INCOMPLETENESS 3 $85,383 4 $108,498 11 $110,950 1 $8,060 0 $0 1 $57,720
Detailed HMDA statistics for the following Tracts:
0301.01
, 0301.03 , 0301.04 , 0301.05 , 0301.06 , 0302.05 , 0302.06
Private Mortgage Insurance Companies Aggregated Statistics For Year 2009(Based on 2 full and 5 partial tracts) A) Conventional B) Refinancings C) Non-occupant Loans on Number Average Value Number Average Value Number Average Value
LOANS ORIGINATED 16 $200,545 33 $219,560 1 $97,230 APPLICATIONS APPROVED, NOT ACCEPTED 6 $244,033 8 $189,976 1 $217,000 APPLICATIONS DENIED 4 $264,612 8 $228,748 0 $0 APPLICATIONS WITHDRAWN 1 $312,560 0 $0 0 $0 FILES CLOSED FOR INCOMPLETENESS 0 $0 0 $0 0 $0
Aggregated Statistics For Year 2008(Based on 2 full and 5 partial tracts) A) Conventional B) Refinancings C) Non-occupant Loans on Number Average Value Number Average Value Number Average Value
LOANS ORIGINATED 58 $179,436 30 $191,220 8 $112,611 APPLICATIONS APPROVED, NOT ACCEPTED 26 $164,139 15 $226,352 3 $121,477 APPLICATIONS DENIED 5 $202,088 5 $159,742 3 $142,547 APPLICATIONS WITHDRAWN 1 $284,040 1 $311,150 0 $0 FILES CLOSED FOR INCOMPLETENESS 3 $254,053 0 $0 1 $365,000
Aggregated Statistics For Year 2007(Based on 2 full and 5 partial tracts) A) Conventional B) Refinancings C) Non-occupant Loans on Number Average Value Number Average Value Number Average Value
LOANS ORIGINATED 134 $173,042 37 $185,634 10 $114,154 APPLICATIONS APPROVED, NOT ACCEPTED 15 $189,699 13 $188,237 1 $123,070 APPLICATIONS DENIED 4 $110,888 0 $0 2 $142,045 APPLICATIONS WITHDRAWN 3 $206,727 2 $108,800 1 $234,000 FILES CLOSED FOR INCOMPLETENESS 0 $0 0 $0 0 $0
Aggregated Statistics For Year 2006(Based on 2 full and 5 partial tracts) A) Conventional B) Refinancings C) Non-occupant Loans on Number Average Value Number Average Value Number Average Value
LOANS ORIGINATED 92 $174,034 21 $176,989 8 $119,226 APPLICATIONS APPROVED, NOT ACCEPTED 12 $187,637 13 $165,566 1 $130,030 APPLICATIONS DENIED 0 $0 3 $130,247 1 $78,150 APPLICATIONS WITHDRAWN 3 $163,067 1 $75,520 0 $0 FILES CLOSED FOR INCOMPLETENESS 0 $0 0 $0 0 $0
Aggregated Statistics For Year 2005(Based on 2 full and 5 partial tracts) A) Conventional B) Refinancings C) Non-occupant Loans on Number Average Value Number Average Value Number Average Value
LOANS ORIGINATED 95 $154,538 30 $163,309 4 $123,625 APPLICATIONS APPROVED, NOT ACCEPTED 15 $173,103 4 $161,495 1 $109,840 APPLICATIONS DENIED 0 $0 0 $0 0 $0 APPLICATIONS WITHDRAWN 2 $147,810 3 $107,727 1 $171,470 FILES CLOSED FOR INCOMPLETENESS 0 $0 0 $0 0 $0
Aggregated Statistics For Year 2004(Based on 2 full and 5 partial tracts) A) Conventional B) Refinancings C) Non-occupant Loans on Number Average Value Number Average Value Number Average Value
LOANS ORIGINATED 80 $156,458 46 $138,984 11 $96,916 APPLICATIONS APPROVED, NOT ACCEPTED 17 $164,020 13 $162,779 4 $134,618 APPLICATIONS DENIED 2 $254,460 0 $0 1 $255,830 APPLICATIONS WITHDRAWN 6 $170,052 3 $174,930 1 $109,840 FILES CLOSED FOR INCOMPLETENESS 0 $0 0 $0 0 $0
Aggregated Statistics For Year 2003(Based on 2 full and 5 partial tracts) A) Conventional B) Refinancings C) Non-occupant Loans on Number Average Value Number Average Value Number Average Value
LOANS ORIGINATED 97 $150,811 142 $135,375 18 $100,547 APPLICATIONS APPROVED, NOT ACCEPTED 11 $172,923 24 $153,690 1 $62,000 APPLICATIONS DENIED 0 $0 2 $121,005 1 $92,000 APPLICATIONS WITHDRAWN 7 $216,601 5 $146,450 3 $125,017 FILES CLOSED FOR INCOMPLETENESS 0 $0 0 $0 0 $0
Aggregated Statistics For Year 2002(Based on 2 partial tracts) A) Conventional B) Refinancings C) Non-occupant Loans on Number Average Value Number Average Value Number Average Value
LOANS ORIGINATED 53 $127,189 38 $124,090 2 $90,125 APPLICATIONS APPROVED, NOT ACCEPTED 4 $126,250 5 $178,026 0 $0 APPLICATIONS DENIED 1 $107,140 1 $220,570 0 $0 APPLICATIONS WITHDRAWN 3 $115,420 2 $142,245 1 $93,630 FILES CLOSED FOR INCOMPLETENESS 0 $0 0 $0 0 $0
Aggregated Statistics For Year 2001(Based on 2 partial tracts) A) Conventional B) Refinancings C) Non-occupant Loans on Number Average Value Number Average Value Number Average Value
LOANS ORIGINATED 34 $124,705 34 $120,136 3 $115,823 APPLICATIONS APPROVED, NOT ACCEPTED 3 $89,160 2 $145,380 0 $0 APPLICATIONS DENIED 0 $0 0 $0 0 $0 APPLICATIONS WITHDRAWN 0 $0 0 $0 0 $0 FILES CLOSED FOR INCOMPLETENESS 0 $0 0 $0 0 $0
Aggregated Statistics For Year 2000(Based on 2 partial tracts) A) Conventional B) Refinancings C) Non-occupant Loans on Number Average Value Number Average Value Number Average Value
LOANS ORIGINATED 33 $121,702 6 $157,350 1 $78,920 APPLICATIONS APPROVED, NOT ACCEPTED 4 $137,708 2 $150,590 0 $0 APPLICATIONS DENIED 0 $0 0 $0 0 $0 APPLICATIONS WITHDRAWN 0 $0 1 $129,320 0 $0 FILES CLOSED FOR INCOMPLETENESS 0 $0 0 $0 0 $0
Aggregated Statistics For Year 1999(Based on 4 partial tracts) A) Conventional B) Refinancings C) Non-occupant Loans on Number Average Value Number Average Value Number Average Value
LOANS ORIGINATED 126 $140,767 48 $112,644 2 $96,085 APPLICATIONS APPROVED, NOT ACCEPTED 10 $169,568 8 $133,726 0 $0 APPLICATIONS DENIED 3 $181,933 0 $0 0 $0 APPLICATIONS WITHDRAWN 1 $297,060 3 $113,373 0 $0 FILES CLOSED FOR INCOMPLETENESS 0 $0 0 $0 0 $0
Detailed PMIC statistics for the following Tracts:
0301.01
, 0301.03 , 0301.04 , 0301.05 , 0301.06 , 0302.05 , 0302.06 Fire-safe hotels and motels in Ridgeland, Mississippi:
Cabot Lodge - Jackson North, 120 Dyess Rd, Ridgeland, Mississippi 39157 Phone: (601) 957-0757, Fax: (601) 957-0757
Econo Lodge, 839a Ridgewood Rd, Ridgeland, Mississippi 39157 Phone: (601) 956-7740, Fax: (601) 896-0142
Extended Stay America - Jackson - Ridgeland, 800 Ridgewood Rd, Ridgeland, Mississippi 39157 Phone: (601) 956-0884, Fax: (601) 952-2172
Homewood Suites by Hilton Jackson/Ridgeland, 853 Ctr St, Ridgeland, Mississippi 39157 Phone: (601) 899-8611, Fax: (601) 899-8612
Holiday Inn Express, 6485 N I-55 Frontage Rd, Ridgeland, Mississippi 39157 Phone: (601) 977-6111
Days Inn - Ridgeland, 150 Ctr St, Ridgeland, Mississippi 39157 Phone: (601) 956-9726, Fax: (601) 956-9727
Drury Inn & Suites Jackson Ridgeland, 610 E County Line Rd, Ridgeland, Mississippi 39157 Phone: (601) 956-6100
Quality Inn North, 839b Ridgewood Rd, Ridgeland, Mississippi 39157 Phone: (601) 956-6203, Fax: (601) 957-9981
7 other hotels and motels
All 15 fire-safe hotels and motels in Ridgeland, Mississippi
Most common first names in Ridgeland, MS among deceased individuals Name Count Lived (average)
Mary 59 84.4 years James 46 78.5 years William 42 76.2 years John 31 75.4 years Robert 31 77.1 years Charles 23 71.6 years Dorothy 20 81.5 years Elizabeth 19 80.8 years Margaret 19 86.1 years George 19 77.7 years
Most common last names in Ridgeland, MS among deceased individuals Last name Count Lived (average)
Williams 24 79.1 years Smith 22 76.3 years Jones 15 75.0 years Harris 13 83.2 years Scott 10 83.2 years Adcock 9 71.3 years Davis 9 75.4 years Taylor 9 81.6 years Jenkins 9 80.1 years Johnson 9 73.9 years
Ridgeland compared to Mississippi state average:
Median house value above state average. Unemployed percentage significantly below state average. Hispanic race population percentage above state average. Foreign-born population percentage significantly above state average. Renting percentage above state average. House age below state average. Percentage of population with a bachelor's degree or higher significantly above state average.
#34 on the list of "Top 101 cities with the largest percentage of people in hospices or homes for chronically ill (population 1,000+)"
#93 on the list of "Top 101 cities with the smallest racial income disparities between White and Black householders (with at least 2,000 householders)"
#100 on the list of "Top 101 cities with the largest percentage of elementary and middle school students in private schools (1,000+ students)"
#74 (39157) on the list of "Top 101 zip codes with the largest percentage of English first ancestries (pop 5,000+)"
#41 on the list of "Top 101 counties with the largest decrease in the number of deaths per 1000 residents 2000-2006 to 2007-2013 (pop. 50,000+)"
#69 on the list of "Top 101 counties with the largest number of people moving in compared to moving out (pop. 50,000+)"
#91 on the list of "Top 101 counties with the highest percentage of residents relocating from other counties between 2010 and 2011 (pop. 50,000+)"
#96 on the list of "Top 101 counties with the lowest percentage of residents relocating to foreign countries in 2011"
Top Patent Applicants
Richard L. Root (8)
Richard C. Edmonson (7)
Jack H. Wilson, Sr. (5)
Marvin A. Cuchens (4)
Shou Jiang Tang (4)
Douglas E. Parsell (3)
Byungchul Jang (3)
Stephen Michael Maloney (3)
Sammie Joe Glorioso (3)
Joel Bomgaars (2)
Total of 70 patent applications in 2008-2024.

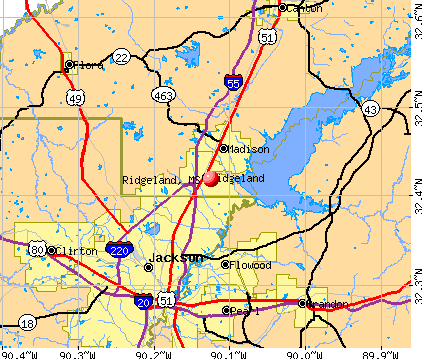


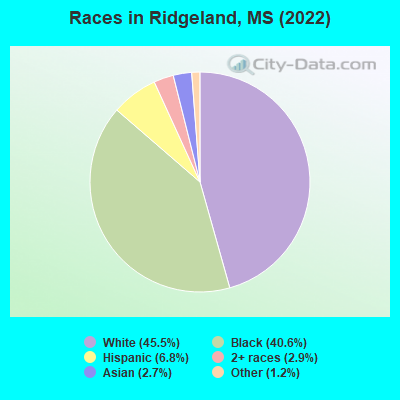
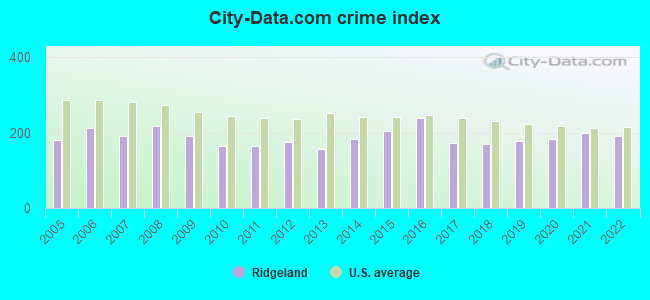
 Recent articles from our blog. Our writers, many of them Ph.D. graduates or candidates, create easy-to-read articles on a wide variety of topics.


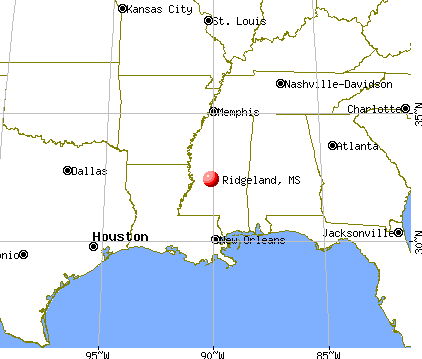
 (8.2 miles
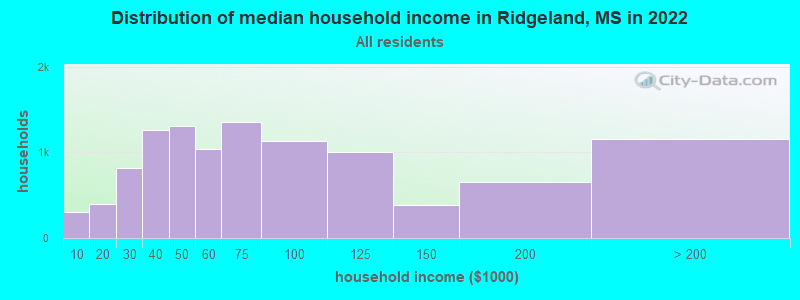
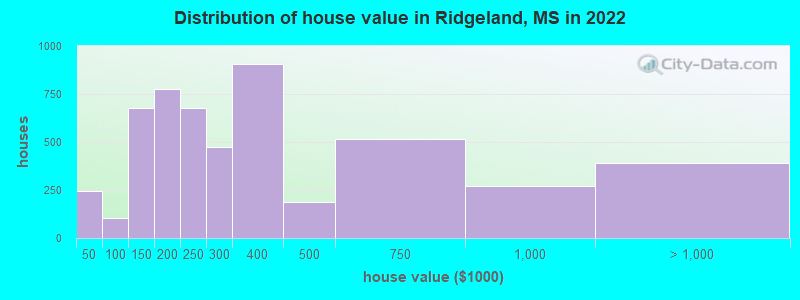
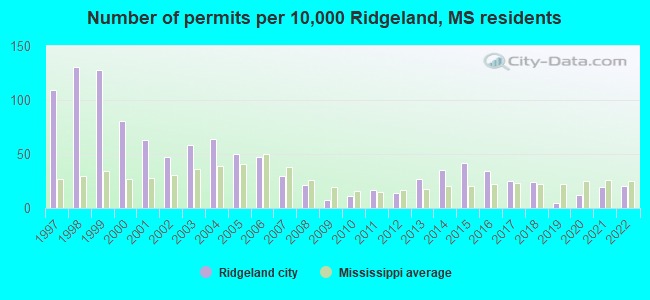
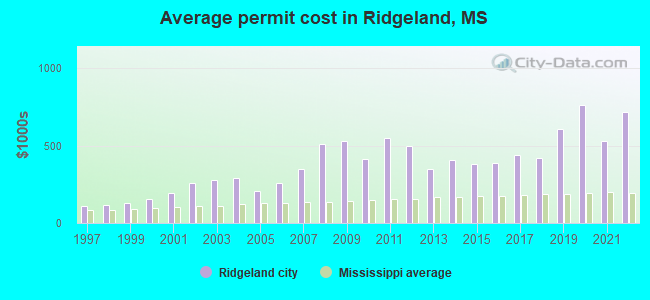
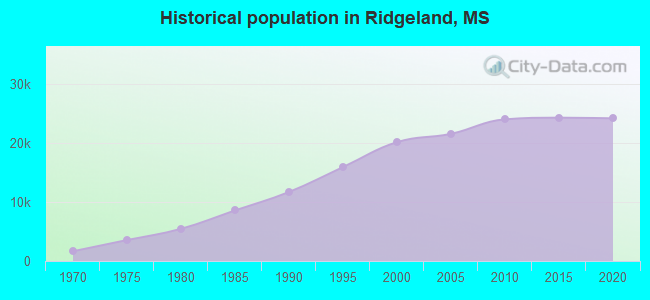
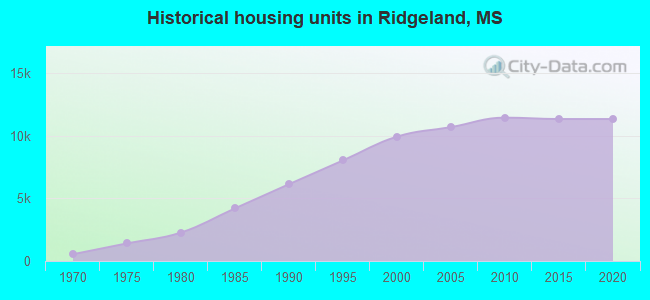
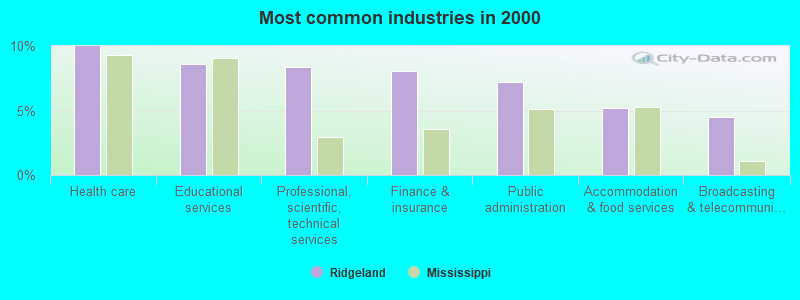
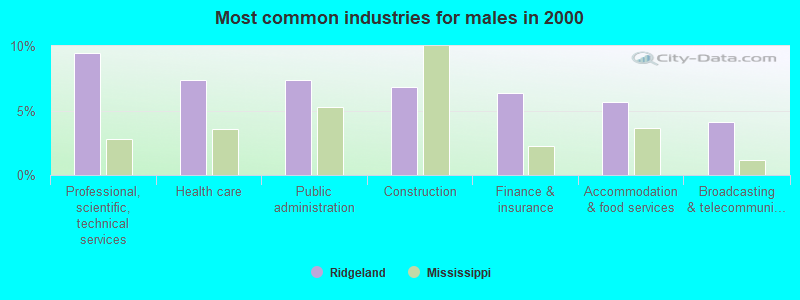
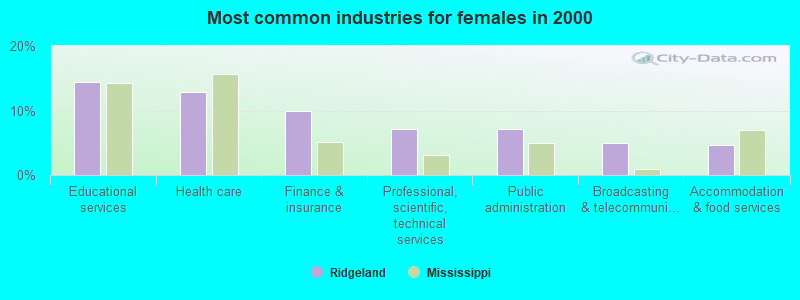
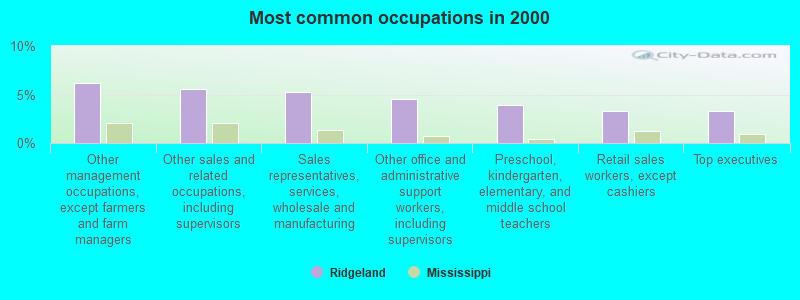
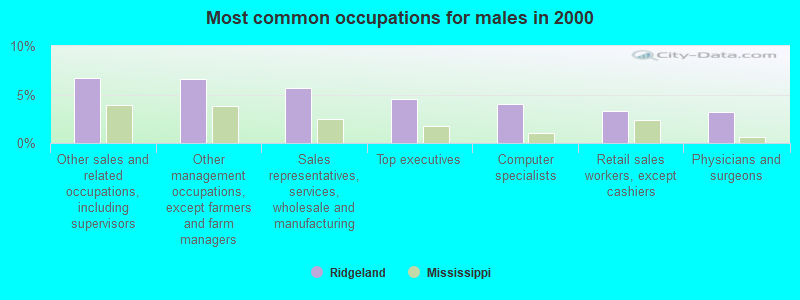
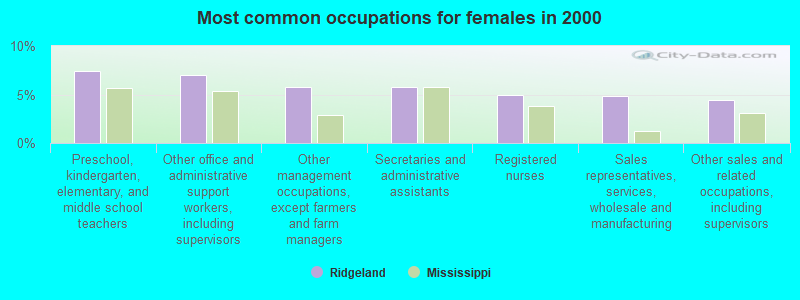
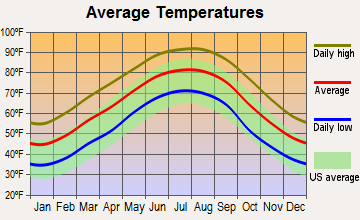
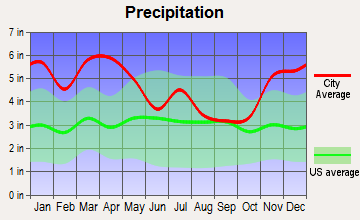
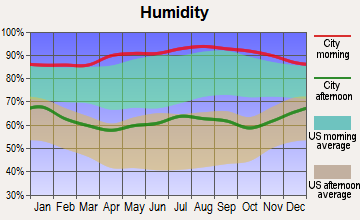
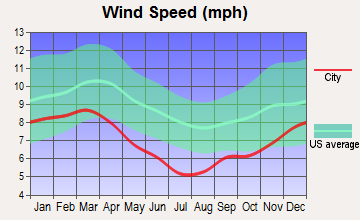
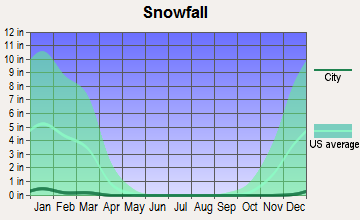
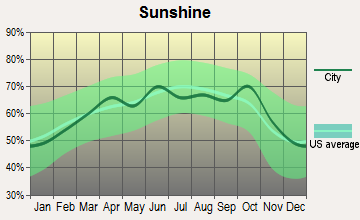
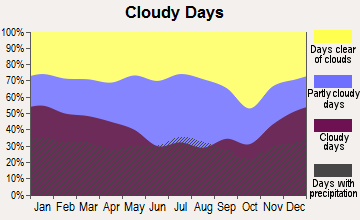
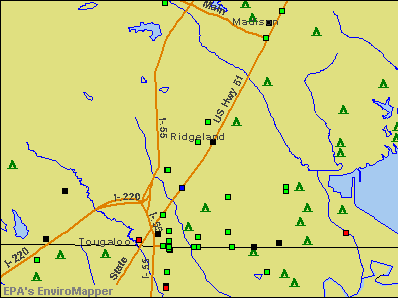

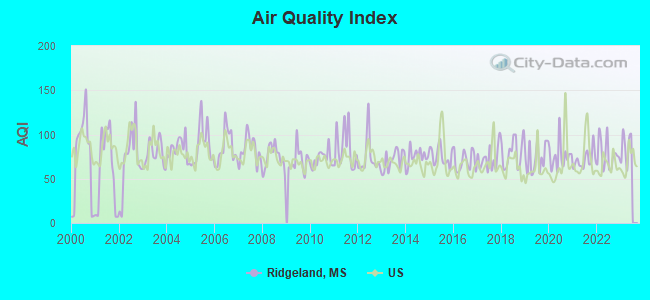
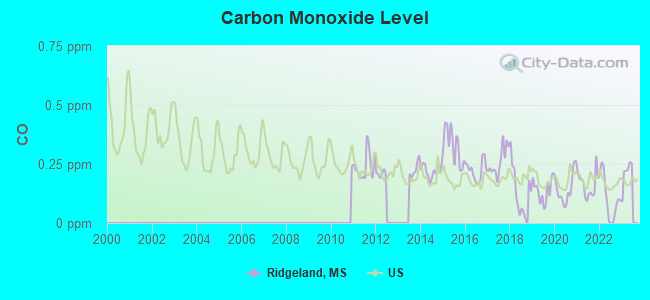
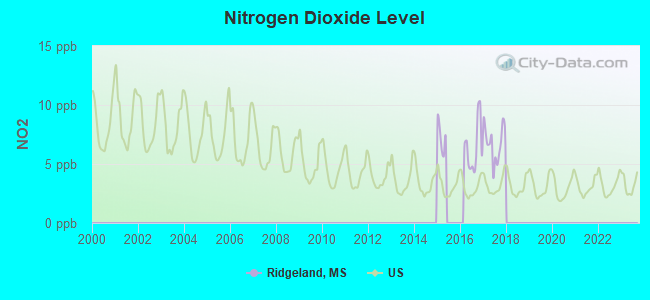
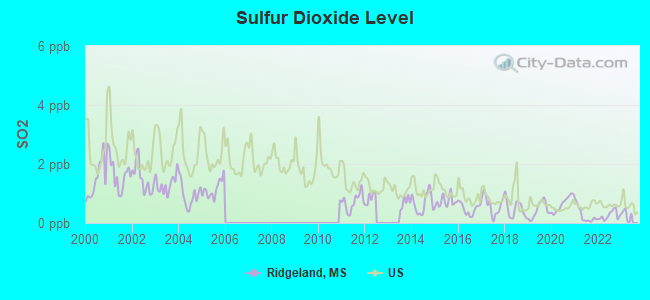
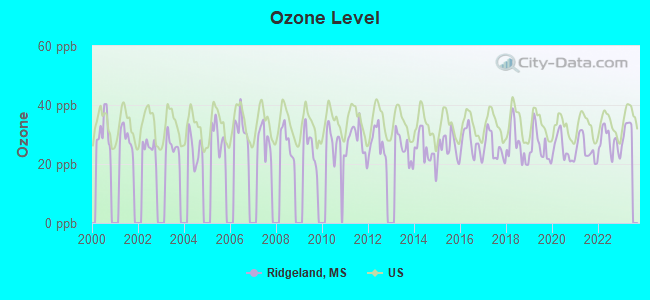
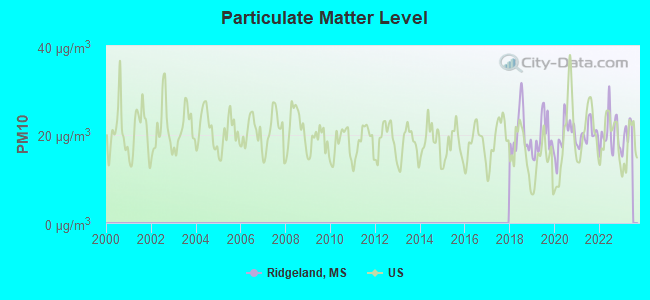
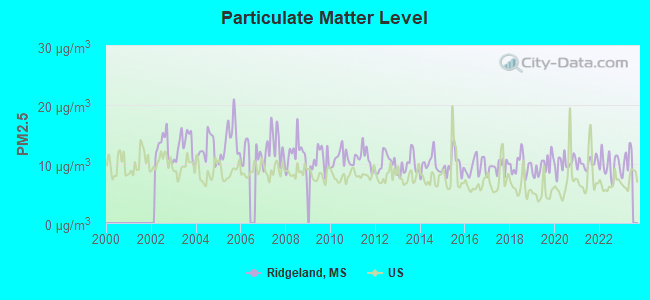

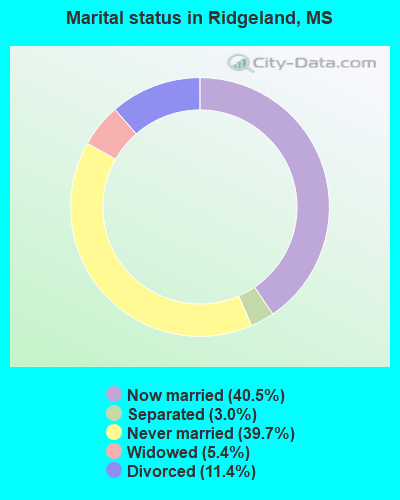
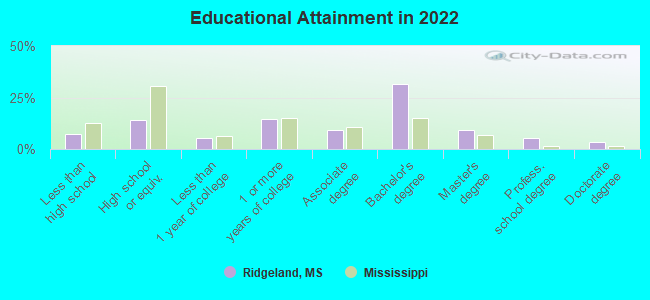
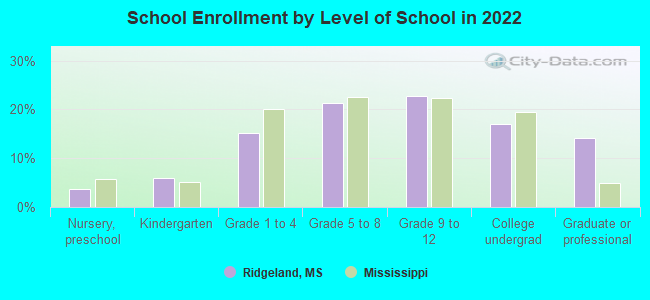
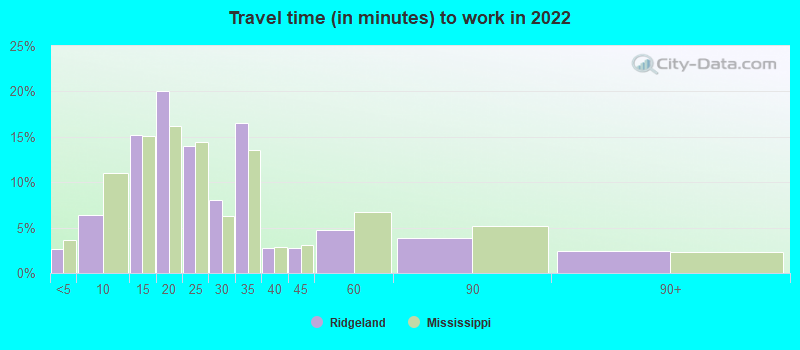
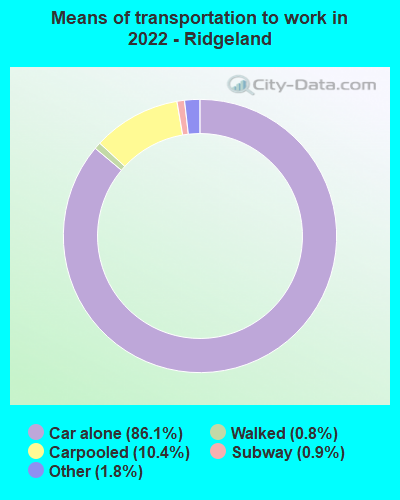
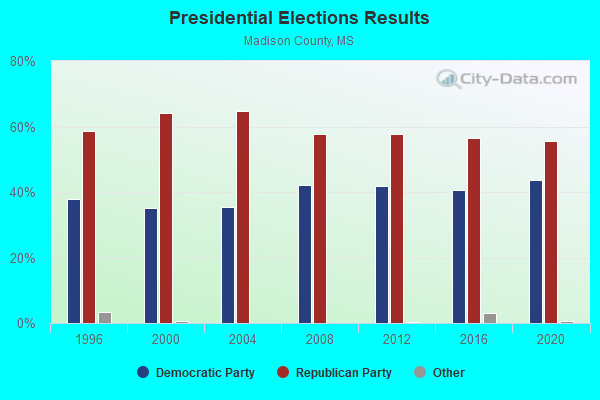
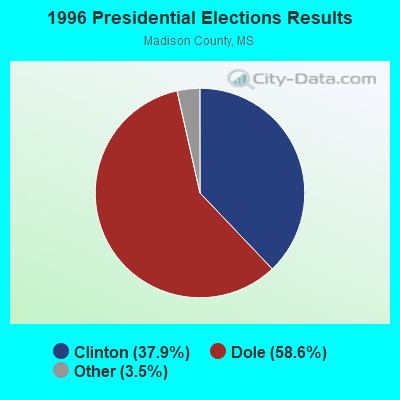
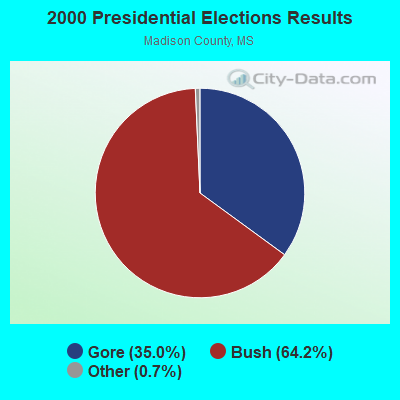
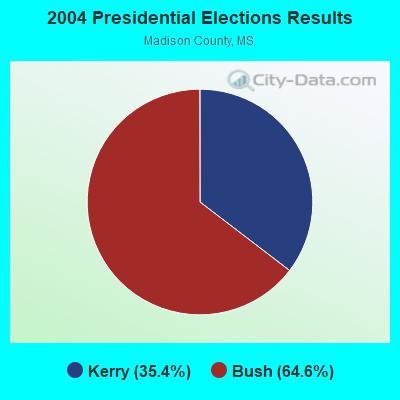
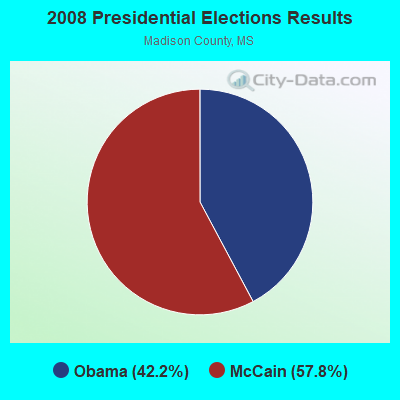
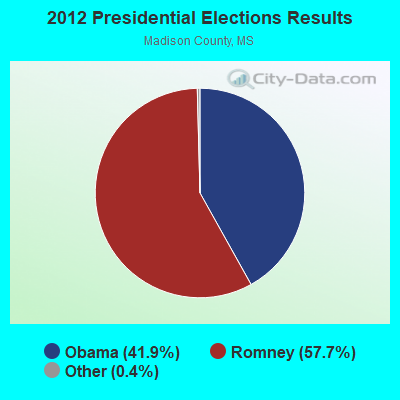
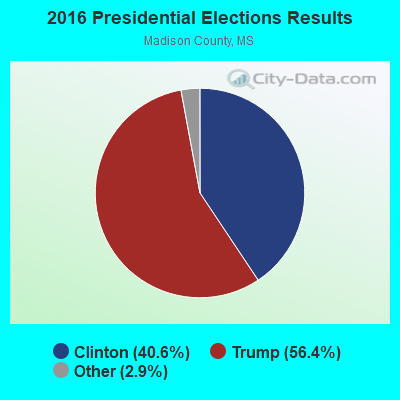
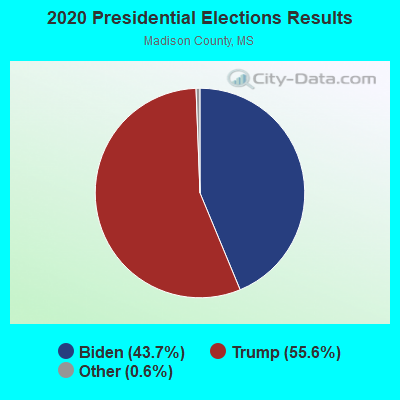
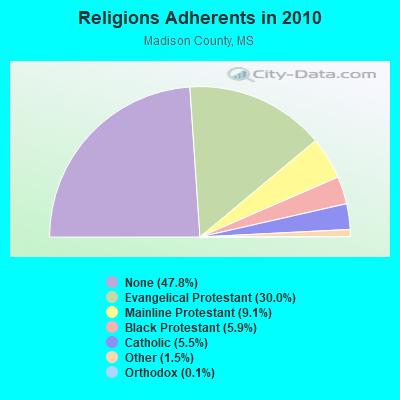
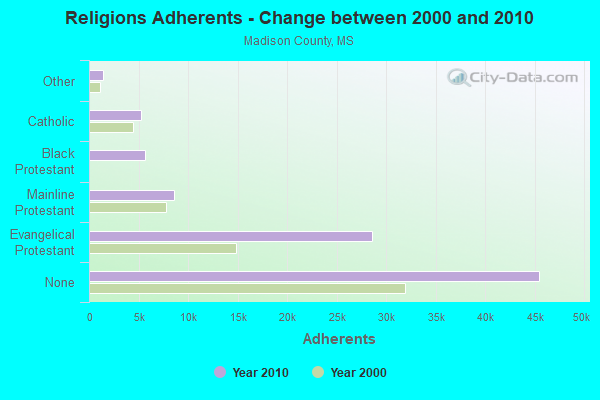
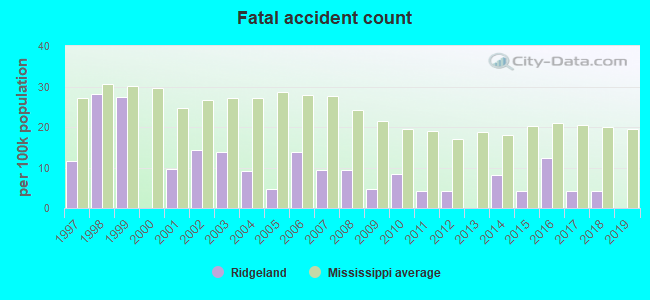
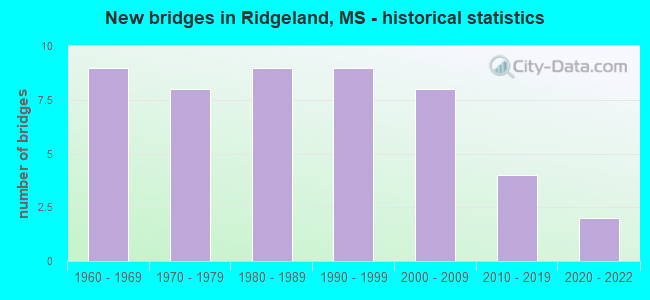
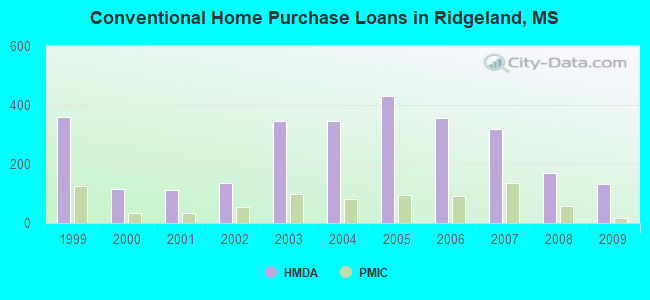
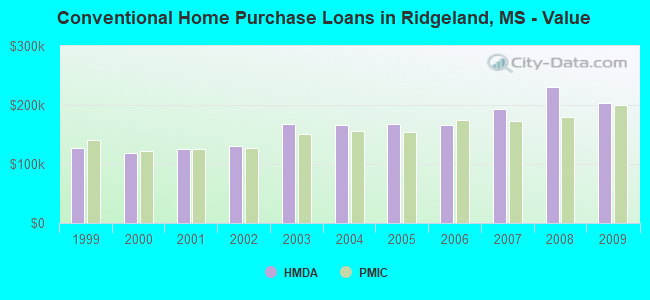
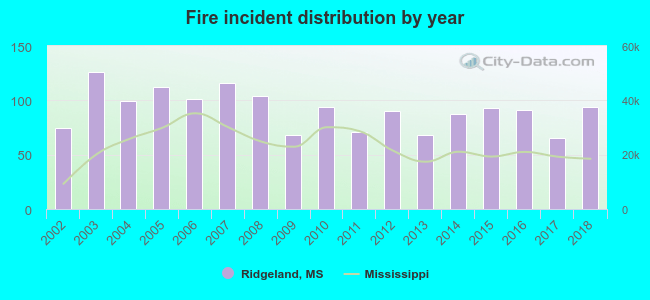 Based on the data from the years 2002 - 2018 the average number of fire incidents per year is 91. The highest number of reported fires - 126 took place in 2003, and the least - 65 in 2017. The data has an increasing trend.
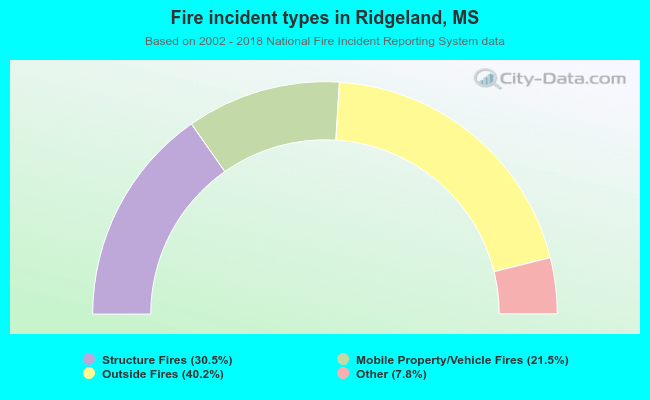 When looking into fire subcategories, the most reports belonged to: Outside Fires (40.2%), and Structure Fires (30.5%).