San Ramon, California Submit your own pictures of this city and show them to the world
OSM Map
General Map
Google Map
MSN Map
OSM Map
General Map
Google Map
MSN Map
OSM Map
General Map
Google Map
MSN Map
OSM Map
General Map
Google Map
MSN Map
Please wait while loading the map...
Population in 2022: 85,953 (100% urban, 0% rural). Population change since 2000: +92.2%Males: 42,058 Females: 43,895
March 2022 cost of living index in San Ramon: 122.5 (high, U.S. average is 100) Percentage of residents living in poverty in 2022: 5.1%for White Non-Hispanic residents , 14.4% for Black residents , 6.4% for Hispanic or Latino residents , 3.4% for American Indian residents , 58.8% for Native Hawaiian and other Pacific Islander residents , 16.4% for other race residents , 4.4% for two or more races residents )
Profiles of local businesses
Business Search - 14 Million verified businesses
Data:
Median household income ($)
Median household income (% change since 2000)
Household income diversity
Ratio of average income to average house value (%)
Ratio of average income to average rent
Median household income ($) - White
Median household income ($) - Black or African American
Median household income ($) - Asian
Median household income ($) - Hispanic or Latino
Median household income ($) - American Indian and Alaska Native
Median household income ($) - Multirace
Median household income ($) - Other Race
Median household income for houses/condos with a mortgage ($)
Median household income for apartments without a mortgage ($)
Races - White alone (%)
Races - White alone (% change since 2000)
Races - Black alone (%)
Races - Black alone (% change since 2000)
Races - American Indian alone (%)
Races - American Indian alone (% change since 2000)
Races - Asian alone (%)
Races - Asian alone (% change since 2000)
Races - Hispanic (%)
Races - Hispanic (% change since 2000)
Races - Native Hawaiian and Other Pacific Islander alone (%)
Races - Native Hawaiian and Other Pacific Islander alone (% change since 2000)
Races - Two or more races (%)
Races - Two or more races (% change since 2000)
Races - Other race alone (%)
Races - Other race alone (% change since 2000)
Racial diversity
Unemployment (%)
Unemployment (% change since 2000)
Unemployment (%) - White
Unemployment (%) - Black or African American
Unemployment (%) - Asian
Unemployment (%) - Hispanic or Latino
Unemployment (%) - American Indian and Alaska Native
Unemployment (%) - Multirace
Unemployment (%) - Other Race
Population density (people per square mile)
Population - Males (%)
Population - Females (%)
Population - Males (%) - White
Population - Males (%) - Black or African American
Population - Males (%) - Asian
Population - Males (%) - Hispanic or Latino
Population - Males (%) - American Indian and Alaska Native
Population - Males (%) - Multirace
Population - Males (%) - Other Race
Population - Females (%) - White
Population - Females (%) - Black or African American
Population - Females (%) - Asian
Population - Females (%) - Hispanic or Latino
Population - Females (%) - American Indian and Alaska Native
Population - Females (%) - Multirace
Population - Females (%) - Other Race
Coronavirus confirmed cases (Apr 24, 2024)
Deaths caused by coronavirus (Apr 24, 2024)
Coronavirus confirmed cases (per 100k population) (Apr 24, 2024)
Deaths caused by coronavirus (per 100k population) (Apr 24, 2024)
Daily increase in number of cases (Apr 24, 2024)
Weekly increase in number of cases (Apr 24, 2024)
Cases doubled (in days) (Apr 24, 2024)
Hospitalized patients (Apr 18, 2022)
Negative test results (Apr 18, 2022)
Total test results (Apr 18, 2022)
COVID Vaccine doses distributed (per 100k population) (Sep 19, 2023)
COVID Vaccine doses administered (per 100k population) (Sep 19, 2023)
COVID Vaccine doses distributed (Sep 19, 2023)
COVID Vaccine doses administered (Sep 19, 2023)
Likely homosexual households (%)
Likely homosexual households (% change since 2000)
Likely homosexual households - Lesbian couples (%)
Likely homosexual households - Lesbian couples (% change since 2000)
Likely homosexual households - Gay men (%)
Likely homosexual households - Gay men (% change since 2000)
Cost of living index
Median gross rent ($)
Median contract rent ($)
Median monthly housing costs ($)
Median house or condo value ($)
Median house or condo value ($ change since 2000)
Mean house or condo value by units in structure - 1, detached ($)
Mean house or condo value by units in structure - 1, attached ($)
Mean house or condo value by units in structure - 2 ($)
Mean house or condo value by units in structure by units in structure - 3 or 4 ($)
Mean house or condo value by units in structure - 5 or more ($)
Mean house or condo value by units in structure - Boat, RV, van, etc. ($)
Mean house or condo value by units in structure - Mobile home ($)
Median house or condo value ($) - White
Median house or condo value ($) - Black or African American
Median house or condo value ($) - Asian
Median house or condo value ($) - Hispanic or Latino
Median house or condo value ($) - American Indian and Alaska Native
Median house or condo value ($) - Multirace
Median house or condo value ($) - Other Race
Median resident age
Resident age diversity
Median resident age - Males
Median resident age - Females
Median resident age - White
Median resident age - Black or African American
Median resident age - Asian
Median resident age - Hispanic or Latino
Median resident age - American Indian and Alaska Native
Median resident age - Multirace
Median resident age - Other Race
Median resident age - Males - White
Median resident age - Males - Black or African American
Median resident age - Males - Asian
Median resident age - Males - Hispanic or Latino
Median resident age - Males - American Indian and Alaska Native
Median resident age - Males - Multirace
Median resident age - Males - Other Race
Median resident age - Females - White
Median resident age - Females - Black or African American
Median resident age - Females - Asian
Median resident age - Females - Hispanic or Latino
Median resident age - Females - American Indian and Alaska Native
Median resident age - Females - Multirace
Median resident age - Females - Other Race
Commute - mean travel time to work (minutes)
Travel time to work - Less than 5 minutes (%)
Travel time to work - Less than 5 minutes (% change since 2000)
Travel time to work - 5 to 9 minutes (%)
Travel time to work - 5 to 9 minutes (% change since 2000)
Travel time to work - 10 to 19 minutes (%)
Travel time to work - 10 to 19 minutes (% change since 2000)
Travel time to work - 20 to 29 minutes (%)
Travel time to work - 20 to 29 minutes (% change since 2000)
Travel time to work - 30 to 39 minutes (%)
Travel time to work - 30 to 39 minutes (% change since 2000)
Travel time to work - 40 to 59 minutes (%)
Travel time to work - 40 to 59 minutes (% change since 2000)
Travel time to work - 60 to 89 minutes (%)
Travel time to work - 60 to 89 minutes (% change since 2000)
Travel time to work - 90 or more minutes (%)
Travel time to work - 90 or more minutes (% change since 2000)
Marital status - Never married (%)
Marital status - Now married (%)
Marital status - Separated (%)
Marital status - Widowed (%)
Marital status - Divorced (%)
Median family income ($)
Median family income (% change since 2000)
Median non-family income ($)
Median non-family income (% change since 2000)
Median per capita income ($)
Median per capita income (% change since 2000)
Median family income ($) - White
Median family income ($) - Black or African American
Median family income ($) - Asian
Median family income ($) - Hispanic or Latino
Median family income ($) - American Indian and Alaska Native
Median family income ($) - Multirace
Median family income ($) - Other Race
Median year house/condo built
Median year apartment built
Year house built - Built 2005 or later (%)
Year house built - Built 2000 to 2004 (%)
Year house built - Built 1990 to 1999 (%)
Year house built - Built 1980 to 1989 (%)
Year house built - Built 1970 to 1979 (%)
Year house built - Built 1960 to 1969 (%)
Year house built - Built 1950 to 1959 (%)
Year house built - Built 1940 to 1949 (%)
Year house built - Built 1939 or earlier (%)
Average household size
Household density (households per square mile)
Average household size - White
Average household size - Black or African American
Average household size - Asian
Average household size - Hispanic or Latino
Average household size - American Indian and Alaska Native
Average household size - Multirace
Average household size - Other Race
Occupied housing units (%)
Vacant housing units (%)
Owner occupied housing units (%)
Renter occupied housing units (%)
Vacancy status - For rent (%)
Vacancy status - For sale only (%)
Vacancy status - Rented or sold, not occupied (%)
Vacancy status - For seasonal, recreational, or occasional use (%)
Vacancy status - For migrant workers (%)
Vacancy status - Other vacant (%)
Residents with income below the poverty level (%)
Residents with income below 50% of the poverty level (%)
Children below poverty level (%)
Poor families by family type - Married-couple family (%)
Poor families by family type - Male, no wife present (%)
Poor families by family type - Female, no husband present (%)
Poverty status for native-born residents (%)
Poverty status for foreign-born residents (%)
Poverty among high school graduates not in families (%)
Poverty among people who did not graduate high school not in families (%)
Residents with income below the poverty level (%) - White
Residents with income below the poverty level (%) - Black or African American
Residents with income below the poverty level (%) - Asian
Residents with income below the poverty level (%) - Hispanic or Latino
Residents with income below the poverty level (%) - American Indian and Alaska Native
Residents with income below the poverty level (%) - Multirace
Residents with income below the poverty level (%) - Other Race
Air pollution - Air Quality Index (AQI)
Air pollution - CO
Air pollution - NO2
Air pollution - SO2
Air pollution - Ozone
Air pollution - PM10
Air pollution - PM25
Air pollution - Pb
Crime - Murders per 100,000 population
Crime - Rapes per 100,000 population
Crime - Robberies per 100,000 population
Crime - Assaults per 100,000 population
Crime - Burglaries per 100,000 population
Crime - Thefts per 100,000 population
Crime - Auto thefts per 100,000 population
Crime - Arson per 100,000 population
Crime - City-data.com crime index
Crime - Violent crime index
Crime - Property crime index
Crime - Murders per 100,000 population (5 year average)
Crime - Rapes per 100,000 population (5 year average)
Crime - Robberies per 100,000 population (5 year average)
Crime - Assaults per 100,000 population (5 year average)
Crime - Burglaries per 100,000 population (5 year average)
Crime - Thefts per 100,000 population (5 year average)
Crime - Auto thefts per 100,000 population (5 year average)
Crime - Arson per 100,000 population (5 year average)
Crime - City-data.com crime index (5 year average)
Crime - Violent crime index (5 year average)
Crime - Property crime index (5 year average)
1996 Presidential Elections Results (%) - Democratic Party (Clinton)
1996 Presidential Elections Results (%) - Republican Party (Dole)
1996 Presidential Elections Results (%) - Other
2000 Presidential Elections Results (%) - Democratic Party (Gore)
2000 Presidential Elections Results (%) - Republican Party (Bush)
2000 Presidential Elections Results (%) - Other
2004 Presidential Elections Results (%) - Democratic Party (Kerry)
2004 Presidential Elections Results (%) - Republican Party (Bush)
2004 Presidential Elections Results (%) - Other
2008 Presidential Elections Results (%) - Democratic Party (Obama)
2008 Presidential Elections Results (%) - Republican Party (McCain)
2008 Presidential Elections Results (%) - Other
2012 Presidential Elections Results (%) - Democratic Party (Obama)
2012 Presidential Elections Results (%) - Republican Party (Romney)
2012 Presidential Elections Results (%) - Other
2016 Presidential Elections Results (%) - Democratic Party (Clinton)
2016 Presidential Elections Results (%) - Republican Party (Trump)
2016 Presidential Elections Results (%) - Other
2020 Presidential Elections Results (%) - Democratic Party (Biden)
2020 Presidential Elections Results (%) - Republican Party (Trump)
2020 Presidential Elections Results (%) - Other
Ancestries Reported - Arab (%)
Ancestries Reported - Czech (%)
Ancestries Reported - Danish (%)
Ancestries Reported - Dutch (%)
Ancestries Reported - English (%)
Ancestries Reported - French (%)
Ancestries Reported - French Canadian (%)
Ancestries Reported - German (%)
Ancestries Reported - Greek (%)
Ancestries Reported - Hungarian (%)
Ancestries Reported - Irish (%)
Ancestries Reported - Italian (%)
Ancestries Reported - Lithuanian (%)
Ancestries Reported - Norwegian (%)
Ancestries Reported - Polish (%)
Ancestries Reported - Portuguese (%)
Ancestries Reported - Russian (%)
Ancestries Reported - Scotch-Irish (%)
Ancestries Reported - Scottish (%)
Ancestries Reported - Slovak (%)
Ancestries Reported - Subsaharan African (%)
Ancestries Reported - Swedish (%)
Ancestries Reported - Swiss (%)
Ancestries Reported - Ukrainian (%)
Ancestries Reported - United States (%)
Ancestries Reported - Welsh (%)
Ancestries Reported - West Indian (%)
Ancestries Reported - Other (%)
Educational Attainment - No schooling completed (%)
Educational Attainment - Less than high school (%)
Educational Attainment - High school or equivalent (%)
Educational Attainment - Less than 1 year of college (%)
Educational Attainment - 1 or more years of college (%)
Educational Attainment - Associate degree (%)
Educational Attainment - Bachelor's degree (%)
Educational Attainment - Master's degree (%)
Educational Attainment - Professional school degree (%)
Educational Attainment - Doctorate degree (%)
School Enrollment - Nursery, preschool (%)
School Enrollment - Kindergarten (%)
School Enrollment - Grade 1 to 4 (%)
School Enrollment - Grade 5 to 8 (%)
School Enrollment - Grade 9 to 12 (%)
School Enrollment - College undergrad (%)
School Enrollment - Graduate or professional (%)
School Enrollment - Not enrolled in school (%)
School enrollment - Public schools (%)
School enrollment - Private schools (%)
School enrollment - Not enrolled (%)
Median number of rooms in houses and condos
Median number of rooms in apartments
Housing units lacking complete plumbing facilities (%)
Housing units lacking complete kitchen facilities (%)
Density of houses
Urban houses (%)
Rural houses (%)
Households with people 60 years and over (%)
Households with people 65 years and over (%)
Households with people 75 years and over (%)
Households with one or more nonrelatives (%)
Households with no nonrelatives (%)
Population in households (%)
Family households (%)
Nonfamily households (%)
Population in families (%)
Family households with own children (%)
Median number of bedrooms in owner occupied houses
Mean number of bedrooms in owner occupied houses
Median number of bedrooms in renter occupied houses
Mean number of bedrooms in renter occupied houses
Median number of vehichles in owner occupied houses
Mean number of vehichles in owner occupied houses
Median number of vehichles in renter occupied houses
Mean number of vehichles in renter occupied houses
Mortgage status - with mortgage (%)
Mortgage status - with second mortgage (%)
Mortgage status - with home equity loan (%)
Mortgage status - with both second mortgage and home equity loan (%)
Mortgage status - without a mortgage (%)
Average family size
Average family size - White
Average family size - Black or African American
Average family size - Asian
Average family size - Hispanic or Latino
Average family size - American Indian and Alaska Native
Average family size - Multirace
Average family size - Other Race
Geographical mobility - Same house 1 year ago (%)
Geographical mobility - Moved within same county (%)
Geographical mobility - Moved from different county within same state (%)
Geographical mobility - Moved from different state (%)
Geographical mobility - Moved from abroad (%)
Place of birth - Born in state of residence (%)
Place of birth - Born in other state (%)
Place of birth - Native, outside of US (%)
Place of birth - Foreign born (%)
Housing units in structures - 1, detached (%)
Housing units in structures - 1, attached (%)
Housing units in structures - 2 (%)
Housing units in structures - 3 or 4 (%)
Housing units in structures - 5 to 9 (%)
Housing units in structures - 10 to 19 (%)
Housing units in structures - 20 to 49 (%)
Housing units in structures - 50 or more (%)
Housing units in structures - Mobile home (%)
Housing units in structures - Boat, RV, van, etc. (%)
House/condo owner moved in on average (years ago)
Renter moved in on average (years ago)
Year householder moved into unit - Moved in 1999 to March 2000 (%)
Year householder moved into unit - Moved in 1995 to 1998 (%)
Year householder moved into unit - Moved in 1990 to 1994 (%)
Year householder moved into unit - Moved in 1980 to 1989 (%)
Year householder moved into unit - Moved in 1970 to 1979 (%)
Year householder moved into unit - Moved in 1969 or earlier (%)
Means of transportation to work - Drove car alone (%)
Means of transportation to work - Carpooled (%)
Means of transportation to work - Public transportation (%)
Means of transportation to work - Bus or trolley bus (%)
Means of transportation to work - Streetcar or trolley car (%)
Means of transportation to work - Subway or elevated (%)
Means of transportation to work - Railroad (%)
Means of transportation to work - Ferryboat (%)
Means of transportation to work - Taxicab (%)
Means of transportation to work - Motorcycle (%)
Means of transportation to work - Bicycle (%)
Means of transportation to work - Walked (%)
Means of transportation to work - Other means (%)
Working at home (%)
Industry diversity
Most Common Industries - Agriculture, forestry, fishing and hunting, and mining (%)
Most Common Industries - Agriculture, forestry, fishing and hunting (%)
Most Common Industries - Mining, quarrying, and oil and gas extraction (%)
Most Common Industries - Construction (%)
Most Common Industries - Manufacturing (%)
Most Common Industries - Wholesale trade (%)
Most Common Industries - Retail trade (%)
Most Common Industries - Transportation and warehousing, and utilities (%)
Most Common Industries - Transportation and warehousing (%)
Most Common Industries - Utilities (%)
Most Common Industries - Information (%)
Most Common Industries - Finance and insurance, and real estate and rental and leasing (%)
Most Common Industries - Finance and insurance (%)
Most Common Industries - Real estate and rental and leasing (%)
Most Common Industries - Professional, scientific, and management, and administrative and waste management services (%)
Most Common Industries - Professional, scientific, and technical services (%)
Most Common Industries - Management of companies and enterprises (%)
Most Common Industries - Administrative and support and waste management services (%)
Most Common Industries - Educational services, and health care and social assistance (%)
Most Common Industries - Educational services (%)
Most Common Industries - Health care and social assistance (%)
Most Common Industries - Arts, entertainment, and recreation, and accommodation and food services (%)
Most Common Industries - Arts, entertainment, and recreation (%)
Most Common Industries - Accommodation and food services (%)
Most Common Industries - Other services, except public administration (%)
Most Common Industries - Public administration (%)
Occupation diversity
Most Common Occupations - Management, business, science, and arts occupations (%)
Most Common Occupations - Management, business, and financial occupations (%)
Most Common Occupations - Management occupations (%)
Most Common Occupations - Business and financial operations occupations (%)
Most Common Occupations - Computer, engineering, and science occupations (%)
Most Common Occupations - Computer and mathematical occupations (%)
Most Common Occupations - Architecture and engineering occupations (%)
Most Common Occupations - Life, physical, and social science occupations (%)
Most Common Occupations - Education, legal, community service, arts, and media occupations (%)
Most Common Occupations - Community and social service occupations (%)
Most Common Occupations - Legal occupations (%)
Most Common Occupations - Education, training, and library occupations (%)
Most Common Occupations - Arts, design, entertainment, sports, and media occupations (%)
Most Common Occupations - Healthcare practitioners and technical occupations (%)
Most Common Occupations - Health diagnosing and treating practitioners and other technical occupations (%)
Most Common Occupations - Health technologists and technicians (%)
Most Common Occupations - Service occupations (%)
Most Common Occupations - Healthcare support occupations (%)
Most Common Occupations - Protective service occupations (%)
Most Common Occupations - Fire fighting and prevention, and other protective service workers including supervisors (%)
Most Common Occupations - Law enforcement workers including supervisors (%)
Most Common Occupations - Food preparation and serving related occupations (%)
Most Common Occupations - Building and grounds cleaning and maintenance occupations (%)
Most Common Occupations - Personal care and service occupations (%)
Most Common Occupations - Sales and office occupations (%)
Most Common Occupations - Sales and related occupations (%)
Most Common Occupations - Office and administrative support occupations (%)
Most Common Occupations - Natural resources, construction, and maintenance occupations (%)
Most Common Occupations - Farming, fishing, and forestry occupations (%)
Most Common Occupations - Construction and extraction occupations (%)
Most Common Occupations - Installation, maintenance, and repair occupations (%)
Most Common Occupations - Production, transportation, and material moving occupations (%)
Most Common Occupations - Production occupations (%)
Most Common Occupations - Transportation occupations (%)
Most Common Occupations - Material moving occupations (%)
People in Group quarters - Institutionalized population (%)
People in Group quarters - Correctional institutions (%)
People in Group quarters - Federal prisons and detention centers (%)
People in Group quarters - Halfway houses (%)
People in Group quarters - Local jails and other confinement facilities (including police lockups) (%)
People in Group quarters - Military disciplinary barracks (%)
People in Group quarters - State prisons (%)
People in Group quarters - Other types of correctional institutions (%)
People in Group quarters - Nursing homes (%)
People in Group quarters - Hospitals/wards, hospices, and schools for the handicapped (%)
People in Group quarters - Hospitals/wards and hospices for chronically ill (%)
People in Group quarters - Hospices or homes for chronically ill (%)
People in Group quarters - Military hospitals or wards for chronically ill (%)
People in Group quarters - Other hospitals or wards for chronically ill (%)
People in Group quarters - Hospitals or wards for drug/alcohol abuse (%)
People in Group quarters - Mental (Psychiatric) hospitals or wards (%)
People in Group quarters - Schools, hospitals, or wards for the mentally retarded (%)
People in Group quarters - Schools, hospitals, or wards for the physically handicapped (%)
People in Group quarters - Institutions for the deaf (%)
People in Group quarters - Institutions for the blind (%)
People in Group quarters - Orthopedic wards and institutions for the physically handicapped (%)
People in Group quarters - Wards in general hospitals for patients who have no usual home elsewhere (%)
People in Group quarters - Wards in military hospitals for patients who have no usual home elsewhere (%)
People in Group quarters - Juvenile institutions (%)
People in Group quarters - Long-term care (%)
People in Group quarters - Homes for abused, dependent, and neglected children (%)
People in Group quarters - Residential treatment centers for emotionally disturbed children (%)
People in Group quarters - Training schools for juvenile delinquents (%)
People in Group quarters - Short-term care, detention or diagnostic centers for delinquent children (%)
People in Group quarters - Type of juvenile institution unknown (%)
People in Group quarters - Noninstitutionalized population (%)
People in Group quarters - College dormitories (includes college quarters off campus) (%)
People in Group quarters - Military quarters (%)
People in Group quarters - On base (%)
People in Group quarters - Barracks, unaccompanied personnel housing (UPH), (Enlisted/Officer), ;and similar group living quarters for military personnel (%)
People in Group quarters - Transient quarters for temporary residents (%)
People in Group quarters - Military ships (%)
People in Group quarters - Group homes (%)
People in Group quarters - Homes or halfway houses for drug/alcohol abuse (%)
People in Group quarters - Homes for the mentally ill (%)
People in Group quarters - Homes for the mentally retarded (%)
People in Group quarters - Homes for the physically handicapped (%)
People in Group quarters - Other group homes (%)
People in Group quarters - Religious group quarters (%)
People in Group quarters - Dormitories (%)
People in Group quarters - Agriculture workers' dormitories on farms (%)
People in Group quarters - Job Corps and vocational training facilities (%)
People in Group quarters - Other workers' dormitories (%)
People in Group quarters - Crews of maritime vessels (%)
People in Group quarters - Other nonhousehold living situations (%)
People in Group quarters - Other noninstitutional group quarters (%)
Residents speaking English at home (%)
Residents speaking English at home - Born in the United States (%)
Residents speaking English at home - Native, born elsewhere (%)
Residents speaking English at home - Foreign born (%)
Residents speaking Spanish at home (%)
Residents speaking Spanish at home - Born in the United States (%)
Residents speaking Spanish at home - Native, born elsewhere (%)
Residents speaking Spanish at home - Foreign born (%)
Residents speaking other language at home (%)
Residents speaking other language at home - Born in the United States (%)
Residents speaking other language at home - Native, born elsewhere (%)
Residents speaking other language at home - Foreign born (%)
Class of Workers - Employee of private company (%)
Class of Workers - Self-employed in own incorporated business (%)
Class of Workers - Private not-for-profit wage and salary workers (%)
Class of Workers - Local government workers (%)
Class of Workers - State government workers (%)
Class of Workers - Federal government workers (%)
Class of Workers - Self-employed workers in own not incorporated business and Unpaid family workers (%)
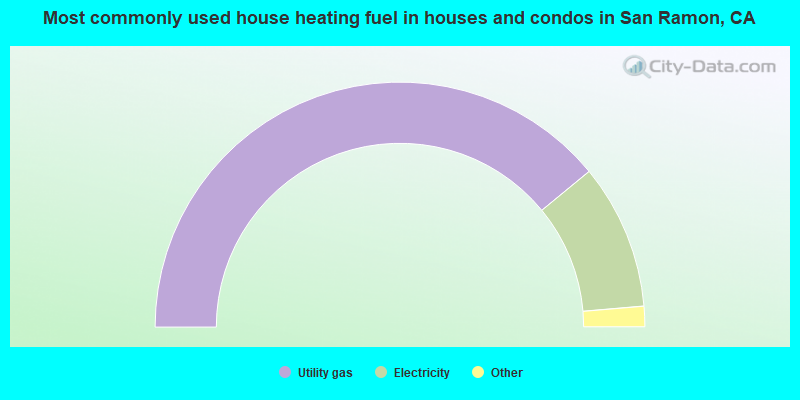
House heating fuel used in houses and condos - Utility gas (%)
House heating fuel used in houses and condos - Bottled, tank, or LP gas (%)
House heating fuel used in houses and condos - Electricity (%)
House heating fuel used in houses and condos - Fuel oil, kerosene, etc. (%)
House heating fuel used in houses and condos - Coal or coke (%)
House heating fuel used in houses and condos - Wood (%)
House heating fuel used in houses and condos - Solar energy (%)
House heating fuel used in houses and condos - Other fuel (%)
House heating fuel used in houses and condos - No fuel used (%)
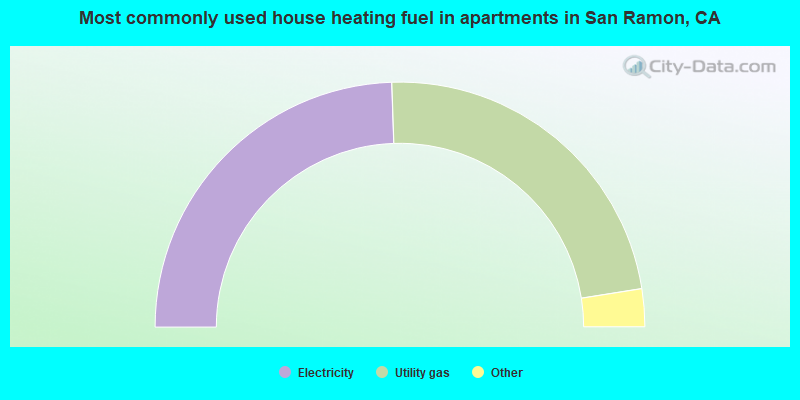
House heating fuel used in apartments - Utility gas (%)
House heating fuel used in apartments - Bottled, tank, or LP gas (%)
House heating fuel used in apartments - Electricity (%)
House heating fuel used in apartments - Fuel oil, kerosene, etc. (%)
House heating fuel used in apartments - Coal or coke (%)
House heating fuel used in apartments - Wood (%)
House heating fuel used in apartments - Solar energy (%)
House heating fuel used in apartments - Other fuel (%)
House heating fuel used in apartments - No fuel used (%)
Armed forces status - In Armed Forces (%)
Armed forces status - Civilian (%)
Armed forces status - Civilian - Veteran (%)
Armed forces status - Civilian - Nonveteran (%)
Fatal accidents locations in years 2005-2021
Fatal accidents locations in 2005
Fatal accidents locations in 2006
Fatal accidents locations in 2007
Fatal accidents locations in 2008
Fatal accidents locations in 2009
Fatal accidents locations in 2010
Fatal accidents locations in 2011
Fatal accidents locations in 2012
Fatal accidents locations in 2013
Fatal accidents locations in 2014
Fatal accidents locations in 2015
Fatal accidents locations in 2016
Fatal accidents locations in 2017
Fatal accidents locations in 2018
Fatal accidents locations in 2019
Fatal accidents locations in 2020
Fatal accidents locations in 2021
Alcohol use - People drinking some alcohol every month (%)
Alcohol use - People not drinking at all (%)
Alcohol use - Average days/month drinking alcohol
Alcohol use - Average drinks/week
Alcohol use - Average days/year people drink much
Audiometry - Average condition of hearing (%)
Audiometry - People that can hear a whisper from across a quiet room (%)
Audiometry - People that can hear normal voice from across a quiet room (%)
Audiometry - Ears ringing, roaring, buzzing (%)
Audiometry - Had a job exposure to loud noise (%)
Audiometry - Had off-work exposure to loud noise (%)
Blood Pressure & Cholesterol - Has high blood pressure (%)
Blood Pressure & Cholesterol - Checking blood pressure at home (%)
Blood Pressure & Cholesterol - Frequently checking blood cholesterol (%)
Blood Pressure & Cholesterol - Has high cholesterol level (%)
Consumer Behavior - Money monthly spent on food at supermarket/grocery store
Consumer Behavior - Money monthly spent on food at other stores
Consumer Behavior - Money monthly spent on eating out
Consumer Behavior - Money monthly spent on carryout/delivered foods
Consumer Behavior - Income spent on food at supermarket/grocery store (%)
Consumer Behavior - Income spent on food at other stores (%)
Consumer Behavior - Income spent on eating out (%)
Consumer Behavior - Income spent on carryout/delivered foods (%)
Current Health Status - General health condition (%)
Current Health Status - Blood donors (%)
Current Health Status - Has blood ever tested for HIV virus (%)
Current Health Status - Left-handed people (%)
Dermatology - People using sunscreen (%)
Diabetes - Diabetics (%)
Diabetes - Had a blood test for high blood sugar (%)
Diabetes - People taking insulin (%)
Diet Behavior & Nutrition - Diet health (%)
Diet Behavior & Nutrition - Milk product consumption (# of products/month)
Diet Behavior & Nutrition - Meals not home prepared (#/week)
Diet Behavior & Nutrition - Meals from fast food or pizza place (#/week)
Diet Behavior & Nutrition - Ready-to-eat foods (#/month)
Diet Behavior & Nutrition - Frozen meals/pizza (#/month)
Drug Use - People that ever used marijuana or hashish (%)
Drug Use - Ever used hard drugs (%)
Drug Use - Ever used any form of cocaine (%)
Drug Use - Ever used heroin (%)
Drug Use - Ever used methamphetamine (%)
Health Insurance - People covered by health insurance (%)
Kidney Conditions-Urology - Avg. # of times urinating at night
Medical Conditions - People with asthma (%)
Medical Conditions - People with anemia (%)
Medical Conditions - People with psoriasis (%)
Medical Conditions - People with overweight (%)
Medical Conditions - Elderly people having difficulties in thinking or remembering (%)
Medical Conditions - People who ever received blood transfusion (%)
Medical Conditions - People having trouble seeing even with glass/contacts (%)
Medical Conditions - People with arthritis (%)
Medical Conditions - People with gout (%)
Medical Conditions - People with congestive heart failure (%)
Medical Conditions - People with coronary heart disease (%)
Medical Conditions - People with angina pectoris (%)
Medical Conditions - People who ever had heart attack (%)
Medical Conditions - People who ever had stroke (%)
Medical Conditions - People with emphysema (%)
Medical Conditions - People with thyroid problem (%)
Medical Conditions - People with chronic bronchitis (%)
Medical Conditions - People with any liver condition (%)
Medical Conditions - People who ever had cancer or malignancy (%)
Mental Health - People who have little interest in doing things (%)
Mental Health - People feeling down, depressed, or hopeless (%)
Mental Health - People who have trouble sleeping or sleeping too much (%)
Mental Health - People feeling tired or having little energy (%)
Mental Health - People with poor appetite or overeating (%)
Mental Health - People feeling bad about themself (%)
Mental Health - People who have trouble concentrating on things (%)
Mental Health - People moving or speaking slowly or too fast (%)
Mental Health - People having thoughts they would be better off dead (%)
Oral Health - Average years since last visit a dentist
Oral Health - People embarrassed because of mouth (%)
Oral Health - People with gum disease (%)
Oral Health - General health of teeth and gums (%)
Oral Health - Average days a week using dental floss/device
Oral Health - Average days a week using mouthwash for dental problem
Oral Health - Average number of teeth
Pesticide Use - Households using pesticides to control insects (%)
Pesticide Use - Households using pesticides to kill weeds (%)
Physical Activity - People doing vigorous-intensity work activities (%)
Physical Activity - People doing moderate-intensity work activities (%)
Physical Activity - People walking or bicycling (%)
Physical Activity - People doing vigorous-intensity recreational activities (%)
Physical Activity - People doing moderate-intensity recreational activities (%)
Physical Activity - Average hours a day doing sedentary activities
Physical Activity - Average hours a day watching TV or videos
Physical Activity - Average hours a day using computer
Physical Functioning - People having limitations keeping them from working (%)
Physical Functioning - People limited in amount of work they can do (%)
Physical Functioning - People that need special equipment to walk (%)
Physical Functioning - People experiencing confusion/memory problems (%)
Physical Functioning - People requiring special healthcare equipment (%)
Prescription Medications - Average number of prescription medicines taking
Preventive Aspirin Use - Adults 40+ taking low-dose aspirin (%)
Reproductive Health - Vaginal deliveries (%)
Reproductive Health - Cesarean deliveries (%)
Reproductive Health - Deliveries resulted in a live birth (%)
Reproductive Health - Pregnancies resulted in a delivery (%)
Reproductive Health - Women breastfeeding newborns (%)
Reproductive Health - Women that had a hysterectomy (%)
Reproductive Health - Women that had both ovaries removed (%)
Reproductive Health - Women that have ever taken birth control pills (%)
Reproductive Health - Women taking birth control pills (%)
Reproductive Health - Women that have ever used Depo-Provera or injectables (%)
Reproductive Health - Women that have ever used female hormones (%)
Sexual Behavior - People 18+ that ever had sex (vaginal, anal, or oral) (%)
Sexual Behavior - Males 18+ that ever had vaginal sex with a woman (%)
Sexual Behavior - Males 18+ that ever performed oral sex on a woman (%)
Sexual Behavior - Males 18+ that ever had anal sex with a woman (%)
Sexual Behavior - Males 18+ that ever had any sex with a man (%)
Sexual Behavior - Females 18+ that ever had vaginal sex with a man (%)
Sexual Behavior - Females 18+ that ever performed oral sex on a man (%)
Sexual Behavior - Females 18+ that ever had anal sex with a man (%)
Sexual Behavior - Females 18+ that ever had any kind of sex with a woman (%)
Sexual Behavior - Average age people first had sex
Sexual Behavior - Average number of female sex partners in lifetime (males 18+)
Sexual Behavior - Average number of female vaginal sex partners in lifetime (males 18+)
Sexual Behavior - Average age people first performed oral sex on a woman (18+)
Sexual Behavior - Average number of woman performed oral sex on in lifetime (18+)
Sexual Behavior - Average number of male sex partners in lifetime (males 18+)
Sexual Behavior - Average number of male anal sex partners in lifetime (males 18+)
Sexual Behavior - Average age people first performed oral sex on a man (18+)
Sexual Behavior - Average number of male oral sex partners in lifetime (18+)
Sexual Behavior - People using protection when performing oral sex (%)
Sexual Behavior - Average number of times people have vaginal or anal sex a year
Sexual Behavior - People having sex without condom (%)
Sexual Behavior - Average number of male sex partners in lifetime (females 18+)
Sexual Behavior - Average number of male vaginal sex partners in lifetime (females 18+)
Sexual Behavior - Average number of female sex partners in lifetime (females 18+)
Sexual Behavior - Circumcised males 18+ (%)
Sleep Disorders - Average hours sleeping at night
Sleep Disorders - People that has trouble sleeping (%)
Smoking-Cigarette Use - People smoking cigarettes (%)
Taste & Smell - People 40+ having problems with smell (%)
Taste & Smell - People 40+ having problems with taste (%)
Taste & Smell - People 40+ that ever had wisdom teeth removed (%)
Taste & Smell - People 40+ that ever had tonsils teeth removed (%)
Taste & Smell - People 40+ that ever had a loss of consciousness because of a head injury (%)
Taste & Smell - People 40+ that ever had a broken nose or other serious injury to face or skull (%)
Taste & Smell - People 40+ that ever had two or more sinus infections (%)
Weight - Average height (inches)
Weight - Average weight (pounds)
Weight - Average BMI
Weight - People that are obese (%)
Weight - People that ever were obese (%)
Weight - People trying to lose weight (%)
40,863 47.5% Asian alone 28,346 33.0% White alone 7,069 8.2% Hispanic 4,777 5.6% Two or more races 3,352 3.9% Black alone 1,255 1.5% Other race alone 297 0.3% American Indian alone
According to our research of California and other state lists, there were 2 registered sex offenders living in San Ramon, California as of April 25, 2024 . The ratio of all residents to sex offenders in San Ramon is 38,096 to 1.The ratio of registered sex offenders to all residents in this city is much lower than the state average.
Latest news from San Ramon, CA collected exclusively by city-data.com from local newspapers, TV, and radio stations
Ancestries: Iranian (2.6%), English (2.5%), American (2.1%), German (2.1%), European (2.1%), Irish (1.7%).
Current Local Time:
Land area: 11.6 square miles.
Population density: 7,423 people per square mile (high).
31,801 residents are foreign born (30.9% Asia ).
This city:
37.1%California:
26.5%
Median real estate property taxes paid for housing units with mortgages in 2022: $10,001 (0.6%)Median real estate property taxes paid for housing units with no mortgage in 2022: $6,726 (0.5%)
Nearest city with pop. 50,000+: Pleasanton, CA
Nearest city with pop. 200,000+: Central Contra Costa, CA (12.3 miles
Nearest city with pop. 1,000,000+: Los Angeles, CA
Nearest cities:
Latitude: 37.76 N, Longitude: 121.95 W
Daytime population change due to commuting: -1,063 (-1.2%)Workers who live and work in this city: 22,503 (49.9%)
Area code commonly used in this area: 925
Single-family new house construction building permits:
2022: 40 buildings , average cost: $392,3002021: 22 buildings , average cost: $425,5002020: 30 buildings , average cost: $498,2002019: 74 buildings , average cost: $309,2002018: 160 buildings , average cost: $425,0002017: 2 buildings , average cost: $408,1002016: 2 buildings , average cost: $408,1002015: 7 buildings , average cost: $408,1002012: 3 buildings , average cost: $417,9002008: 1 building , cost: $378,0002007: 76 buildings , average cost: $533,7002006: 27 buildings , average cost: $231,3002005: 33 buildings , average cost: $239,2002002: 14 buildings , average cost: $318,2002001: 80 buildings , average cost: $260,0002000: 241 buildings , average cost: $262,4001999: 104 buildings , average cost: $202,4001998: 120 buildings , average cost: $220,1001997: 370 buildings , average cost: $199,000Unemployment in December 2023: Population change in the 1990s: +9,199 (+25.9%).
Most common occupations in San Ramon, CA (%)
Both Males Females
Computer specialists (7.6%)
Sales representatives, services, wholesale and manufacturing (6.8%)
Other management occupations, except farmers and farm managers (6.5%)
Other sales and related occupations, including supervisors (5.2%)
Top executives (4.7%)
Other office and administrative support workers, including supervisors (4.5%)
Advertising, marketing, promotions, public relations, and sales managers (3.8%)
Computer specialists (9.9%)
Sales representatives, services, wholesale and manufacturing (9.0%)
Other management occupations, except farmers and farm managers (7.2%)
Top executives (6.5%)
Other sales and related occupations, including supervisors (5.6%)
Engineers (5.4%)
Advertising, marketing, promotions, public relations, and sales managers (4.2%)
Other office and administrative support workers, including supervisors (6.8%)
Preschool, kindergarten, elementary, and middle school teachers (6.0%)
Other management occupations, except farmers and farm managers (5.7%)
Secretaries and administrative assistants (5.5%)
Computer specialists (5.0%)
Other sales and related occupations, including supervisors (4.7%)
Sales representatives, services, wholesale and manufacturing (4.2%)
Earthquake activity:
San Ramon-area historical earthquake activity is significantly above California state average. It is 7726% greater than the overall U.S. average. On 4/18/1906 at 13:12:21, a magnitude 7.9 (7.9 UK, Class: Major, Intensity: VIII - XII) earthquake occurred 59.6 miles away from the city center, causing $524,000,000 total damage On 10/18/1989 at 00:04:15, a magnitude 7.1 (6.5 MB, 7.1 MS, 6.9 MW, 7.0 ML) earthquake occurred 45.9 miles away from San Ramon center, causing 62 deaths ( 62 shaking deaths) and 3757 injuries, causing $1,305,032,704 total damage On 11/4/1927 at 13:51:53, a magnitude 7.5 (7.5 UK) earthquake occurred 203.2 miles away from San Ramon center On 7/21/1952 at 11:52:14, a magnitude 7.7 (7.7 UK) earthquake occurred 251.8 miles away from San Ramon center, causing $50,000,000 total damage On 1/31/1922 at 13:17:28, a magnitude 7.6 (7.6 UK) earthquake occurred 280.4 miles away from San Ramon center On 4/25/1992 at 18:06:04, a magnitude 7.2 (6.3 MB, 7.1 MS, 7.2 MW, 7.1 MW, Depth: 9.4 mi) earthquake occurred 212.3 miles away from San Ramon center, causing $75,000,000 total damage Magnitude types: body-wave magnitude (MB), local magnitude (ML), surface-wave magnitude (MS), moment magnitude (MW) Natural disasters: The number of natural disasters in Contra Costa County (18) is near the US average (15).Major Disasters (Presidential) Declared: 11Emergencies Declared: 3Floods: 13, Storms: 7, Winter Storms: 7, Mudslides: 5, Landslides: 4, Drought: 1, Earthquake: 1, Hurricane: 1, Tornado: 1, Wind: 1, Other: 1 (Note: some incidents may be assigned to more than one category). Main business address for: CHEVRONTEXACO CORP PETROLEUM REFINING ), SBE INC COMPUTER COMMUNICATIONS EQUIPMENT ).
Hospitals and medical centers in San Ramon: CONNIE'S ICF/DDH (237 KENT PLACE) SAN RAMON REGIONAL MEDICAL CTR (Proprietary, 6001 NORRIS CANYON ROAD) ACCENTCARE HOME HEALTH OF CALIFORNIA, INC (3170 CROW CANYON PLACE, SUITE 270)
ALLIANCE HOME HEALTH CARE (12657 ALCOSTA BLVD, SUITE 155)
SENIOR HAVEN HOME CARE (2010 CROW CANYON PLACE SUITE 170)
SAN RAMON REHAB HOSPITAL (7777 NORRIS CANYON ROAD)
Airports located in San Ramon: Amtrak stations near San Ramon: 6 miles: EAST DUBLIN-PLEASANTON (PLEASANTON, OWENS DR. AT BART WAY) - Bus Station 11 miles: HAYWARD (22555 MEEKLAND AVE.) Services: fully wheelchair accessible, public payphones, free short-term parking.
13 miles: LIVERMORE (720 LAS FLORES DR.) - Bus Station Services: fully wheelchair accessible, enclosed waiting area, public restrooms, public payphones, full-service food facilities, free short-term parking, free long-term parking, call for taxi service, intercity bus service, public transit connection.
Colleges/universities with over 2000 students nearest to San Ramon:
Las Positas College (about 9 miles; Livermore, CA ; Full-time enrollment: 5,112)
California State University-East Bay (about 10 miles; Hayward, CA ; FT enrollment: 12,956)
Saint Mary's College of California (about 11 miles; Moraga, CA ; FT enrollment: 4,200)
Chabot College (about 12 miles; Hayward, CA ; FT enrollment: 7,610)
Merritt College (about 12 miles; Oakland, CA ; FT enrollment: 2,842)
Diablo Valley College (about 16 miles; Pleasant Hill, CA ; FT enrollment: 13,015)
Ohlone College (about 16 miles; Fremont, CA ; FT enrollment: 6,153)
Public high schools in San Ramon:
Biggest public elementary/middle schools in San Ramon: IRON HORSE MIDDLE Students: 874, Location: 12601 ALCOSTA BLVD., Grades: 6-8)PINE VALLEY MIDDLE Students: 862, Location: 3000 PINE VALLEY RD., Grades: 6-8)WINDEMERE RANCH MIDDLE Students: 571, Location: 11611 E. BRANCH PKWY., Grades: 6-8)COYOTE CREEK ELEMENTARY Students: 499, Location: 8700 N. GALE RIDGE RD., Grades: KG-5)HIDDEN HILLS ELEMENTARY Students: 470, Location: 12995 HARCT. WAY, Grades: KG-5)GOLDEN VIEW ELEMENTARY Students: 378, Location: 5025 CANYON CREST DR., Grades: KG-5)QUAIL RUN ELEMENTARY Students: 370, Location: 4000 GOLDENBAY AVE., Grades: KG-5)COUNTRY CLUB ELEMENTARY Students: 349, Location: 7534 BLUE FOX WAY, Grades: KG-5)NEIL A. ARMSTRONG ELEMENTARY Students: 325, Location: 2849 CALAIS DR., Grades: KG-5)BOLLINGER CANYON ELEMENTARY Students: 318, Location: 2300 TALAVERA DR., Grades: KG-5)Private elementary/middle school in San Ramon: MONTESSORI SCHOOL OF SAN RAMON Students: 27, Location: 2400 OLD CROW CANYON RD, Grades: PK-1)
See full list of schools located in San Ramon User-submitted facts and corrections:
San Ramon, CA is listed with Zip Code 94583. A new Zip Code, 94582, was added in 2005, and now San Ramon has two.
Notable locations in San Ramon: (A) , Canyon Lakes Golf Course (B) , San Ramon National Golf Club (C) , San Ramon Library (D) , San Ramon Valley Fire Protection District Station 34 (E) , San Ramon Valley Fire Protection District Station 39 (F) , San Ramon Valley Fire Protection District Station 38 (G) . Display/hide their locations on the map
Shopping Centers: (1) , Crow Canyon Commons Shopping Center (2) , Diablo Plaza Shopping Center (3) , San Ramon Village Shopping Center (4) , The Marketplace Shopping Center (5) . Display/hide their locations on the map
Main business address in San Ramon include: (A) , SBE INC (B) . Display/hide their locations on the map
Creeks: (A) , San Catanio Creek (B) . Display/hide their locations on the map
Parks in San Ramon include: (1) , Boone Acres Park (2) , Sunny Glen Recreational Area (3) . Display/hide their locations on the map
Birthplace of: Andrew Wiedeman - Soccer player.
Contra Costa County has a predicted average indoor radon screening level between 2 and 4 pCi/L (pico curies per liter) - Moderate Potential Drinking water stations with addresses in San Ramon and their reported violations in the past:
WHISKEY SLOUGH HARBOR (Population served: 200, Groundwater):
Past health violations:
MCL, Monthly (TCR) - In JUN-2006, Contaminant: Coliform. Follow-up actions: St Public Notif requested (JUN-01-2006)
MCL, Monthly (TCR) - In JUN-2006, Contaminant: Coliform. Follow-up actions: St Public Notif requested (JUN-01-2006)
MCL, Monthly (TCR) - In FEB-2005, Contaminant: Coliform. Follow-up actions: St Public Notif requested (FEB-01-2005)
MCL, Monthly (TCR) - In FEB-2005, Contaminant: Coliform. Follow-up actions: St Public Notif requested (FEB-01-2005)
Average household size: This city:
2.9 peopleCalifornia:
2.9 people
Percentage of family households: This city:
75.8%Whole state:
68.7%
Percentage of households with unmarried partners: This city:
5.0%Whole state:
7.2%
Likely homosexual households (counted as self-reported same-sex unmarried-partner households)
Lesbian couples: 0.4% of all households Gay men: 0.4% of all households
People in group quarters in San Ramon in 2010:
30 people in workers' group living quarters and job corps centers
23 people in group homes for juveniles (non-correctional)
15 people in group homes intended for adults
7 people in residential treatment centers for adults
People in group quarters in San Ramon in 2000:
42 people in hospitals/wards and hospices for chronically ill
42 people in other hospitals or wards for chronically ill
38 people in other noninstitutional group quarters
5 people in nursing homes
Banks with most branches in San Ramon (2011 data):
U.S. Bank National Association: San Ramon Valley Blvd Safeway, San Ramon Lucky Branch, San Ramon Branch, San Ramon - Crow Canyon Road Branch, Bollinger Canyon Safeway. Info updated 2012/01/30: Bank assets: $330,470.8 mil, Deposits: $236,091.5 mil, headquarters in Cincinnati, OH, positive income , 3121 total offices , Holding Company: U.S. Bancorp
Wells Fargo Bank, National Association: San Ramon Branch, Dougherty Valley Branch, San Ramon-Alcosta Branch, Market And Bollinger Cyn Branch, Bishop Ranch Branch. Info updated 2011/04/05: Bank assets: $1,161,490.0 mil, Deposits: $905,653.0 mil, headquarters in Sioux Falls, SD, positive income , 6395 total offices , Holding Company: Wells Fargo & Company
JPMorgan Chase Bank, National Association: Dougherty And Bollinger Branch at 11030 Bollinger Canyon Rd, Ste 100, branch established on 2009/05/19; San Ramon Branch at 3104 A Crow Canyon Place, branch established on 1934/11/01. Info updated 2011/11/10: Bank assets: $1,811,678.0 mil, Deposits: $1,190,738.0 mil, headquarters in Columbus, OH, positive income , International Specialization, 5577 total offices , Holding Company: Jpmorgan Chase & Co.
Bank of the West: Bishop Ranch 7 Branch at 2527 Camino Ramon, branch established on 2010/10/25; San Ramon Branch at 140 Sunset Drive, branch established on 2001/03/13. Info updated 2009/11/16: Bank assets: $62,408.3 mil, Deposits: $43,995.2 mil, headquarters in San Francisco, CA, positive income , 647 total offices , Holding Company: Bnp Paribas
Bank of America, National Association: San Ramon Branch at 3100 Crow Canyon Place, branch established on 1980/08/21; Marketplace Branch, The at 450 Montgomery Street, branch established on 1970/07/20. Info updated 2009/11/18: Bank assets: $1,451,969.3 mil, Deposits: $1,077,176.8 mil, headquarters in Charlotte, NC, positive income , 5782 total offices , Holding Company: Bank Of America Corporation
Union Bank, National Association: Gale Ranch Branch at 11000 Bollinger Canyon Rd Ste H, branch established on 2007/12/17; San Ramon Branch at 3223 Crow Canyon Road, branch established on 1985/05/20. Info updated 2011/09/01: Bank assets: $88,967.5 mil, Deposits: $65,286.4 mil, headquarters in San Francisco, CA, positive income , Commercial Lending Specialization, 403 total offices , Holding Company: Mitsubishi Ufj Financial Group, Inc.
First Republic Bank: San Ramon Branch at 3130 Crow Canyon Place, branch established on 1985/11/12. Info updated 2010/08/03: Bank assets: $27,791.8 mil, Deposits: $22,459.3 mil, headquarters in San Francisco, CA, positive income , Mortgage Lending Specialization, 60 total offices
Fremont Bank: San Ramon Valley Branch at 21001 San Ramon Valley Blvd,suite D3, branch established on 1998/03/16. Info updated 2006/11/03: Bank assets: $2,367.9 mil, Deposits: $1,975.1 mil, headquarters in Fremont, CA, positive income , Commercial Lending Specialization, 19 total offices , Holding Company: Fremont Bancorporation
Comerica Bank: San Ramon Branch at 3110 Crow Canyon Place, Ste A, branch established on 2006/09/12. Info updated 2011/07/29: Bank assets: $60,970.5 mil, Deposits: $48,300.9 mil, headquarters in Dallas, TX, positive income , Commercial Lending Specialization, 497 total offices , Holding Company: Comerica Incorporated
2 other banks with 2 local branches
For population 15 years and over in San Ramon:
Never married: 24.5%Now married: 66.4%Separated: 1.2%Widowed: 4.3%Divorced: 3.6% For population 25 years and over in San Ramon:
High school or higher: 95.7%Bachelor's degree or higher: 72.1%Graduate or professional degree: 34.7%Unemployed: 3.7%Mean travel time to work (commute): 22.9 minutes
Education Gini index (Inequality in education) Here:
10.7California average:
15.5
Religion statistics for San Ramon, CA (based on Contra Costa County data)
Religion Adherents Congregations Catholic 228,400 34 Evangelical Protestant 81,120 352 Other 48,553 123 Mainline Protestant 32,693 101 Black Protestant 10,395 34 Orthodox 2,435 8 None 645,429 -
Source: Clifford Grammich, Kirk Hadaway, Richard Houseal, Dale E.Jones, Alexei Krindatch, Richie Stanley and Richard H.Taylor. 2012. 2010 U.S.Religion Census: Religious Congregations & Membership Study. Association of Statisticians of American Religious Bodies. Jones, Dale E., et al. 2002. Congregations and Membership in the United States 2000. Nashville, TN: Glenmary Research Center. Graphs represent county-level data
Food Environment Statistics: Number of grocery stores : 181Contra Costa County :
1.78 / 10,000 pop.California :
2.14 / 10,000 pop.
Number of supercenters and club stores : 5This county :
0.05 / 10,000 pop.California :
0.04 / 10,000 pop.
Number of convenience stores (no gas) : 52This county :
0.51 / 10,000 pop.California :
0.62 / 10,000 pop.
Number of convenience stores (with gas) : 178Contra Costa County :
1.75 / 10,000 pop.California :
1.49 / 10,000 pop.
Number of full-service restaurants : 683This county :
6.73 / 10,000 pop.California :
7.42 / 10,000 pop.
Adult diabetes rate : This county :
7.1%California :
7.3%
Adult obesity rate : Contra Costa County :
22.2%California :
21.3%
Low-income preschool obesity rate : Here :
16.8%California :
17.9%
Health and Nutrition: Healthy diet rate : San Ramon:
54.1%California:
49.4%
Average overall health of teeth and gums : San Ramon:
53.4%State:
48.0%
People feeling badly about themselves : San Ramon:
19.4%State:
20.2%
People not drinking alcohol at all : Average hours sleeping at night : San Ramon:
6.8California:
6.8
Overweight people : This city:
32.7%California:
31.5%
General health condition : San Ramon:
60.7%California:
56.4%
Average condition of hearing : San Ramon:
82.2%California:
80.9%
More about Health and Nutrition of San Ramon, CA Residents
Local government employment and payroll (March 2022)
Function
Full-time employees
Monthly full-time payroll
Average yearly full-time wage
Part-time employees
Monthly part-time payroll
Parks and Recreation
68 $555,688 $98,063 87 $98,449 Police Protection - Officers
66 $960,637 $174,661 0 $0 Streets and Highways
42 $438,765 $125,361 7 $29,454 Housing and Community Development (Local)
19 $193,763 $122,377 1 $1,980 Financial Administration
18 $174,076 $116,051 0 $0 Police - Other
17 $132,264 $93,363 3 $4,402 Other and Unallocable
16 $223,373 $167,530 2 $16,634 Other Government Administration
12 $107,577 $107,577 0 $0 Solid Waste Management
2 $16,034 $96,204 0 $0 Judicial and Legal
2 $22,141 $132,846 0 $0
Totals for Government
262 $2,824,317 $129,358 100 $150,920
San Ramon government finances - Expenditure in 2017 (per resident):
Construction - Protective Inspection and Regulation - Other: $5,258,000 ($61.17)
Housing and Community Development: $5,106,000 ($59.40)General - Other: $896,000 ($10.42)Current Operations - Police Protection: $19,960,000 ($232.22)
Parks and Recreation: $18,312,000 ($213.05)Regular Highways: $11,055,000 ($128.62)Central Staff Services: $10,698,000 ($124.46)Protective Inspection and Regulation - Other: $6,477,000 ($75.36)Financial Administration: $1,462,000 ($17.01)Housing and Community Development: $523,000 ($6.08)Solid Waste Management: $354,000 ($4.12)Libraries: $135,000 ($1.57)General - Interest on Debt: $3,823,000 ($44.48)
Other Capital Outlay - Parks and Recreation: $1,020,000 ($11.87)
General Public Building: $169,000 ($1.97)
San Ramon government finances - Revenue in 2017 (per resident):
Charges - Other: $8,254,000 ($96.03)
Parks and Recreation: $3,635,000 ($42.29)Regular Highways: $789,000 ($9.18)Solid Waste Management: $12,000 ($0.14)Federal Intergovernmental - Other: $500,000 ($5.82)
Local Intergovernmental - Other: $14,993,000 ($174.43)
Miscellaneous - Sale of Property: $5,607,000 ($65.23)
General Revenue - Other: $3,977,000 ($46.27)Rents: $2,246,000 ($26.13)Fines and Forfeits: $430,000 ($5.00)Interest Earnings: $205,000 ($2.39)Donations From Private Sources: $116,000 ($1.35)State Intergovernmental - Other: $2,234,000 ($25.99)
Highways: $1,557,000 ($18.11)General Local Government Support: $111,000 ($1.29)Tax - Property: $22,290,000 ($259.33)
General Sales and Gross Receipts: $9,329,000 ($108.54)Public Utilities Sales: $4,580,000 ($53.28)Other Selective Sales: $2,894,000 ($33.67)Other: $2,880,000 ($33.51)Other License: $2,264,000 ($26.34)Documentary and Stock Transfer: $916,000 ($10.66)Occupation and Business License - Other: $237,000 ($2.76)
San Ramon government finances - Debt in 2017 (per resident):
Long Term Debt - Beginning Outstanding - Unspecified Public Purpose: $93,216,000 ($1084.50)
Outstanding Unspecified Public Purpose: $89,356,000 ($1039.59)Retired Unspecified Public Purpose: $3,861,000 ($44.92)
San Ramon government finances - Cash and Securities in 2017 (per resident):
Bond Funds - Cash and Securities: $22,503,000 ($261.81)
Other Funds - Cash and Securities: $37,351,000 ($434.55)
Sinking Funds - Cash and Securities: $34,064,000 ($396.31)
6.37% of this county's 2021 resident taxpayers lived in other counties in 2020 ($134,084 average adjusted gross income )
Here:
6.37%California average:
5.19%
0.01% of residents moved from foreign countries ($98 average AGI )Contra Costa County:
0.01%California average:
0.03%
Top counties from which taxpayers relocated into this county between 2020 and 2021:
7.09% of this county's 2020 resident taxpayers moved to other counties in 2021 ($123,334 average adjusted gross income )
Here:
7.09%California average:
6.14%
0.01% of residents moved to foreign countries ($92 average AGI )Contra Costa County:
0.01%California average:
0.02%
Top counties to which taxpayers relocated from this county between 2020 and 2021:
Businesses in San Ramon, CA
Name Count Name Count
24 Hour Fitness 1 Homestead Studio Suites 1 7-Eleven 2 Jamba Juice 2 AT&T 1 Jones New York 1 Applebee's 1 KFC 1 Baja Fresh Mexican Grill 1 Marriott 2 Baskin-Robbins 1 MasterBrand Cabinets 4 Big O Tires 1 McDonald's 2 Blockbuster 2 Men's Wearhouse 1 Budget Car Rental 1 Nike 2 Burger King 1 Office Depot 1 CVS 3 Papa John's Pizza 1 Carl\s Jr. 1 Pizza Hut 1 Chipotle 1 RadioShack 1 Cold Stone Creamery 1 Rite Aid 1 Curves 1 Safeway 1 DHL 1 Staples 1 Dairy Queen 1 Starbucks 7 Discount Tire 1 Taco Bell 1 Domino's Pizza 1 Target 1 Extended Stay America 1 U-Haul 1 FedEx 12 UPS 18 GNC 1 Vons 2 GameStop 1 Walgreens 1 H&R Block 2 Whole Foods Market 1 Home Depot 1
Strongest AM radio stations in San Ramon:
KTCT (1050 AM; 50 kW; SAN MATEO, CA; Owner: SUSQUEHANNA RADIO CORP.)
KFAX (1100 AM; 50 kW; SAN FRANCISCO, CA; Owner: GOLDEN GATE BROADCASTING CO, INC.)
KGO (810 AM; 50 kW; SAN FRANCISCO, CA; Owner: KGO-AM RADIO, INC.)
KNBR (680 AM; 50 kW; SAN FRANCISCO, CA; Owner: KNBR LICO, INC.)
KTRB (860 AM; 50 kW; MODESTO, CA; Owner: PAPPAS RADIO OF CALIFORNIA, A CALIFORNIA LIMITED PARTNERSHIP)
KIQI (1010 AM; 35 kW; SAN FRANCISCO, CA; Owner: RADIO UNICA OF SAN FRANCISCO LICENSE CORP.)
KYCY (1550 AM; 50 kW; SAN FRANCISCO, CA; Owner: INFINITY BROADCASTING OPERATIONS, INC.)
KNEW (910 AM; 20 kW; OAKLAND, CA; Owner: AMFM RADIO LICENSES, L.L.C.)
KLOK (1170 AM; 50 kW; SAN JOSE, CA; Owner: ENTRAVISION HOLDINGS, LLC)
KCBS (740 AM; 50 kW; SAN FRANCISCO, CA; Owner: INFINITY BROADCASTING OPERATIONS, INC.)
KFRC (610 AM; 5 kW; SAN FRANCISCO, CA; Owner: INFINITY BROADCASTING CORPORATION OF LOS ANGELES)
KATD (990 AM; 10 kW; PITTSBURG, CA; Owner: RADIO UNICA OF SACRAMENTO LICENSE CORP.)
KCBC (770 AM; 50 kW; RIVERBANK, CA; Owner: KIERTRON, INC.)
Strongest FM radio stations in San Ramon:
KKSF-FM1 (103.7 FM; PLEASANTON, ETC., CA; Owner: AMFM RADIO LICENSES, L.L.C.)
KFRC-FM3 (99.7 FM; WALNUT CREEK, CA; Owner: INFINITY KFRC-FM, INC.)
KZBR-FM1 (95.7 FM; WALNUT CREEK, CA; Owner: BONNEVILLE HOLDING COMPANY)
KBLX-FM2 (102.9 FM; PLEASANTON, CA; Owner: ICBC BROADCAST HOLDINGS -CA, INC.)
KSOL-FM3 (98.9 FM; PLEASANTON, CA; Owner: TMS LICENSE CALIFORNIA, INC)
KISQ-FM3 (98.1 FM; CONCORD, CA; Owner: AMFM RADIO LICENSES, L.L.C.)
KMEL-FM1 (106.1 FM; CONCORD, CA; Owner: AMFM RADIO LICENSES, L.L.C.)
KZBR-FM2 (95.7 FM; LIVERMORE, ETC., CA; Owner: BONNEVILLE HOLDING COMPANY)
KFJO (92.1 FM; WALNUT CREEK, CA; Owner: CHASE RADIO PROPERTIES, L.L.C.)
KLLC (97.3 FM; SAN FRANCISCO, CA; Owner: INFINITY BROADCASTING OPERATIONS, INC.)
KDFC-FM1 (102.1 FM; LAFAYETTE, CA; Owner: BONNEVILLE HOLDING COMPANY)
KOIT-FM2 (96.5 FM; MARTINEZ, ETC., CA; Owner: BONNEVILLE HOLDING CO. C/O KOIT(FM))
KIOI-FM1 (101.3 FM; WALNUT CREEK, CA; Owner: AMFM RADIO LICENSES, L.L.C.)
K238AC (95.5 FM; SALIDA, CA; Owner: FAMILY STATIONS, INC.)
KBAA (94.5 FM; GILROY, CA; Owner: INFINITY RADIO OPERATIONS INC.)
KOIT-FM (96.5 FM; SAN FRANCISCO, CA; Owner: BONNEVILLE HOLDING COMPANY)
KKSF (103.7 FM; SAN FRANCISCO, CA; Owner: AMFM RADIO LICENSES, L.L.C.)
KFOG (104.5 FM; SAN FRANCISCO, CA; Owner: KFFG LICO, INC)
KFJC (89.7 FM; LOS ALTOS, CA; Owner: FOOTHILL-DE ANZA COMM. COLLEGE DIST.)
KSFB-FM (100.7 FM; SAN RAFAEL, CA; Owner: GOLDEN GATE BROADCASTING COMPANY, INC.)
TV broadcast stations around San Ramon:
KQED (Channel 9; SAN FRANCISCO, CA; Owner: KQED, INC.)
KGO-TV (Channel 7; SAN FRANCISCO, CA; Owner: KGO TELEVISION, INC.)
KPIX-TV (Channel 5; SAN FRANCISCO, CA; Owner: CBS BROADCASTING INC.)
KOVR (Channel 13; STOCKTON, CA; Owner: SCI - SACRAMENTO LICENSEE, LLC)
KXTV (Channel 10; SACRAMENTO, CA; Owner: KXTV, INC.)
KCRA-TV (Channel 3; SACRAMENTO, CA; Owner: KCRA HEARST-ARGYLE TELEVISION, INC.)
KSPX (Channel 29; SACRAMENTO, CA; Owner: PAXSON SACRAMENTO LICENSE, INC.)
KTVU (Channel 2; OAKLAND, CA; Owner: KTVU PARTNERSHIP)
KUVS (Channel 19; MODESTO, CA; Owner: KUVS LICENSE PARTNERSHIP, G.P.)
KTXL (Channel 40; SACRAMENTO, CA; Owner: CHANNEL 40, INC.)
KQCA (Channel 58; STOCKTON, CA; Owner: KCRA HEARST-ARGYLE TELEVISION, INC.)
KBIT-CA (Channel 28; SAN FRANCISCO, ETC., CA; Owner: POLAR BROADCASTING, INC.)
KVIE (Channel 6; SACRAMENTO, CA; Owner: KVIE, INC.)
KMAX-TV (Channel 31; SACRAMENTO, CA; Owner: UPN STATIONS GROUP INC.)
KRON-TV (Channel 4; SAN FRANCISCO, CA; Owner: YOUNG BROADCASTING OF SAN FRANCISCO, INC.)
KICU-TV (Channel 36; SAN JOSE, CA; Owner: KTVU PARTNERSHIP)
KFTL (Channel 64; STOCKTON, CA; Owner: FAMILY STATIONS, INC.)
KTNC-TV (Channel 42; CONCORD, CA; Owner: KTNC LICENSE, LLC)
KMTP-TV (Channel 32; SAN FRANCISCO, CA; Owner: MINORITY TELEVISION PROJECT)
KBHK-TV (Channel 44; SAN FRANCISCO, CA; Owner: VIACOM TELEVISION STATIONS GROUP OF SAN FRANCISCO INC.)
KBWB (Channel 20; SAN FRANCISCO, CA; Owner: KBWB LICENSE, INC.)
KFSF (Channel 66; VALLEJO, CA; Owner: TELEFUTURA SAN FRANCISCO LLC)
KTEH (Channel 54; SAN JOSE, CA; Owner: KTEH FOUNDATION)
KCNS (Channel 38; SAN FRANCISCO, CA; Owner: WRAY, INC.)
KDTV (Channel 14; SAN FRANCISCO, CA; Owner: KDTV LICENSE PARTNERSHIP, G.P.)
National Bridge Inventory (NBI) Statistics 40 Number of bridges469ft / 143m Total length $5,552,000 Total costs1,750,996 Total average daily traffic77,523 Total average daily truck traffic
New bridges - historical statistics
16 1960-1969 1 1980-1989 6 1990-1999 14 2000-2009 3 2010-2019
See full National Bridge Inventory statistics for San Ramon, CA
Home Mortgage Disclosure Act Aggregated Statistics For Year 2009(Based on 3 full and 5 partial tracts) A) FHA, FSA/RHS & VA B) Conventional C) Refinancings D) Home Improvement Loans F) Non-occupant Loans on Number Average Value Number Average Value Number Average Value Number Average Value Number Average Value
LOANS ORIGINATED 129 $438,838 381 $404,024 1,929 $360,394 60 $238,261 99 $284,539 APPLICATIONS APPROVED, NOT ACCEPTED 20 $368,934 51 $386,240 204 $410,389 6 $275,058 11 $272,195 APPLICATIONS DENIED 19 $412,979 77 $383,839 373 $428,601 18 $228,574 49 $265,772 APPLICATIONS WITHDRAWN 18 $409,071 60 $399,154 251 $395,402 15 $286,786 19 $236,676 FILES CLOSED FOR INCOMPLETENESS 3 $338,740 8 $407,914 85 $432,929 7 $132,880 4 $272,155
Aggregated Statistics For Year 2008(Based on 3 full and 5 partial tracts) A) FHA, FSA/RHS & VA B) Conventional C) Refinancings D) Home Improvement Loans E) Loans on Dwellings For 5+ Families F) Non-occupant Loans on Number Average Value Number Average Value Number Average Value Number Average Value Number Average Value Number Average Value
LOANS ORIGINATED 28 $576,384 448 $425,105 640 $391,859 51 $204,161 0 $0 94 $304,883 APPLICATIONS APPROVED, NOT ACCEPTED 6 $371,437 84 $467,167 137 $405,358 13 $177,264 0 $0 17 $298,425 APPLICATIONS DENIED 8 $473,838 106 $500,216 263 $470,843 41 $264,390 0 $0 19 $330,991 APPLICATIONS WITHDRAWN 6 $396,885 63 $474,996 119 $417,512 19 $162,522 1 $315,800 12 $315,404 FILES CLOSED FOR INCOMPLETENESS 1 $637,000 14 $533,851 63 $442,361 7 $185,837 0 $0 7 $329,079
Aggregated Statistics For Year 2007(Based on 3 full and 5 partial tracts) A) FHA, FSA/RHS & VA B) Conventional C) Refinancings D) Home Improvement Loans E) Loans on Dwellings For 5+ Families F) Non-occupant Loans on G) Loans On Manufactured Number Average Value Number Average Value Number Average Value Number Average Value Number Average Value Number Average Value Number Average Value
LOANS ORIGINATED 0 $0 734 $443,241 985 $450,390 94 $249,377 2 $8,788,050 118 $370,476 2 $52,405 APPLICATIONS APPROVED, NOT ACCEPTED 0 $0 172 $461,102 230 $476,213 26 $221,887 0 $0 21 $406,381 1 $95,000 APPLICATIONS DENIED 0 $0 175 $434,416 362 $500,674 54 $253,439 0 $0 29 $371,241 0 $0 APPLICATIONS WITHDRAWN 1 $312,330 79 $458,040 143 $447,164 21 $199,204 0 $0 12 $397,767 0 $0 FILES CLOSED FOR INCOMPLETENESS 0 $0 30 $486,559 68 $476,937 8 $287,751 0 $0 6 $346,540 0 $0
Aggregated Statistics For Year 2006(Based on 3 full and 5 partial tracts) A) FHA, FSA/RHS & VA B) Conventional C) Refinancings D) Home Improvement Loans E) Loans on Dwellings For 5+ Families F) Non-occupant Loans on G) Loans On Manufactured Number Average Value Number Average Value Number Average Value Number Average Value Number Average Value Number Average Value Number Average Value
LOANS ORIGINATED 1 $129,400 1,338 $416,804 1,160 $464,531 150 $270,613 1 $32,200,000 178 $337,731 0 $0 APPLICATIONS APPROVED, NOT ACCEPTED 1 $146,860 296 $369,600 199 $456,295 23 $340,270 0 $0 39 $364,472 1 $43,130 APPLICATIONS DENIED 0 $0 303 $422,498 312 $506,891 67 $216,183 0 $0 40 $354,844 0 $0 APPLICATIONS WITHDRAWN 0 $0 200 $431,870 211 $481,061 25 $234,700 1 $118,110 26 $329,326 0 $0 FILES CLOSED FOR INCOMPLETENESS 0 $0 25 $491,172 60 $482,277 8 $153,886 0 $0 7 $396,821 0 $0
Aggregated Statistics For Year 2005(Based on 3 full and 5 partial tracts) B) Conventional C) Refinancings D) Home Improvement Loans E) Loans on Dwellings For 5+ Families F) Non-occupant Loans on G) Loans On Manufactured Number Average Value Number Average Value Number Average Value Number Average Value Number Average Value Number Average Value
LOANS ORIGINATED 1,236 $543,049 1,659 $467,336 179 $331,481 1 $9,504,370 158 $376,205 1 $70,430 APPLICATIONS APPROVED, NOT ACCEPTED 197 $559,300 240 $435,785 16 $355,721 0 $0 24 $378,072 1 $162,220 APPLICATIONS DENIED 251 $531,628 326 $478,804 53 $256,729 0 $0 38 $413,802 0 $0 APPLICATIONS WITHDRAWN 161 $566,707 288 $419,643 50 $274,189 0 $0 22 $343,815 1 $195,130 FILES CLOSED FOR INCOMPLETENESS 32 $458,174 79 $435,288 10 $173,943 0 $0 9 $388,613 0 $0
Aggregated Statistics For Year 2004(Based on 3 full and 5 partial tracts) B) Conventional C) Refinancings D) Home Improvement Loans E) Loans on Dwellings For 5+ Families F) Non-occupant Loans on G) Loans On Manufactured Number Average Value Number Average Value Number Average Value Number Average Value Number Average Value Number Average Value
LOANS ORIGINATED 1,496 $467,806 2,420 $392,374 141 $286,399 1 $12,632,100 199 $309,417 2 $74,260 APPLICATIONS APPROVED, NOT ACCEPTED 251 $494,273 336 $399,626 14 $214,051 0 $0 31 $295,256 1 $68,000 APPLICATIONS DENIED 277 $507,482 392 $401,736 53 $166,494 0 $0 45 $339,309 0 $0 APPLICATIONS WITHDRAWN 236 $495,915 339 $392,331 25 $233,450 1 $17,101,900 21 $368,294 1 $495,060 FILES CLOSED FOR INCOMPLETENESS 30 $506,922 71 $394,596 4 $119,188 0 $0 6 $337,118 0 $0
Aggregated Statistics For Year 2003(Based on 3 full and 5 partial tracts) A) FHA, FSA/RHS & VA B) Conventional C) Refinancings D) Home Improvement Loans F) Non-occupant Loans on Number Average Value Number Average Value Number Average Value Number Average Value Number Average Value
LOANS ORIGINATED 2 $270,500 1,530 $407,195 5,264 $314,718 48 $106,177 258 $242,331 APPLICATIONS APPROVED, NOT ACCEPTED 0 $0 226 $415,833 620 $329,729 12 $54,805 39 $267,795 APPLICATIONS DENIED 0 $0 235 $412,278 553 $351,959 37 $61,539 26 $280,868 APPLICATIONS WITHDRAWN 1 $102,700 285 $415,499 618 $322,513 10 $95,561 35 $269,124 FILES CLOSED FOR INCOMPLETENESS 0 $0 33 $443,001 152 $369,781 4 $65,620 10 $229,523
Aggregated Statistics For Year 2002(Based on 3 full and 4 partial tracts) A) FHA, FSA/RHS & VA B) Conventional C) Refinancings D) Home Improvement Loans E) Loans on Dwellings For 5+ Families F) Non-occupant Loans on Number Average Value Number Average Value Number Average Value Number Average Value Number Average Value Number Average Value
LOANS ORIGINATED 3 $244,957 1,292 $371,746 4,116 $308,501 52 $89,471 1 $159,700 193 $234,437 APPLICATIONS APPROVED, NOT ACCEPTED 2 $98,215 142 $397,527 495 $321,484 11 $134,197 0 $0 22 $207,230 APPLICATIONS DENIED 1 $188,970 128 $321,907 362 $330,477 30 $75,317 0 $0 23 $263,411 APPLICATIONS WITHDRAWN 0 $0 124 $356,547 449 $325,838 11 $121,875 0 $0 19 $271,328 FILES CLOSED FOR INCOMPLETENESS 0 $0 44 $455,964 121 $329,766 3 $62,523 0 $0 7 $255,977
Aggregated Statistics For Year 2001(Based on 3 full and 4 partial tracts) A) FHA, FSA/RHS & VA B) Conventional C) Refinancings D) Home Improvement Loans E) Loans on Dwellings For 5+ Families F) Non-occupant Loans on Number Average Value Number Average Value Number Average Value Number Average Value Number Average Value Number Average Value
LOANS ORIGINATED 12 $210,630 880 $334,006 2,720 $297,539 127 $59,244 0 $0 112 $243,004 APPLICATIONS APPROVED, NOT ACCEPTED 0 $0 114 $361,413 330 $289,019 32 $74,547 1 $324,040 8 $214,269 APPLICATIONS DENIED 0 $0 107 $398,096 328 $306,197 44 $57,139 0 $0 14 $257,054 APPLICATIONS WITHDRAWN 1 $217,000 108 $286,496 369 $285,001 18 $61,917 0 $0 12 $196,787 FILES CLOSED FOR INCOMPLETENESS 0 $0 34 $329,761 123 $306,816 5 $105,778 0 $0 3 $373,763
Aggregated Statistics For Year 2000(Based on 3 full and 4 partial tracts) A) FHA, FSA/RHS & VA B) Conventional C) Refinancings D) Home Improvement Loans F) Non-occupant Loans on Number Average Value Number Average Value Number Average Value Number Average Value Number Average Value
LOANS ORIGINATED 5 $198,232 1,202 $295,969 589 $220,539 135 $45,318 85 $201,497 APPLICATIONS APPROVED, NOT ACCEPTED 1 $275,260 144 $270,650 88 $202,314 20 $62,884 8 $243,815 APPLICATIONS DENIED 1 $99,620 145 $276,067 153 $220,454 36 $54,879 14 $174,556 APPLICATIONS WITHDRAWN 1 $104,240 122 $258,771 122 $173,498 24 $57,514 9 $177,248 FILES CLOSED FOR INCOMPLETENESS 0 $0 36 $311,618 67 $281,557 1 $52,970 5 $225,828
Aggregated Statistics For Year 1999(Based on 3 full and 5 partial tracts) A) FHA, FSA/RHS & VA B) Conventional C) Refinancings D) Home Improvement Loans E) Loans on Dwellings For 5+ Families F) Non-occupant Loans on Number Average Value Number Average Value Number Average Value Number Average Value Number Average Value Number Average Value
LOANS ORIGINATED 9 $161,650 1,074 $241,809 1,245 $218,705 102 $37,610 1 $1,018,980 88 $171,483 APPLICATIONS APPROVED, NOT ACCEPTED 0 $0 90 $251,640 171 $197,639 26 $39,220 0 $0 13 $133,457 APPLICATIONS DENIED 0 $0 118 $244,493 205 $207,493 32 $30,758 0 $0 14 $159,053 APPLICATIONS WITHDRAWN 4 $154,288 123 $245,451 174 $182,099 7 $72,053 0 $0 10 $166,153 FILES CLOSED FOR INCOMPLETENESS 0 $0 35 $227,461 93 $231,618 2 $47,755 0 $0 5 $161,724
Detailed HMDA statistics for the following Tracts:
3451.01
, 3451.02 , 3451.03 , 3451.07 , 3451.08 , 3451.09 , 3451.10 , 3452.02
Private Mortgage Insurance Companies Aggregated Statistics For Year 2009(Based on 3 full and 5 partial tracts) A) Conventional B) Refinancings C) Non-occupant Loans on Number Average Value Number Average Value Number Average Value
LOANS ORIGINATED 24 $371,302 4 $517,290 0 $0 APPLICATIONS APPROVED, NOT ACCEPTED 12 $405,508 4 $458,770 1 $387,000 APPLICATIONS DENIED 8 $389,328 2 $370,050 0 $0 APPLICATIONS WITHDRAWN 6 $396,503 1 $554,460 0 $0 FILES CLOSED FOR INCOMPLETENESS 2 $351,335 0 $0 0 $0
Aggregated Statistics For Year 2008(Based on 3 full and 5 partial tracts) A) Conventional B) Refinancings C) Non-occupant Loans on Number Average Value Number Average Value Number Average Value
LOANS ORIGINATED 43 $390,301 6 $401,503 4 $300,518 APPLICATIONS APPROVED, NOT ACCEPTED 12 $402,068 8 $476,785 0 $0 APPLICATIONS DENIED 5 $440,588 1 $610,000 1 $346,540 APPLICATIONS WITHDRAWN 5 $478,124 1 $436,990 1 $374,860 FILES CLOSED FOR INCOMPLETENESS 1 $39,030 0 $0 1 $39,030
Aggregated Statistics For Year 2007(Based on 2 full and 5 partial tracts) A) Conventional B) Refinancings C) Non-occupant Loans on Number Average Value Number Average Value Number Average Value
LOANS ORIGINATED 13 $426,559 10 $446,144 1 $271,830 APPLICATIONS APPROVED, NOT ACCEPTED 2 $237,750 4 $533,425 1 $136,080 APPLICATIONS DENIED 4 $695,710 5 $715,200 4 $686,570 APPLICATIONS WITHDRAWN 0 $0 2 $620,500 0 $0 FILES CLOSED FOR INCOMPLETENESS 0 $0 0 $0 0 $0
Aggregated Statistics For Year 2006(Based on 2 full and 3 partial tracts) A) Conventional B) Refinancings C) Non-occupant Loans on Number Average Value Number Average Value Number Average Value
LOANS ORIGINATED 10 $431,179 2 $596,485 1 $334,800 APPLICATIONS APPROVED, NOT ACCEPTED 3 $328,433 1 $494,980 1 $327,640 APPLICATIONS DENIED 0 $0 0 $0 0 $0 APPLICATIONS WITHDRAWN 0 $0 0 $0 0 $0 FILES CLOSED FOR INCOMPLETENESS 0 $0 0 $0 0 $0
Aggregated Statistics For Year 2005(Based on 2 full and 5 partial tracts) A) Conventional B) Refinancings C) Non-occupant Loans on Number Average Value Number Average Value Number Average Value
LOANS ORIGINATED 7 $449,890 3 $406,177 1 $248,000 APPLICATIONS APPROVED, NOT ACCEPTED 6 $318,882 1 $286,660 2 $376,500 APPLICATIONS DENIED 0 $0 0 $0 0 $0 APPLICATIONS WITHDRAWN 2 $518,500 0 $0 1 $493,000 FILES CLOSED FOR INCOMPLETENESS 1 $644,000 0 $0 0 $0
Aggregated Statistics For Year 2004(Based on 2 full and 5 partial tracts) A) Conventional B) Refinancings C) Non-occupant Loans on Number Average Value Number Average Value Number Average Value
LOANS ORIGINATED 12 $397,161 6 $325,482 1 $396,000 APPLICATIONS APPROVED, NOT ACCEPTED 4 $398,118 4 $470,442 1 $231,080 APPLICATIONS DENIED 1 $558,800 0 $0 0 $0 APPLICATIONS WITHDRAWN 0 $0 0 $0 0 $0 FILES CLOSED FOR INCOMPLETENESS 0 $0 0 $0 0 $0
Aggregated Statistics For Year 2003(Based on 3 full and 5 partial tracts) A) Conventional B) Refinancings C) Non-occupant Loans on Number Average Value Number Average Value Number Average Value
LOANS ORIGINATED 22 $358,267 13 $326,309 1 $228,630 APPLICATIONS APPROVED, NOT ACCEPTED 4 $391,962 5 $410,734 0 $0 APPLICATIONS DENIED 0 $0 0 $0 0 $0 APPLICATIONS WITHDRAWN 1 $549,960 2 $381,895 0 $0 FILES CLOSED FOR INCOMPLETENESS 0 $0 0 $0 0 $0
Aggregated Statistics For Year 2002(Based on 3 full and 4 partial tracts) A) Conventional B) Refinancings C) Non-occupant Loans on Number Average Value Number Average Value Number Average Value
LOANS ORIGINATED 34 $332,956 12 $343,945 1 $242,690 APPLICATIONS APPROVED, NOT ACCEPTED 6 $312,047 8 $351,419 1 $182,810 APPLICATIONS DENIED 2 $389,855 1 $449,000 0 $0 APPLICATIONS WITHDRAWN 1 $399,220 2 $320,000 0 $0 FILES CLOSED FOR INCOMPLETENESS 0 $0 0 $0 0 $0
Aggregated Statistics For Year 2001(Based on 3 full and 4 partial tracts) A) Conventional B) Refinancings C) Non-occupant Loans on Number Average Value Number Average Value Number Average Value
LOANS ORIGINATED 25 $336,543 10 $413,148 1 $182,810 APPLICATIONS APPROVED, NOT ACCEPTED 8 $481,914 4 $285,600 1 $253,000 APPLICATIONS DENIED 2 $594,065 1 $336,980 0 $0 APPLICATIONS WITHDRAWN 0 $0 0 $0 0 $0 FILES CLOSED FOR INCOMPLETENESS 2 $517,075 0 $0 0 $0
Aggregated Statistics For Year 2000(Based on 3 full and 4 partial tracts) A) Conventional B) Refinancings C) Non-occupant Loans on Number Average Value Number Average Value Number Average Value
LOANS ORIGINATED 66 $311,640 17 $324,942 1 $245,960 APPLICATIONS APPROVED, NOT ACCEPTED 15 $296,567 4 $318,810 0 $0 APPLICATIONS DENIED 2 $345,090 0 $0 0 $0 APPLICATIONS WITHDRAWN 3 $364,040 1 $198,020 0 $0 FILES CLOSED FOR INCOMPLETENESS 0 $0 0 $0 0 $0
Aggregated Statistics For Year 1999(Based on 3 full and 5 partial tracts) A) Conventional B) Refinancings C) Non-occupant Loans on Number Average Value Number Average Value Number Average Value
LOANS ORIGINATED 87 $263,379 26 $242,229 2 $147,575 APPLICATIONS APPROVED, NOT ACCEPTED 11 $324,894 8 $243,928 2 $154,580 APPLICATIONS DENIED 0 $0 1 $169,300 1 $169,300 APPLICATIONS WITHDRAWN 3 $243,290 0 $0 0 $0 FILES CLOSED FOR INCOMPLETENESS 2 $191,465 2 $290,340 1 $169,300
Detailed PMIC statistics for the following Tracts:
3451.01
, 3451.02 , 3451.03 , 3451.07 , 3451.08 , 3451.09 , 3451.10 , 3452.02 Fire-safe hotels and motels in San Ramon, California:
San Ramon Marriott Hotel At Bishop Ranch, 2600 Bishop Dr, San Ramon, California 94583 Phone: (510) 867-9200, Fax: (510) 830-9326
Residence Inn By Marriott, 1071 Market PL, San Ramon, California 94583 Phone: (510) 277-9292, Fax: (510) 277-0687
Extended Stay America - San Ramon - Bishop Ranch - West, 18000 San Ramon Valley Blvd, San Ramon, California 94583 Phone: (925) 277-0833, Fax: (925) 277-0881
Extended Stay America - San Ramon - Bishop Ranch - East, 2100 Camino Ramon, San Ramon, California 94583 Phone: (925) 242-0991, Fax: (925) 242-0992
Suiteamerica At Archstone San Ramon, 205 Reflections Dr, San Ramon, California 94583 Phone: (925) 867-3737
Hotel Sierra San Ramon, 2323 San Ramon Valley Blvd, San Ramon, California 94583 Phone: (925) 743-1882, Fax: (925) 743-1784
All 6 fire-safe hotels and motels in San Ramon, California
Most common first names in San Ramon, CA among deceased individuals Name Count Lived (average)
John 72 75.7 years Robert 69 70.5 years William 68 74.3 years Mary 64 82.5 years James 54 73.2 years Dorothy 45 83.3 years Helen 45 83.5 years George 44 75.3 years Charles 43 76.5 years Frank 39 77.1 years
Most common last names in San Ramon, CA among deceased individuals Last name Count Lived (average)
Smith 23 76.0 years Johnson 20 78.6 years Nelson 15 75.3 years Miller 15 83.3 years Brown 14 78.5 years Martin 13 77.1 years Anderson 10 81.5 years Young 9 74.7 years Perry 9 78.8 years Taylor 9 72.5 years
San Ramon compared to California state average:
Median household income above state average. Median house value above state average. Unemployed percentage significantly below state average. Hispanic race population percentage below state average. Median age above state average. Foreign-born population percentage significantly above state average. Renting percentage below state average. Number of rooms per house above state average. House age significantly below state average. Percentage of population with a bachelor's degree or higher significantly above state average.
#3 on the list of "Top 100 cities with highest median household income (pop. 50,000+)"
#4 on the list of "Top 101 cities with largest percentage of males in industries: utilities (population 50,000+)"
#6 on the list of "Top 101 cities with the lowest number of police officers per 1000 residents (population 50,000+)"
#6 on the list of "Top 101 cities with the lowest percentage of single-parent households, population 50,000+"
#7 on the list of "Top 101 cities with largest percentage of females in occupations: computer and mathematical occupations (population 50,000+)"
#11 on the list of "Top 101 cities with largest percentage of females in occupations: life, physical, and social science occupations (population 50,000+)"
#13 on the list of "Top 101 cities with largest percentage of females in occupations: health diagnosing and treating practitioners and other technical occupations (population 50,000+)"
#14 on the list of "Top 101 cities with largest percentage of males in occupations: architecture and engineering occupations (population 50,000+)"
#14 on the list of "Top 101 cities with largest percentage of females in industries: information (population 50,000+)"
#16 on the list of "Top 101 cities with largest percentage of males in occupations: computer and mathematical occupations (population 50,000+)"
#18 on the list of "Top 101 cities with the lowest number of assaults per 100,000 residents (population 50,000+)"
#19 on the list of "Top 100 best educated cities (highest percentage of bachelor degree holding residents) (pop. 50,000+)"
#22 on the list of "Top 100 cities with highest median house value (pop. 50,000+)"
#22 on the list of "Top 101 cities with largest percentage of females in industries: wholesale trade (population 50,000+)"
#23 on the list of "Top 101 cities with the least people below the poverty level (population 50,000+)"
#23 on the list of "Top 101 cities with the least people below 50% of the poverty level (population 50,000+)"
#31 on the list of "Top 101 cities with largest percentage of males in industries: professional, scientific, and technical services (population 50,000+)"
#35 on the list of "Top 101 cities with the largest differences between morning and afternoon humidity (population 50,000+)"
#35 on the list of "Top 101 cities with the largest humidity differences during a year (population 50,000+)"
#35 on the list of "Top 101 cities with largest percentage of females in industries: manufacturing (population 50,000+)"
#69 (94583) on the list of "Top 101 zip codes with the most finance and insurance companies in 2005"
#10 on the list of "Top 101 counties with the largest increase in the number of infant deaths per 1000 residents 2000-2006 to 2007-2013 (pop. 50,000+)"
#15 on the list of "Top 101 counties with the lowest Sulfur Oxides Annual air pollution readings in 2012 (µg/m3 )"
#17 on the list of "Top 101 counties with the highest Nitrogen Dioxide air pollution readings in 2012 (ppm)"
#31 on the list of "Top 101 counties with the highest percentage of residents that drank alcohol in the past 30 days"
#34 on the list of "Top 101 counties with the highest surface withdrawal of fresh water for public supply (pop. 50,000+)"
Top Patent Applicants
Qinghua Li (219)
Lalit R. Kotecha (191)
Liwen Chu (87)
Michael A. Leabman (72)
James Fan (71)
Yi Wang (63)
Gloria Lin (61)
Yi Zheng (56)
Ali Sajassi (55)
Seungpil Lee (49)
Total of 6991 patent applications in 2008-2024.
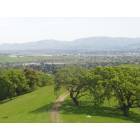
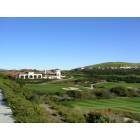
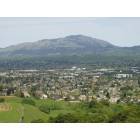

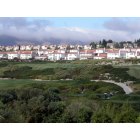
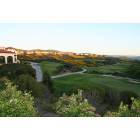
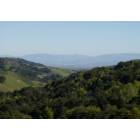
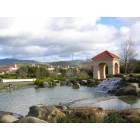
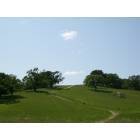


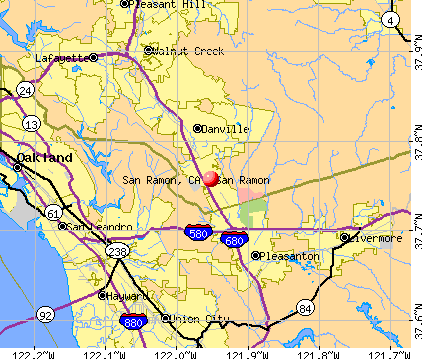


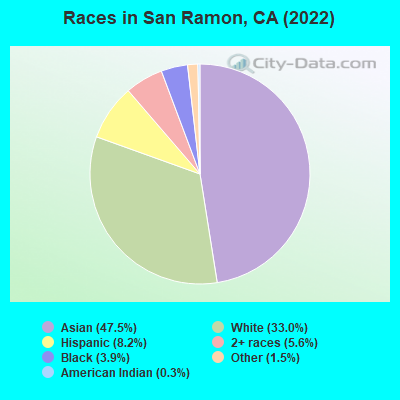
 Recent articles from our blog. Our writers, many of them Ph.D. graduates or candidates, create easy-to-read articles on a wide variety of topics.


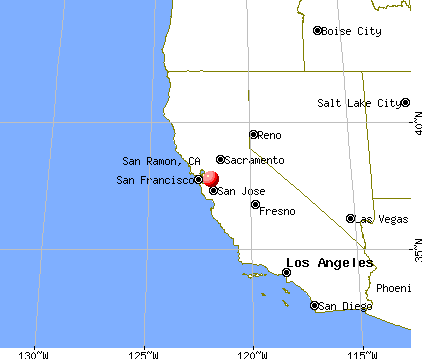
 (7.0 miles
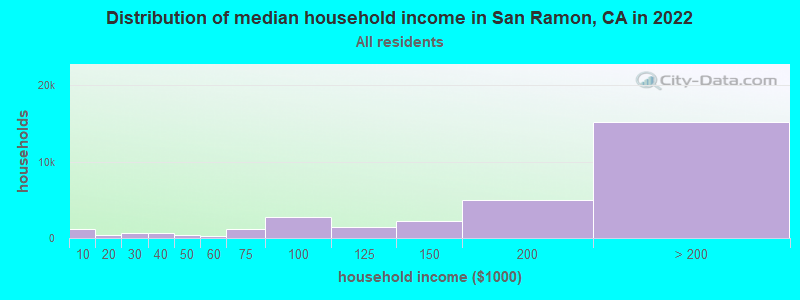
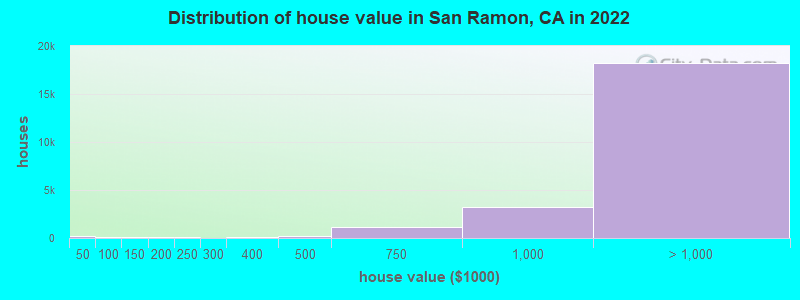
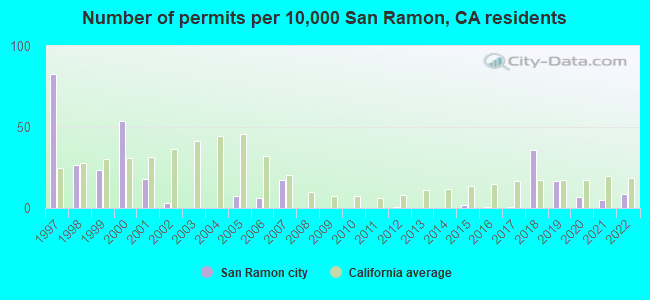
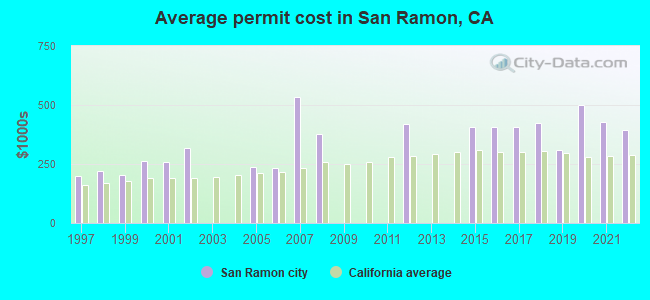
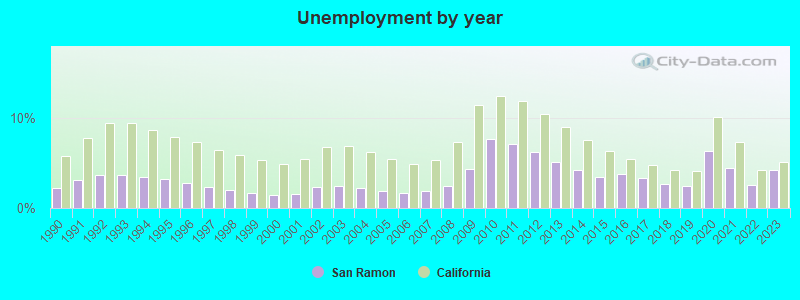
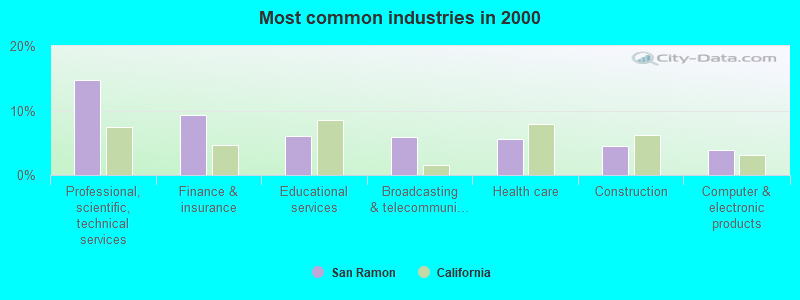
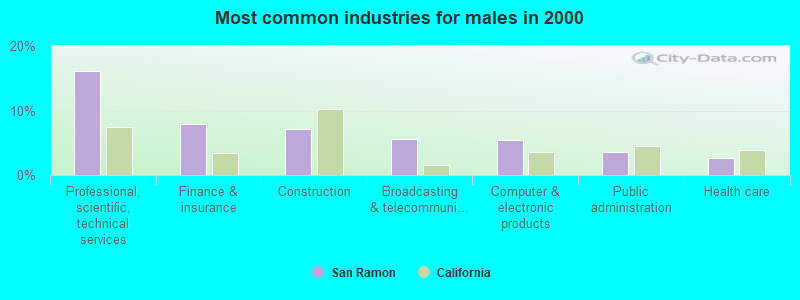
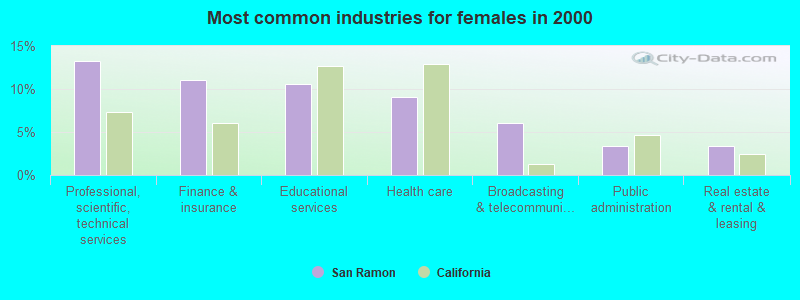

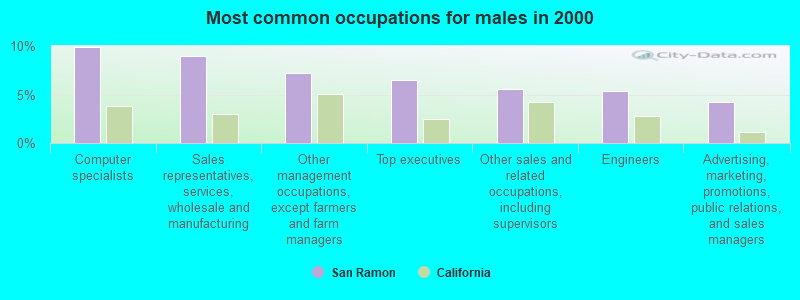
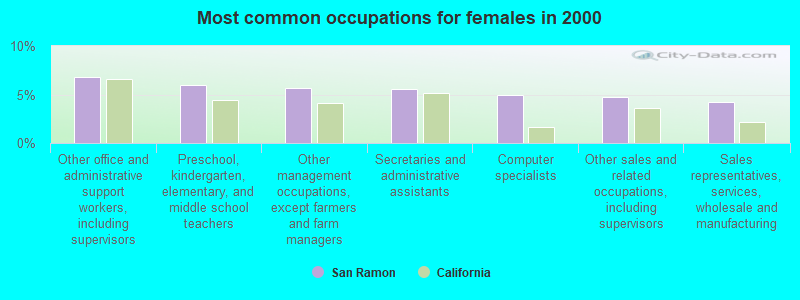
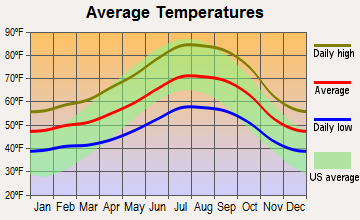
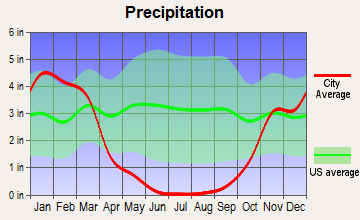
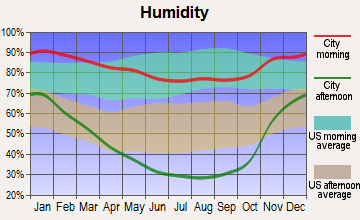
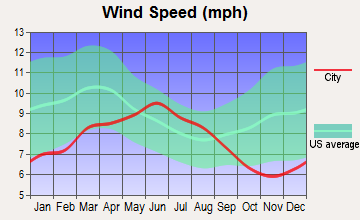
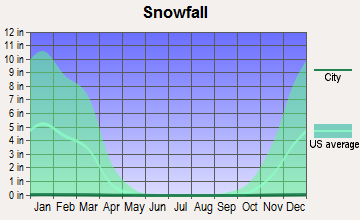
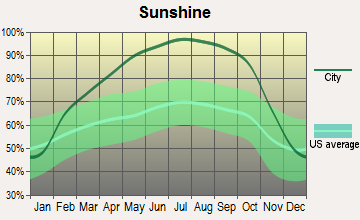
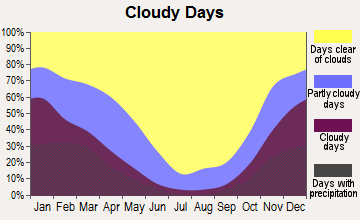
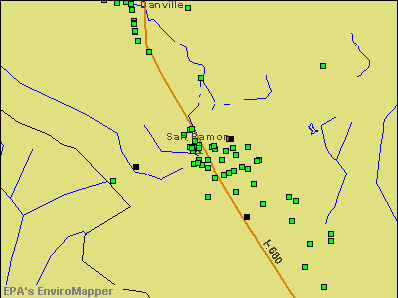

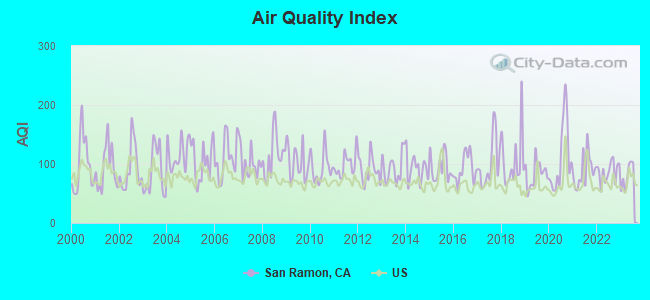
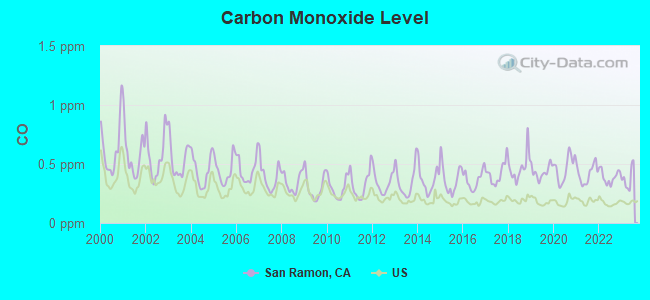
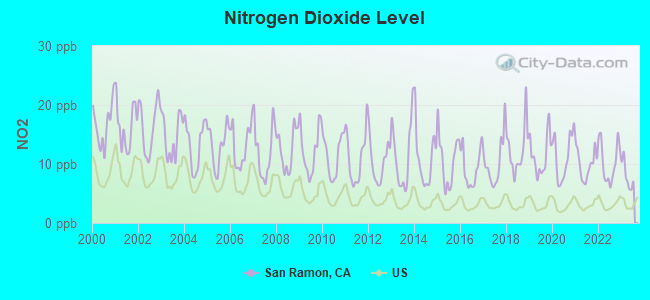
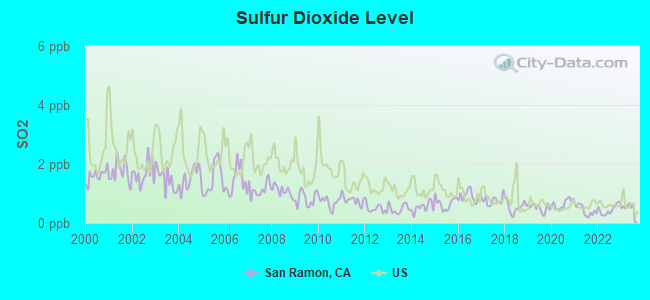
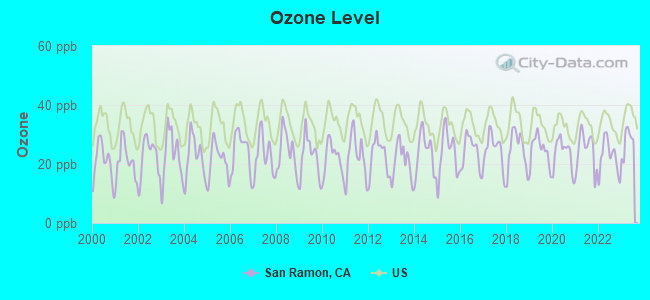
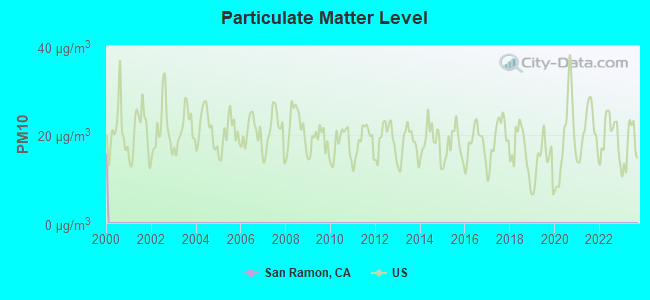
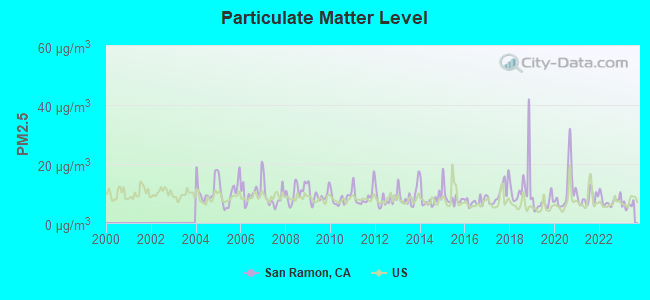
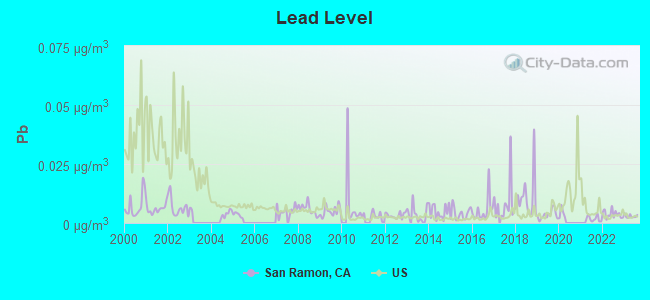
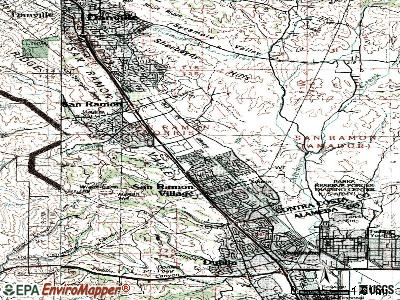
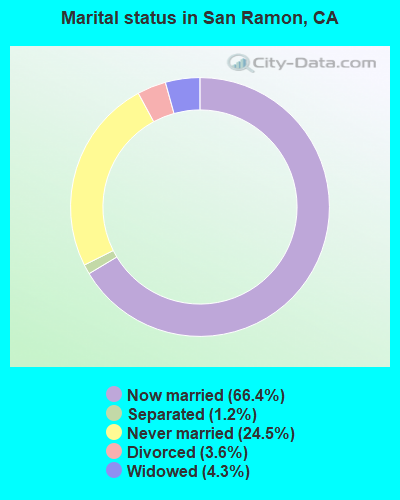
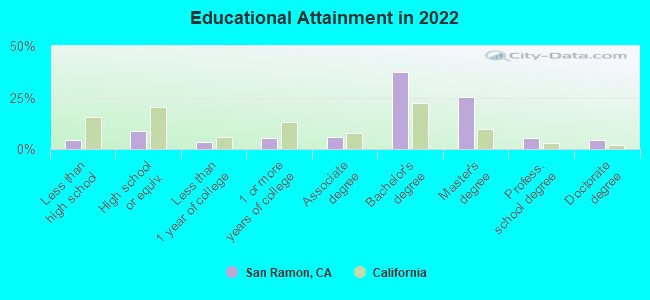
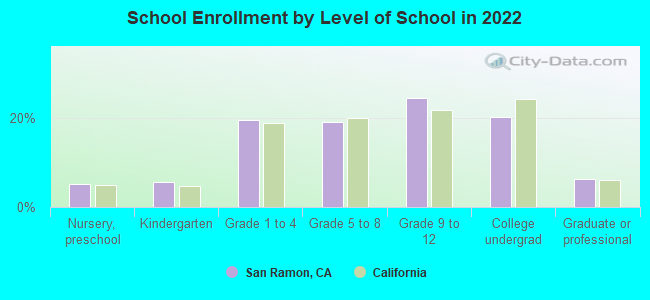
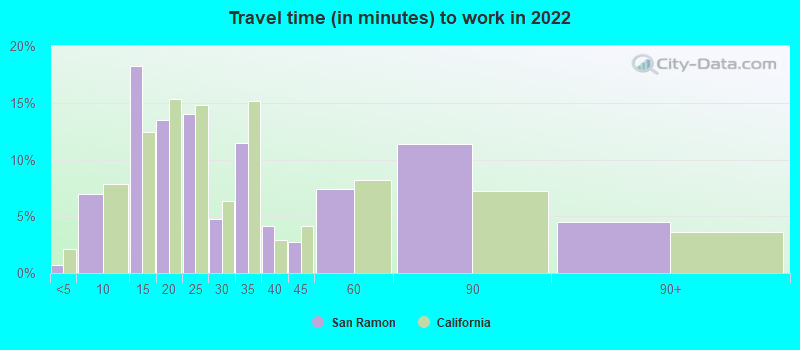
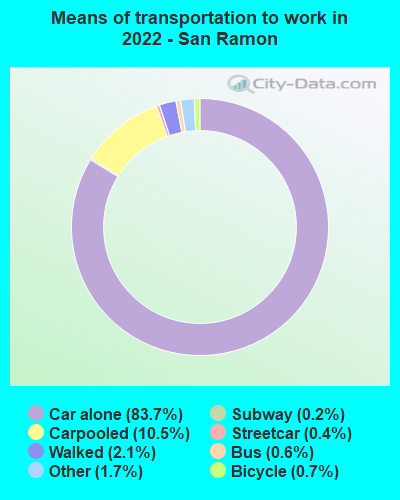


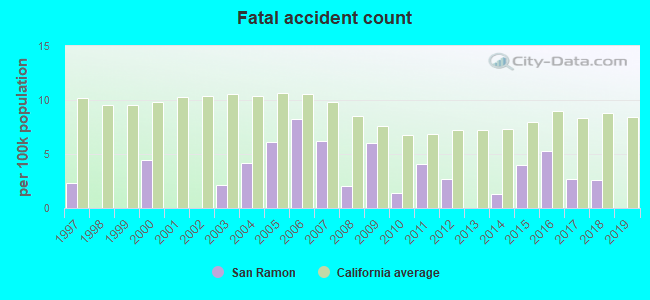
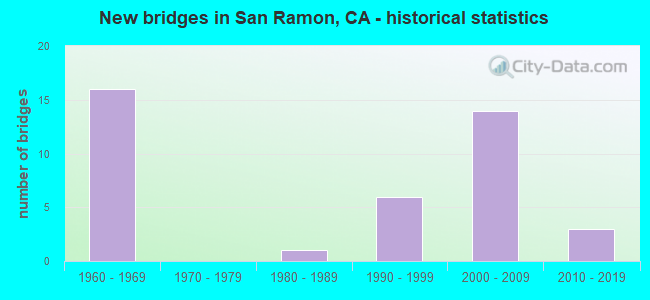
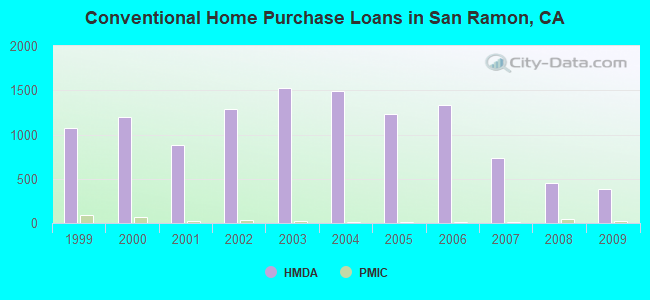
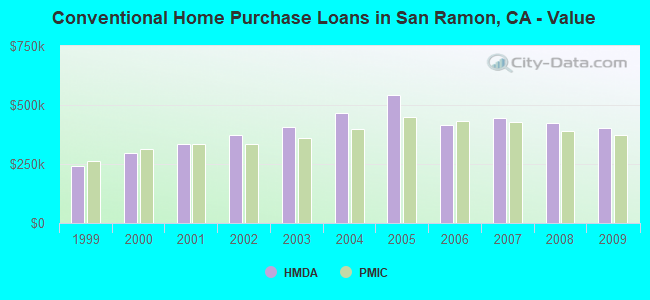
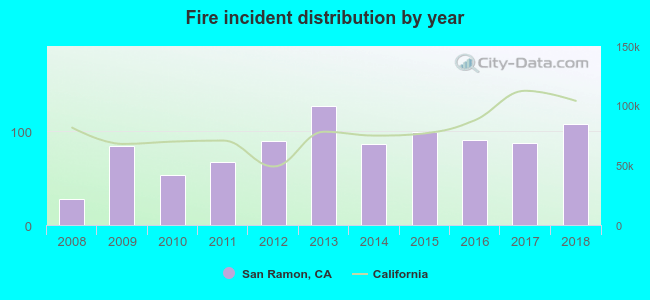 Based on the data from the years 2008 - 2018 the average number of fire incidents per year is 83. The highest number of fire incidents - 127 took place in 2013, and the least - 28 in 2008. The data has a rising trend.
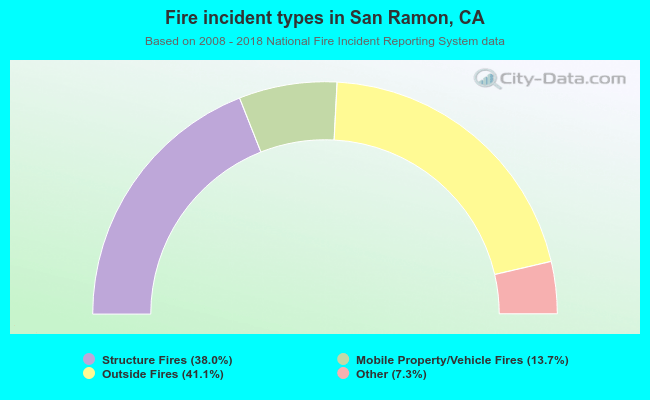 When looking into fire subcategories, the most incidents belonged to: Outside Fires (41.1%), and Structure Fires (38.0%).