Santa Clara, California
Santa Clara: Paramount's Great America , Raiders of The Lost Ark

Santa Clara: Paramount's Great America, Stardate 2765.776
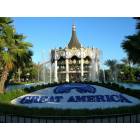
Santa Clara: Paramount's Great America
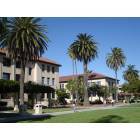
Santa Clara: Santa Clara University - Santa Clara, CA
Santa Clara: Our Friendly Neighbors - The 49ers!!!

Santa Clara: Tree Lined Trolly Line down Tasman Dr. Santa Clara
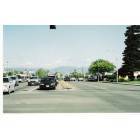
Santa Clara: El Camino Real,Santa Clara
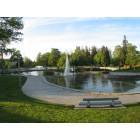
Santa Clara: Central Park on Kiely

Santa Clara: Santa Clara University - Santa Clara, CA
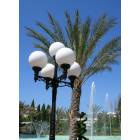
Santa Clara: Paramount's Great America , Lamps and Trees
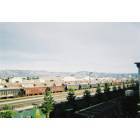
Santa Clara: Santa Clara depot facing the hills
Santa Clara: Santa Clara University
- add
your


Submit your own pictures of this city and show them to the world
- OSM Map
- General Map
- Google Map
- MSN Map
Population change since 2000: +24.0%
 |
| Males: 66,555 | |
| Females: 60,375 |
| Median resident age: | 34.8 years |
| California median age: | 37.9 years |
Zip codes: 95053.
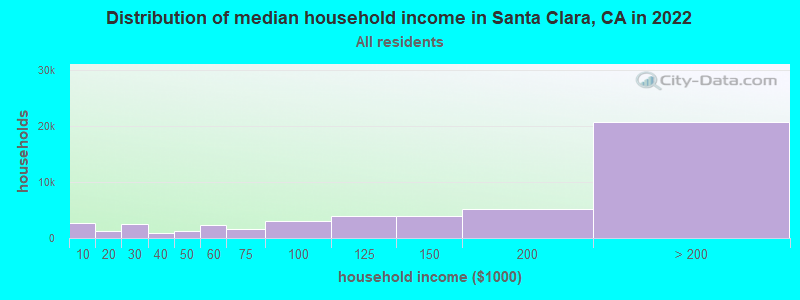
| Santa Clara: | $158,614 |
| CA: | $91,551 |
Estimated per capita income in 2022: $80,283 (it was $31,755 in 2000)
Santa Clara city income, earnings, and wages data
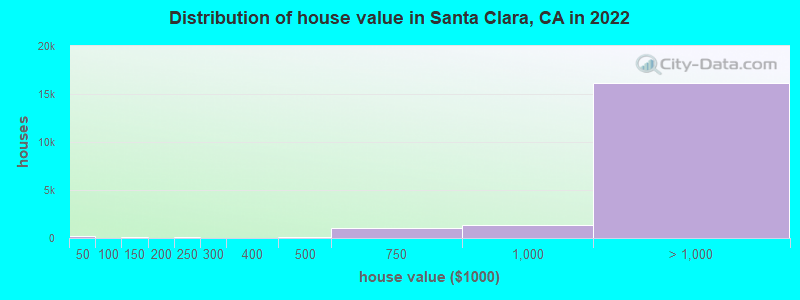
Estimated median house or condo value in 2022: over $1,000,000 (it was $387,000 in 2000)
| Santa Clara: | over $1,000,000 |
| CA: | $715,900 |
Mean prices in 2022: all housing units: over $1,000,000; detached houses: over $1,000,000; townhouses or other attached units: over $1,000,000; in 2-unit structures: over $1,000,000; in 3-to-4-unit structures: over $1,000,000; in 5-or-more-unit structures: over $1,000,000
Median gross rent in 2022: $2,807.
(7.2% for White Non-Hispanic residents, 10.9% for Black residents, 12.5% for Hispanic or Latino residents, 9.4% for American Indian residents, 8.8% for Native Hawaiian and other Pacific Islander residents, 18.0% for other race residents, 8.6% for two or more races residents)
Detailed information about poverty and poor residents in Santa Clara, CA


Compare current foreclosures in Santa Clara, CA:
| Photo | Address | Area | Beds / Baths | Price | Details |
|---|---|---|---|---|---|

|
#1
Francis Ave
Santa Clara, CA 95051
|
1,383 sq. feet
|
2 baths 4 beds |
show details | |

|
#2
Flannery St
Santa Clara, CA 95051
|
1,396 sq. feet
|
2 baths 4 beds |
show details | |

|
#3
Las Palmas Dr
Santa Clara, CA 95051
|
1,278 sq. feet
|
2 baths 3 beds |
show details | |

|
#4
Sawyer Ct
Santa Clara, CA 95054
|
2,107 sq. feet
|
2 baths 4 beds |
show details | |

|
#5
Michele Jean Way
Santa Clara, CA 95050
|
1,872 sq. feet
|
2 baths 2 beds |
show details | |

|
#6
Armour Dr
Santa Clara, CA 95054
|
1,095 sq. feet
|
2 baths 3 beds |
show details | |

|
#7
Leith Ave
Santa Clara, CA 95054
|
1,625 sq. feet
|
2 baths 3 beds |
show details | |

|
#8
Saint Lawrence Dr
Santa Clara, CA 95051
|
1,571 sq. feet
|
2 baths 3 beds |
show details | |

|
#9
Benton St
Santa Clara, CA 95051
|
1,564 sq. feet
|
2 baths 4 beds |
show details | |

|
#10
Cabrillo Ave
Santa Clara, CA 95050
|
1,368 sq. feet
|
2 baths 3 beds |
show details |
| Photo | Address | Area | Beds / Baths | Price | Details |
|---|---|---|---|---|---|

|
#11
Monroe St # 907
Santa Clara, CA 95050
|
853 sq. feet
|
1 baths 2 beds |
show details | |

|
#12
Wilcox Ave
Santa Clara, CA 95054
|
1,599 sq. feet
|
2 baths 3 beds |
show details | |

|
#13
Calle De Escuela
Santa Clara, CA 95054
|
1,108 sq. feet
|
1 baths 2 beds |
show details | |

|
#14
Monroe St
Santa Clara, CA 95050
|
2,667 sq. feet
|
1 baths 3 beds |
show details | |

|
#15
Bowers Ave
Santa Clara, CA 95051
|
1,158 sq. feet
|
2 baths 4 beds |
show details | |

|
#16
Butcher Dr
Santa Clara, CA 95051
|
1,166 sq. feet
|
2 baths 3 beds |
show details | |

|
#17
Leith Ave
Santa Clara, CA 95054
|
1,008 sq. feet
|
1 baths 3 beds |
show details | |

|
#18
Bellwood Dr
Santa Clara, CA 95054
|
2,010 sq. feet
|
2 baths 5 beds |
show details | |

|
#19
Humbolt Ave
Santa Clara, CA 95051
|
- sq. feet
|
- baths - beds |
show details | |

|
#20
Pierce St
Santa Clara, CA 95050
|
- sq. feet
|
- baths - beds |
show details |
| Photo | Address | Area | Beds / Baths | Price | Details |
|---|---|---|---|---|---|

|
#21
Cabrillo Ave Apt 1
Santa Clara, CA 95051
|
- sq. feet
|
- baths - beds |
show details | |

|
#22
Harrison St
Santa Clara, CA 95050
|
- sq. feet
|
- baths - beds |
show details | |

|
#23
N Winchester Blvd Apt 3-3g
Santa Clara, CA 95050
|
- sq. feet
|
- baths - beds |
show details | |

|
#24
Homestead Rd Apt 7
Santa Clara, CA 95051
|
- sq. feet
|
- baths - beds |
show details | |

|
#25
Lick Mill Blvd Apt 113
Santa Clara, CA 95054
|
- sq. feet
|
- baths - beds |
show details | |

|
#26
Camino Dr
Santa Clara, CA 95050
|
- sq. feet
|
- baths - beds |
show details | |

|
#27
Halford Ave Apt 33
Santa Clara, CA 95051
|
- sq. feet
|
- baths - beds |
show details | |

|
#28
Aldo Ave Ste 11
Santa Clara, CA 95054
|
- sq. feet
|
- baths - beds |
show details | |

|
#29
Humbolt Avenue
Santa Clara, CA 95051
|
- sq. feet
|
- baths - beds |
show details | |

|
#30
Rivermark Plz # 424
Santa Clara, CA 95054
|
- sq. feet
|
- baths - beds |
show details |
| Photo | Address | Area | Beds / Baths | Price | Details |
|---|---|---|---|---|---|

|
#31
Montgomery Dr # 513
Santa Clara, CA 95054
|
- sq. feet
|
- baths - beds |
show details | |

|
#32
Granada Ave Apt 228
Santa Clara, CA 95051
|
- sq. feet
|
- baths - beds |
show details | |

|
#33
Flora Vista Ave Apt 253
Santa Clara, CA 95051
|
- sq. feet
|
- baths - beds |
show details | |

|
#34
Clair Ct Apt 2
Santa Clara, CA 95051
|
- sq. feet
|
- baths - beds |
show details | |

|
#35
Monroe St Apt 1
Santa Clara, CA 95050
|
- sq. feet
|
- baths - beds |
show details | |

|
#36
Nantucket Cir Apt 223
Santa Clara, CA 95054
|
- sq. feet
|
- baths - beds |
show details | |

|
#37
Buckingham Dr Unit 65
Santa Clara, CA 95051
|
- sq. feet
|
- baths - beds |
show details | |

|
#38
Brookdale Dr Apt 3
Santa Clara, CA 95051
|
- sq. feet
|
- baths - beds |
show details | |

|
#39
Clair Ct # 8
Santa Clara, CA 95051
|
- sq. feet
|
- baths - beds |
show details | |

|
#40
Monroe St
Santa Clara, CA 95050
|
- sq. feet
|
- baths - beds |
show details |
| Photo | Address | Area | Beds / Baths | Price | Details |
|---|---|---|---|---|---|

|
#41
Rambla 131
Santa Clara, CA 95051
|
- sq. feet
|
- baths - beds |
show details | |

|
#42
Homestead Rd
Santa Clara, CA 95050
|
- sq. feet
|
- baths - beds |
show details | |

|
Check over 1 million property listings on Foreclosure.com!
|
browse all offers | |||


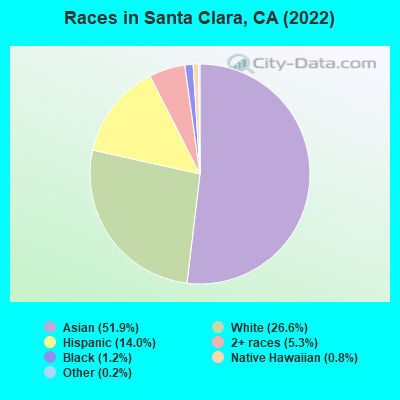
- 65,84551.9%Asian alone
- 33,72826.6%White alone
- 17,73914.0%Hispanic
- 6,7065.3%Two or more races
- 1,5091.2%Black alone
- 1,0640.8%Native Hawaiian and Other
Pacific Islander alone - 2910.2%Other race alone
- 380.03%American Indian alone
According to our research of California and other state lists, there were 157 registered sex offenders living in Santa Clara, California as of April 18, 2024.
The ratio of all residents to sex offenders in Santa Clara is 802 to 1.
The ratio of registered sex offenders to all residents in this city is near the state average.
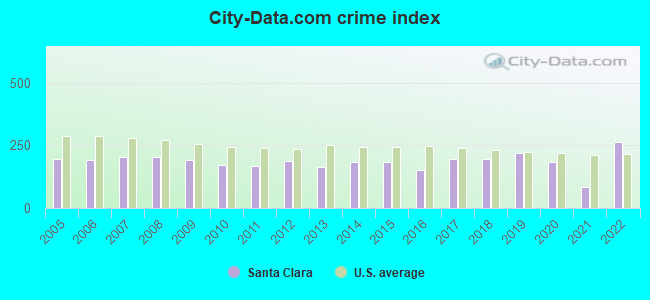
The City-Data.com crime index weighs serious crimes and violent crimes more heavily. Higher means more crime, U.S. average is 246.1. It adjusts for the number of visitors and daily workers commuting into cities.
- means the value is smaller than the state average.- means the value is about the same as the state average.
- means the value is bigger than the state average.
- means the value is much bigger than the state average.
Crime rate in Santa Clara detailed stats: murders, rapes, robberies, assaults, burglaries, thefts, arson
Full-time law enforcement employees in 2021, including police officers: 198 (140 officers - 126 male; 14 female).
| Officers per 1,000 residents here: | 1.06 |
| California average: | 2.30 |
 Recent articles from our blog. Our writers, many of them Ph.D. graduates or candidates, create easy-to-read articles on a wide variety of topics.


 | New Santa Clara neighborhood (0 replies) |
| Potential Move to Santa Clara (55 replies) |
| Possible relocation from Northern Virginia to Santa Clara (29 replies) |
| Relocating to Santa Clara from East Coast (36 replies) |
| Recommended Pizza Restaurants in Santa Clara County (28 replies) |
| Couple with No kids (Moving for a job in Santa Clara) (5 replies) |
Latest news from Santa Clara, CA collected exclusively by city-data.com from local newspapers, TV, and radio stations
Ancestries: American (2.0%), Portuguese (1.8%), Irish (1.7%), English (1.7%), German (1.6%), European (1.5%).
Current Local Time: PST time zone
Elevation: 88 feet
Land area: 18.4 square miles.
Population density: 6,902 people per square mile (high).
57,861 residents are foreign born (34.8% Asia).
| This city: | 46.3% |
| California: | 26.5% |
Median real estate property taxes paid for housing units with mortgages in 2022: $10,001 (0.6%)
Median real estate property taxes paid for housing units with no mortgage in 2022: $4,633 (0.3%)
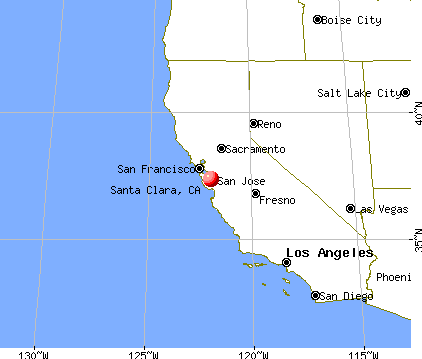
Nearest city with pop. 200,000+: San Jose, CA  (6.3 miles , pop. 894,943).
Nearest city with pop. 1,000,000+: Los Angeles, CA (303.0 miles , pop. 3,694,820).
Nearest cities:
), ), ), Latitude: 37.35 N, Longitude: 121.97 W
Daytime population change due to commuting: +25,276 (+19.9%)
Workers who live and work in this city: 30,064 (43.0%)
Area code commonly used in this area: 408
Santa Clara tourist attractions:
Santa Clara, California accommodation & food services, waste management - Economy and Business Data
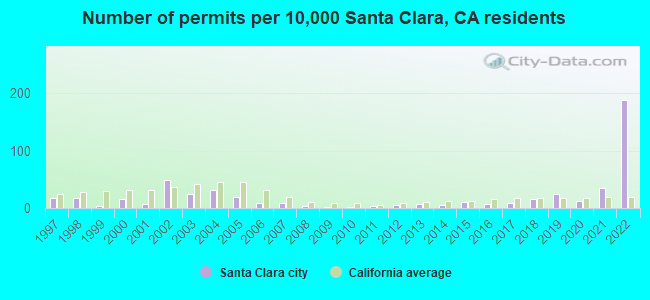
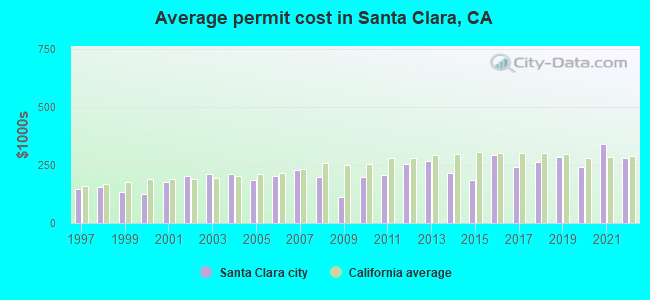
Single-family new house construction building permits:
- 2022: 1926 buildings, average cost: $279,900
- 2021: 360 buildings, average cost: $340,700
- 2020: 130 buildings, average cost: $243,800
- 2019: 257 buildings, average cost: $285,400
- 2018: 164 buildings, average cost: $263,000
- 2017: 83 buildings, average cost: $241,900
- 2016: 68 buildings, average cost: $292,500
- 2015: 117 buildings, average cost: $186,500
- 2014: 56 buildings, average cost: $216,100
- 2013: 74 buildings, average cost: $269,000
- 2012: 49 buildings, average cost: $252,900
- 2011: 34 buildings, average cost: $205,700
- 2010: 18 buildings, average cost: $197,200
- 2009: 9 buildings, average cost: $112,200
- 2008: 43 buildings, average cost: $196,500
- 2007: 85 buildings, average cost: $226,600
- 2006: 80 buildings, average cost: $201,000
- 2005: 195 buildings, average cost: $183,900
- 2004: 319 buildings, average cost: $213,300
- 2003: 243 buildings, average cost: $212,600
- 2002: 490 buildings, average cost: $200,900
- 2001: 75 buildings, average cost: $178,700
- 2000: 166 buildings, average cost: $124,600
- 1999: 41 buildings, average cost: $135,000
- 1998: 177 buildings, average cost: $155,600
- 1997: 183 buildings, average cost: $145,200
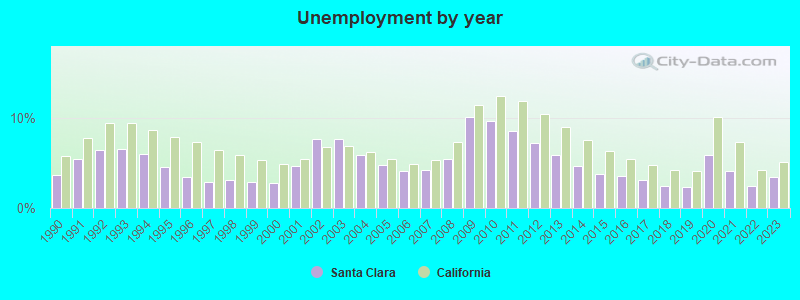
| Here: | 3.5% |
| California: | 5.1% |
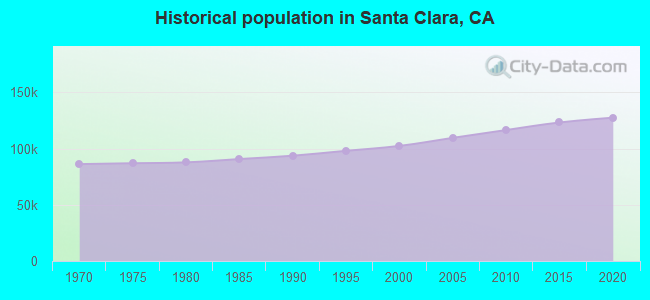
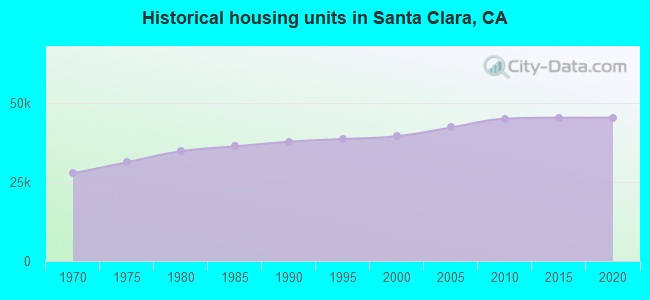
Population change in the 1990s: +9,008 (+9.6%).
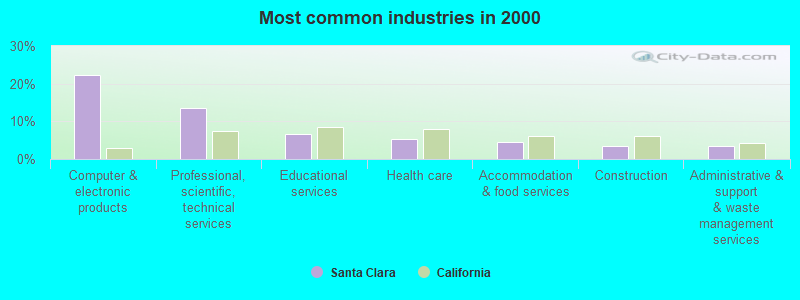
- Computer & electronic products (22.3%)
- Professional, scientific, technical services (13.5%)
- Educational services (6.6%)
- Health care (5.3%)
- Accommodation & food services (4.4%)
- Construction (3.5%)
- Administrative & support & waste management services (3.4%)
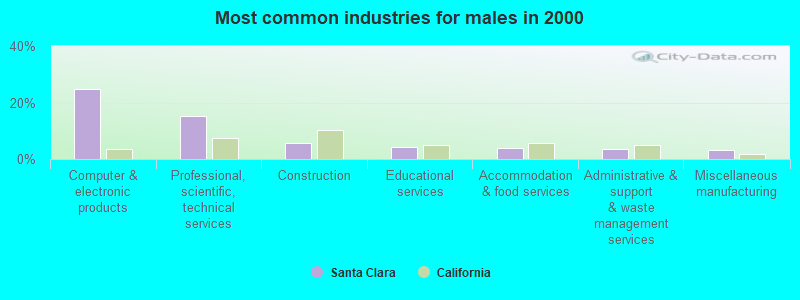
- Computer & electronic products (24.7%)
- Professional, scientific, technical services (15.1%)
- Construction (5.6%)
- Educational services (4.2%)
- Accommodation & food services (4.1%)
- Administrative & support & waste management services (3.6%)
- Miscellaneous manufacturing (3.1%)
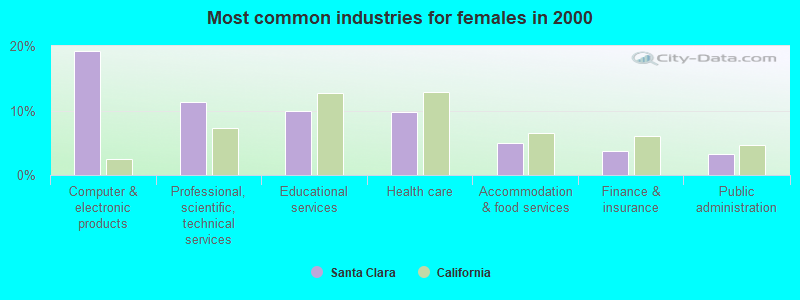
- Computer & electronic products (19.2%)
- Professional, scientific, technical services (11.4%)
- Educational services (9.9%)
- Health care (9.8%)
- Accommodation & food services (4.9%)
- Finance & insurance (3.7%)
- Public administration (3.2%)
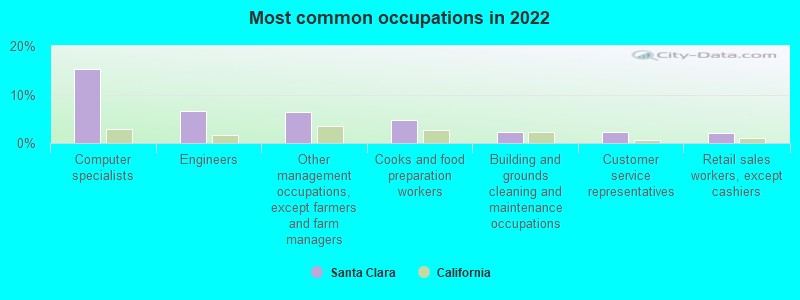
- Computer specialists (15.2%)
- Engineers (6.6%)
- Other management occupations, except farmers and farm managers (6.3%)
- Cooks and food preparation workers (4.7%)
- Building and grounds cleaning and maintenance occupations (2.3%)
- Customer service representatives (2.2%)
- Retail sales workers, except cashiers (2.1%)
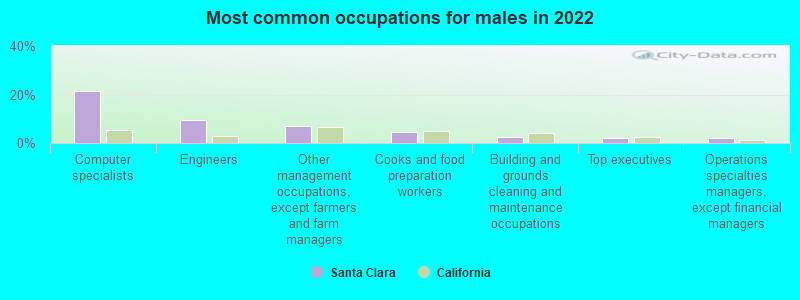
- Computer specialists (21.6%)
- Engineers (9.6%)
- Other management occupations, except farmers and farm managers (7.0%)
- Cooks and food preparation workers (4.4%)
- Building and grounds cleaning and maintenance occupations (2.5%)
- Top executives (1.9%)
- Operations specialties managers, except financial managers (1.9%)
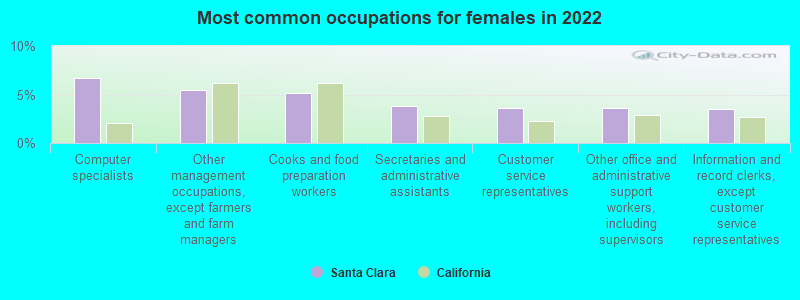
- Computer specialists (6.7%)
- Other management occupations, except farmers and farm managers (5.4%)
- Cooks and food preparation workers (5.2%)
- Secretaries and administrative assistants (3.8%)
- Customer service representatives (3.7%)
- Other office and administrative support workers, including supervisors (3.6%)
- Information and record clerks, except customer service representatives (3.5%)
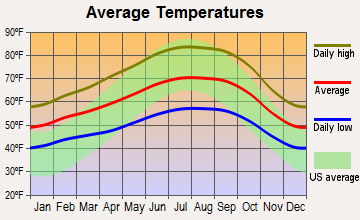
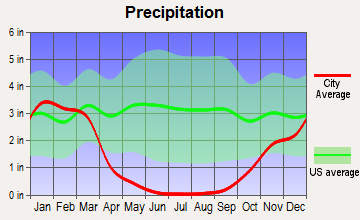
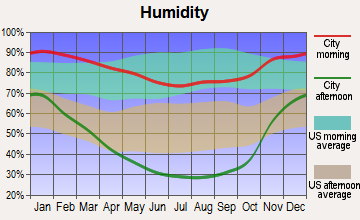
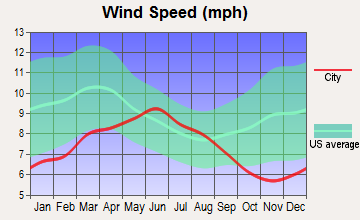
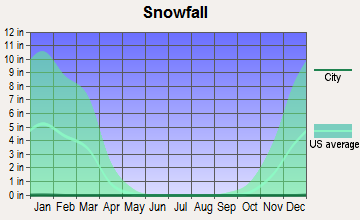
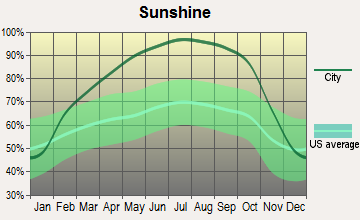
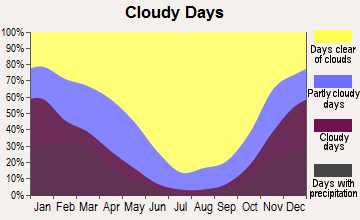
Average climate in Santa Clara, California
Based on data reported by over 4,000 weather stations
|
|

(lower is better)
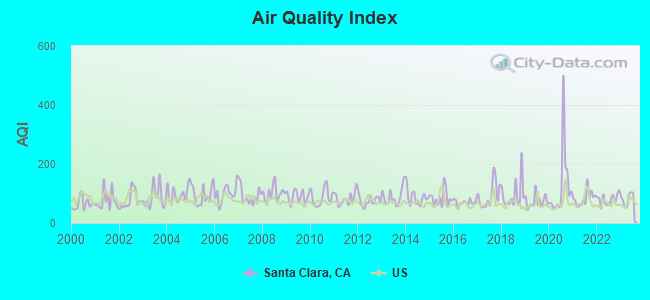
Air Quality Index (AQI) level in 2023 was 82.7. This is about average.
| City: | 82.7 |
| U.S.: | 72.6 |
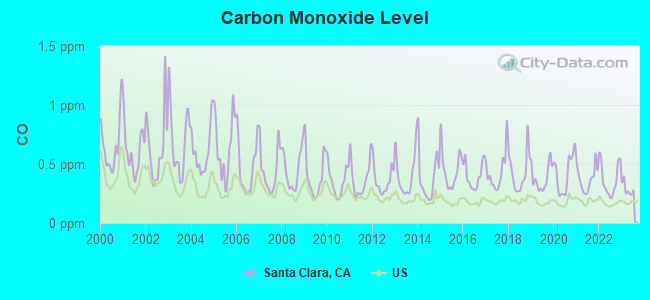
Carbon Monoxide (CO) [ppm] level in 2023 was 0.288. This is about average. Closest monitor was 3.4 miles away from the city center.
| City: | 0.288 |
| U.S.: | 0.251 |
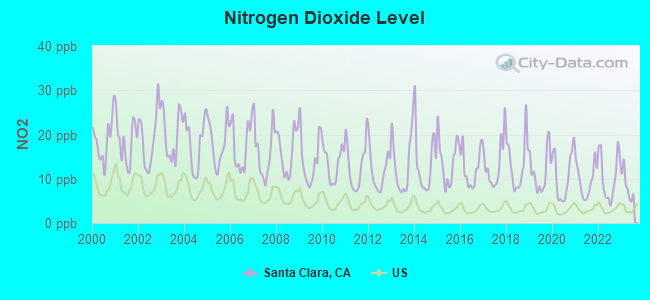
Nitrogen Dioxide (NO2) [ppb] level in 2023 was 8.42. This is significantly worse than average. Closest monitor was 3.4 miles away from the city center.
| City: | 8.42 |
| U.S.: | 5.11 |
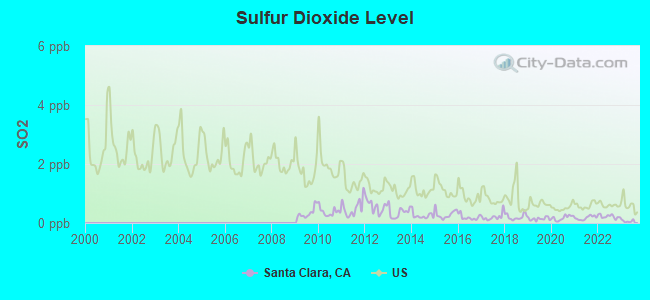
Sulfur Dioxide (SO2) [ppb] level in 2023 was 0.0660. This is significantly better than average. Closest monitor was 3.4 miles away from the city center.
| City: | 0.0660 |
| U.S.: | 1.5147 |
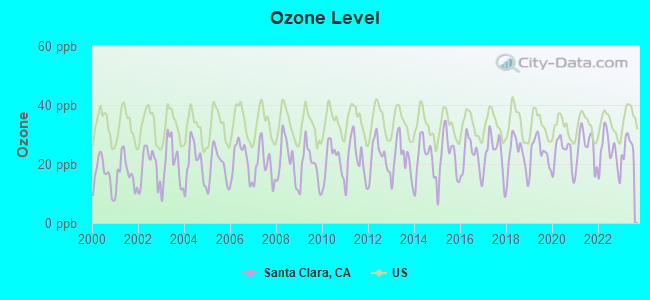
Ozone [ppb] level in 2023 was 26.3. This is better than average. Closest monitor was 3.2 miles away from the city center.
| City: | 26.3 |
| U.S.: | 33.3 |
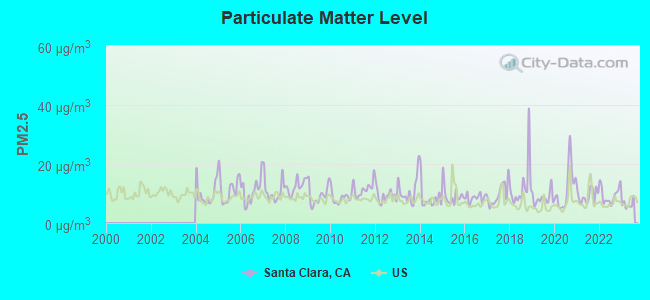
Particulate Matter (PM2.5) [µg/m3] level in 2023 was 6.33. This is better than average. Closest monitor was 4.1 miles away from the city center.
| City: | 6.33 |
| U.S.: | 8.11 |
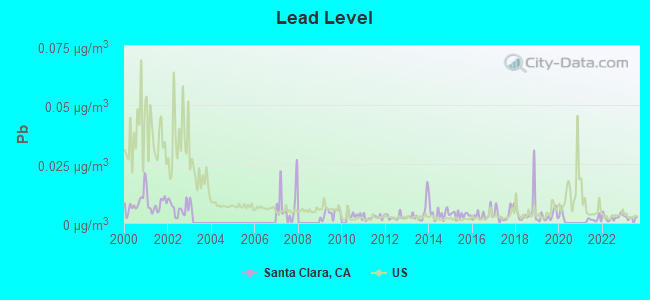
Lead (Pb) [µg/m3] level in 2023 was 0.00228. This is significantly better than average. Closest monitor was 3.4 miles away from the city center.
| City: | 0.00228 |
| U.S.: | 0.00931 |
Earthquake activity:
Santa Clara-area historical earthquake activity is significantly above California state average. It is 7625% greater than the overall U.S. average.On 4/18/1906 at 13:12:21, a magnitude 7.9 (7.9 UK, Class: Major, Intensity: VIII - XII) earthquake occurred 72.0 miles away from Santa Clara center, causing $524,000,000 total damage
On 10/18/1989 at 00:04:15, a magnitude 7.1 (6.5 MB, 7.1 MS, 6.9 MW, 7.0 ML) earthquake occurred 20.2 miles away from Santa Clara center, causing 62 deaths (62 shaking deaths) and 3757 injuries, causing $1,305,032,704 total damage
On 11/4/1927 at 13:51:53, a magnitude 7.5 (7.5 UK) earthquake occurred 176.7 miles away from the city center
On 7/21/1952 at 11:52:14, a magnitude 7.7 (7.7 UK) earthquake occurred 232.4 miles away from the city center, causing $50,000,000 total damage
On 1/31/1922 at 13:17:28, a magnitude 7.6 (7.6 UK) earthquake occurred 301.0 miles away from Santa Clara center
On 12/21/1932 at 06:10:09, a magnitude 7.2 (7.2 UK) earthquake occurred 226.5 miles away from Santa Clara center
Magnitude types: body-wave magnitude (MB), local magnitude (ML), surface-wave magnitude (MS), moment magnitude (MW)
Natural disasters:
The number of natural disasters in Santa Clara County (19) is greater than the US average (15).Major Disasters (Presidential) Declared: 10
Emergencies Declared: 3
Causes of natural disasters: Floods: 9, Fires: 5, Winter Storms: 5, Storms: 4, Mudslides: 3, Landslides: 2, Drought: 1, Earthquake: 1, Freeze: 1, Hurricane: 1, Tornado: 1, Other: 1 (Note: some incidents may be assigned to more than one category).
Main business address for: TRANSMETA CORP (SEMICONDUCTORS & RELATED DEVICES), PortalPlayer, Inc. (SEMICONDUCTORS & RELATED DEVICES), NETGEAR INC (TELEPHONE & TELEGRAPH APPARATUS), HYPERION SOLUTIONS CORP (SERVICES-PREPACKAGED SOFTWARE), RIVERSTONE NETWORKS INC (COMPUTER COMMUNICATIONS EQUIPMENT), SUN MICROSYSTEMS INC (ELECTRONIC COMPUTERS), ZORAN CORP \DE\ (SEMICONDUCTORS & RELATED DEVICES), AFFYMETRIX INC (LABORATORY ANALYTICAL INSTRUMENTS) and 33 other public companies.
Hospitals and medical centers in Santa Clara:
- KAISER FOUNDATION HOSPITAL-SANTA CLARA (Government - Federal, provides emergency services, 700 LAWRENCE EXPRESSWAY)
- MISSION SKILLED NURSING AND SUBACUTE CENTER (410 NORTH WINCHESTER BOULEVARD)
- VALLEY HOUSE REHABILITATION CENTER (991 CLYDE AVENUE)
- KAISER PERMANENTE - SANTA CLARA (710 LAWRENCE EXPRESSWAY #460)
- HYGEIA, INC (1825 DE LA CRUZ BOULEVARD, SUITE 100)
- KAISER FOUNDATION HOSPITALS HHA-SANTA CLARA (2610 AUGUSTINE DRIVE)
Heliports located in Santa Clara:
Colleges/Universities in Santa Clara:
- Santa Clara University (Full-time enrollment: 7,640; Location: 500 El Camino Real; Private, not-for-profit; Website: www.scu.edu; Offers Doctor's degree)
- Mission College (Full-time enrollment: 5,625; Location: 3000 Mission College Blvd; Public; Website: www.missioncollege.edu/)
- Marinello Schools of Beauty-Santa Clara (Full-time enrollment: 1,084; Location: 955 Monroe St; Private, for-profit; Website: www.marinello.com)
- Institute for Business and Technology (Full-time enrollment: 211; Location: 2400 Walsh Avenue; Private, for-profit; Website: www.ibttech.com)
- Academy for Salon Professionals (Full-time enrollment: 159; Location: 2238 El Camino Real; Private, for-profit; Website: www.academyforsalonpros.com)
Other colleges/universities with over 2000 students near Santa Clara:
- San Jose City College (about 4 miles; San Jose, CA; Full-time enrollment: 5,526)
- De Anza College (about 5 miles; Cupertino, CA; FT enrollment: 16,729)
- San Jose State University (about 6 miles; San Jose, CA; FT enrollment: 23,357)
- West Valley College (about 7 miles; Saratoga, CA; FT enrollment: 6,128)
- Wyotech-Fremont (about 9 miles; Fremont, CA; FT enrollment: 2,383)
- Foothill College (about 9 miles; Los Altos Hills, CA; FT enrollment: 9,635)
- Evergreen Valley College (about 12 miles; San Jose, CA; FT enrollment: 5,539)
Public high schools in Santa Clara:
- ADRIAN WILCOX HIGH (Students: 1,354, Location: 3250 MONROE ST., Grades: 9-12)
- SANTA CLARA HIGH (Students: 1,245, Location: 3000 BENTON ST., Grades: 9-12)
- WILSON ALTERNATIVE (Students: 113, Location: 1840 BENTON ST., Grades: KG-12)
- NEW VALLEY CONTINUATION HIGH (Students: 38, Location: 1875 LAWRENCE RD., Grades: 9-12)
- SANTA CLARA COMMUNITY DAY (Location: 3450 BROOKDALE DR., Grades: 6-12)
- MAGNOLIA SCIENCE ACADEMY SANTA CLARA (Location: 2720 SONOMA PL., Grades: 6-11, Charter school)
Private high schools in Santa Clara:
Biggest public elementary/middle schools in Santa Clara:
- BUCHSER MIDDLE (Students: 897, Location: 1111 BELLOMY ST., Grades: 6-8)
- JUAN CABRILLO MIDDLE (Students: 793, Location: 2550 CABRILLO AVE., Grades: 6-8)
- DON CALLEJON (Students: 496, Location: 4176 LICK MILL BLVD., Grades: KG-8)
- DWIGHT D. EISENHOWER ELEMENTARY (Students: 406, Location: 277 RODONOVAN DR., Grades: KG-5)
- LAURELWOOD ELEMENTARY (Students: 353, Location: 955 TEAL DR., Grades: KG-5)
- POMEROY ELEMENTARY (Students: 325, Location: 1250 POMEROY AVE., Grades: KG-5)
- SCOTT LANE ELEMENTARY (Students: 275, Location: 1925 SCOTT BLVD., Grades: KG-5)
- KATHRYN HUGHES ELEMENTARY (Students: 255, Location: 4949 CALLE DE ESCUELA, Grades: KG-5)
- BOWERS ELEMENTARY (Students: 251, Location: 2755 BARKLEY AVE., Grades: KG-5)
- BRIARWOOD ELEMENTARY (Students: 248, Location: 1930 TOWNSEND AVE., Grades: KG-5)
Biggest private elementary/middle schools in Santa Clara:
- STRATFORD SCHOOL - SANTA CLARA POMEROY (Students: 400, Location: 890 POMEROY AVE, Grades: PK-8)
- GRANADA ISLAMIC SCHOOL (Students: 398, Location: 3003 SCOTT BLVD, Grades: PK-8)
- MONTICELLO ACADEMY (Students: 393, Location: 3345 LOCHINVAR AVE, Grades: PK-8)
- ST LAWRENCE ELEMENTARY & MIDDLE SCHOOLS (Students: 344, Location: 1977 ST LAWRENCE DR, Grades: PK-8)
- ST JUSTIN ELEMENTARY SCHOOL (Students: 310, Location: 2655 HOMESTEAD RD, Grades: PK-8)
- ST CLARE SCHOOL (Students: 300, Location: 760 WASHINGTON ST, Grades: KG-8)
- CARDEN ACADEMY OF SANTA CLARA (Students: 252, Location: 2499 HOMESTEAD RD, Grades: PK-8)
- NEIGHBORHOOD CHRISTIAN CENTER (Students: 212, Location: 887 POMEROY AVE, Grades: UG-T1)
- DELPHI ACADEMY SAN FRANCISCO BAY (Students: 138, Location: 890 POMEROY AVE # 201, Grades: KG-8)
- ONE WORLD MONTESSORI SCHOOL (Students: 95, Location: 2495 CABRILLO AVE, Grades: PK-3)
Library in Santa Clara:
User-submitted facts and corrections:
- In the list of churches, the Church of Jesus Christ of Latter-Day Saints (on Quince street) is not included.
Points of interest:
Notable locations in Santa Clara: Dianetic Information Center (A), Pruneridge Farms Golf Course (B), Santa Clara Municipal Golf Course (C), Santa Clara Fire Department Station 2 (D), Santa Clara Fire Department Station 9 (E), Santa Clara Fire Department Station 8 (F), Santa Clara Fire Department Station 7 (G), Santa Clara Fire Department Station 6 (H), Santa Clara Fire Department Station 3 (I), Santa Clara Fire Department Station 5 (J), Santa Clara Fire Department Station 4 (K), Santa Clara Fire Department Station 10 (L), Santa Clara Fire Department Station 1 (M), Triton Museum of Art Library (N), Triton Museum of Art (O), Santa Clara Unified School District Office (P), Santa Clara Civic Center (Q), Santa Clara City Hall (R), Santa Clara County Free Library (S), Santa Clara Convention Center (T). Display/hide their locations on the map
Shopping Centers: Youth Shopping Center (1), Winchester Shopping Center (2), Village Green Shopping Center (3), Moonlite Shopping Center (4), McWhorters Village Shopping Center (5), Grandview Plaza Shopping Center (6), Cedar Tree Plaza Shopping Center (7), Lawrence Square Shopping Center (8), Pruneridge Shopping Center (9). Display/hide their locations on the map
Main business address in Santa Clara include: TRANSMETA CORP (A), PortalPlayer, Inc. (B), NETGEAR INC (C), HYPERION SOLUTIONS CORP (D), RIVERSTONE NETWORKS INC (E), SUN MICROSYSTEMS INC (F), ZORAN CORP \DE\ (G), AFFYMETRIX INC (H). Display/hide their locations on the map
Churches in Santa Clara include: Carmelite Monastery (A), Our Lady of Peace Catholic Church (B), Our Lady of Peace Shrine (C), Christian Wisdom In USA Church (D), North Valley Baptist Church (E), Calvary Baptist Church of Santa Clara (F), Church of Christ (G), The Church of Jesus Christ of Latter Day Saints (H), El Camino Bible Church (I). Display/hide their locations on the map
Cemeteries: Santa Clara Catholic Cemetery (1), Mission City Memorial Park (2). Display/hide their locations on the map
Creek: San Tomas Aquinas Creek (A). Display/hide its location on the map
Parks in Santa Clara include: Civic Center Park (1), Fremont Park (2), Henry Schmidt Park (3), Lafayette Park (4), Steve Carli Park (5), Stanton Soccer Field (6), Bellomy Field (7), Warburton Park (8), Alvarez Park (9). Display/hide their locations on the map
Hotels: Best Western Inn Santa Clara (4341 El Camino Real), Biltmore Hotel & Suites Silicon Valley - Reservations & Information (2151 Laurelwood Road).
Court: Santa Clara County - Santa Clara Courthouse- Superior Court (1095 Homestead Road).
Birthplace of: Troy Tulowitzki - Professional baseball shortstop, Kerri Walsh - Volleyball player, Matt Barnes - Basketball player, Kevin Jurovich - Football player, Adam Melhuse - 2005 Major League Baseball player (Oakland Athletics, born: Mar 27, 1972), Huck Seed - Poker player, Keith Wright - 2005 NFL player (Arizona Cardinals, born: Jun 8, 1980), James Brown (author) - Novelist, Zak Ibsen - Soccer player, Brent Jones - Football player.
| This city: | 2.6 people |
| California: | 2.9 people |
| This city: | 64.9% |
| Whole state: | 68.7% |
| This city: | 5.7% |
| Whole state: | 7.2% |
Likely homosexual households (counted as self-reported same-sex unmarried-partner households)
- Lesbian couples: 0.3% of all households
- Gay men: 0.4% of all households
People in group quarters in Santa Clara in 2010:
- 2,592 people in college/university student housing
- 318 people in nursing facilities/skilled-nursing facilities
- 92 people in other noninstitutional facilities
- 80 people in group homes intended for adults
- 48 people in workers' group living quarters and job corps centers
- 38 people in emergency and transitional shelters (with sleeping facilities) for people experiencing homelessness
- 13 people in correctional residential facilities
- 10 people in residential treatment centers for adults
- 5 people in group homes for juveniles (non-correctional)
People in group quarters in Santa Clara in 2000:
- 2,075 people in college dormitories (includes college quarters off campus)
- 427 people in nursing homes
- 142 people in other noninstitutional group quarters
- 75 people in religious group quarters
- 26 people in homes for the mentally ill
- 20 people in halfway houses
- 10 people in other nonhousehold living situations
- 6 people in schools, hospitals, or wards for the intellectually disabled
- 6 people in homes for abused, dependent, and neglected children
Banks with most branches in Santa Clara (2011 data):
- Wells Fargo Bank, National Association: Stevens Creek Branch, El Camino & Scott Branch, Rivermark Village, Homestead-Kiely Branch, Santa Clara Branch. Info updated 2011/04/05: Bank assets: $1,161,490.0 mil, Deposits: $905,653.0 mil, headquarters in Sioux Falls, SD, positive income, 6395 total offices, Holding Company: Wells Fargo & Company
- Bank of America, National Association: Santa Clara Main Branch, San Tomas Industrial Park Branch, Valley Fair Branch, El Camino-Kiely Branch. Info updated 2009/11/18: Bank assets: $1,451,969.3 mil, Deposits: $1,077,176.8 mil, headquarters in Charlotte, NC, positive income, 5782 total offices, Holding Company: Bank Of America Corporation
- JPMorgan Chase Bank, National Association: El Camino Real Lucky Branch, 2200 El Camino Real Branch, 2915 Stevens Creek Blvd Branch. Info updated 2011/11/10: Bank assets: $1,811,678.0 mil, Deposits: $1,190,738.0 mil, headquarters in Columbus, OH, positive income, International Specialization, 5577 total offices, Holding Company: Jpmorgan Chase & Co.
- Bank of the West: Scott Boulevard Branch at 3233 Scott Boulevard, branch established on 1978/03/29; Santa Clara Branch at 1705 El Camino Real, branch established on 1955/03/01. Info updated 2009/11/16: Bank assets: $62,408.3 mil, Deposits: $43,995.2 mil, headquarters in San Francisco, CA, positive income, 647 total offices, Holding Company: Bnp Paribas
- Citibank, National Association: 3755 El Camino Real Branch at 3755 El Camino Real, branch established on 1945/01/01; Santa Clara Branch at 2500 Pruneridge Avenue, branch established on 1987/06/30. Info updated 2012/01/10: Bank assets: $1,288,658.0 mil, Deposits: $882,541.0 mil, headquarters in Sioux Falls, SD, positive income, International Specialization, 1048 total offices, Holding Company: Citigroup Inc.
- Silicon Valley Bank: at 3003 Tasman Drive, branch established on 1983/10/17. Info updated 2006/11/03: Bank assets: $18,760.9 mil, Deposits: $16,815.1 mil, local headquarters, positive income, Commercial Lending Specialization, 5 total offices, Holding Company: Svb Financial Group
- Scott Valley Bank: Santa Clara Branch at 5201 Great America Parkway, Suite 333, branch established on 2007/07/30. Info updated 2006/11/03: Bank assets: $477.2 mil, Deposits: $392.3 mil, headquarters in Yreka, CA, positive income, Commercial Lending Specialization, 13 total offices, Holding Company: Learner Financial Corporation
- Kaiser Federal Bank: Northern California Branch at 3375 Scott Boulevard, Suite 312, branch established on 1984/08/01. Info updated 2011/07/21: Bank assets: $931.9 mil, Deposits: $697.1 mil, headquarters in Covina, CA, positive income, Commercial Lending Specialization, 9 total offices
- BBCN Bank: Santa Clara Branch at 3581 El Camino Real, branch established on 2005/10/12. Info updated 2011/12/12: Bank assets: $5,170.7 mil, Deposits: $3,989.4 mil, headquarters in Los Angeles, CA, positive income, Commercial Lending Specialization, 49 total offices, Holding Company: Bbcn Bancorp, Inc.
- 2 other banks with 2 local branches
For population 15 years and over in Santa Clara:
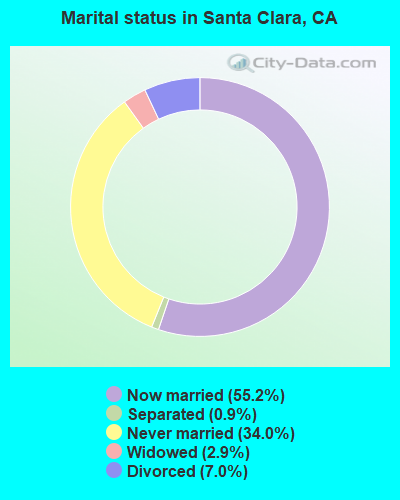
- Never married: 34.0%
- Now married: 55.2%
- Separated: 0.9%
- Widowed: 2.9%
- Divorced: 7.0%
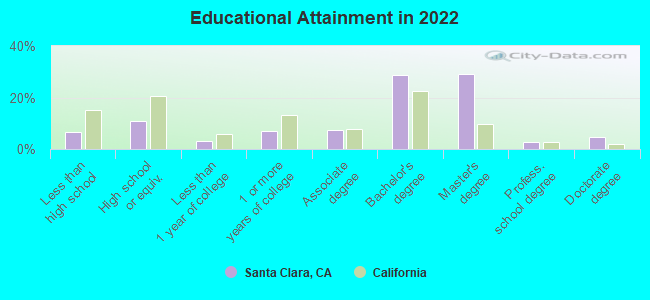
For population 25 years and over in Santa Clara:
- High school or higher: 93.4%
- Bachelor's degree or higher: 65.6%
- Graduate or professional degree: 36.7%
- Unemployed: 3.4%
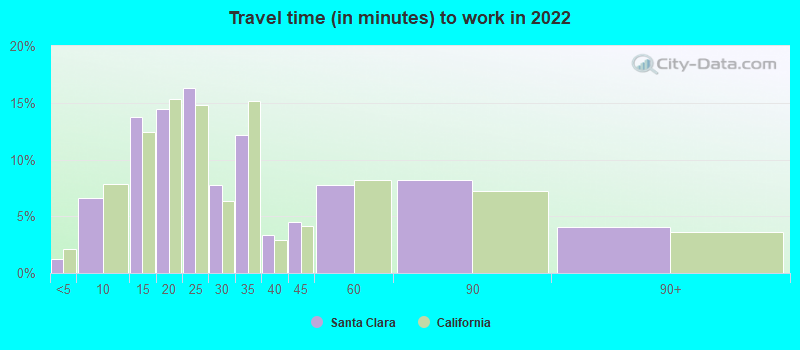
- Mean travel time to work (commute): 15.0 minutes
| Here: | 11.8 |
| California average: | 15.5 |
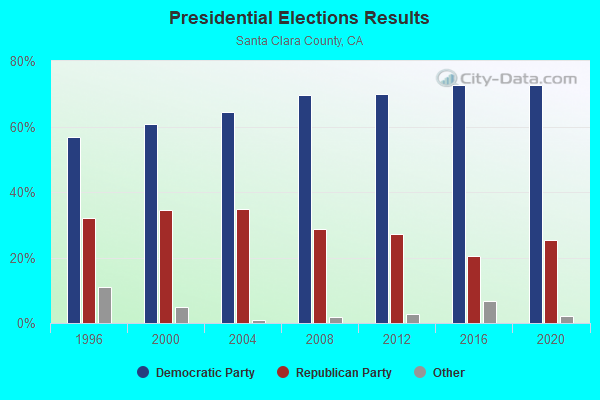
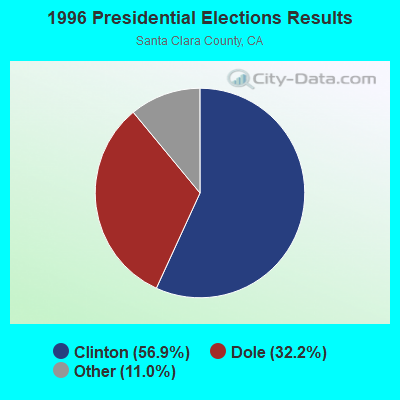
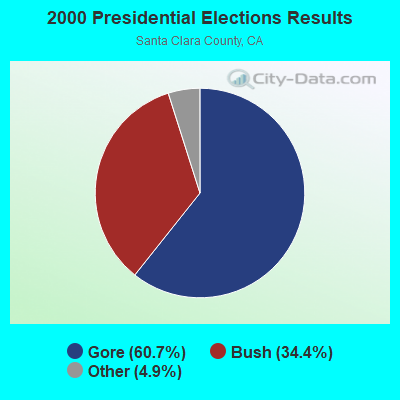

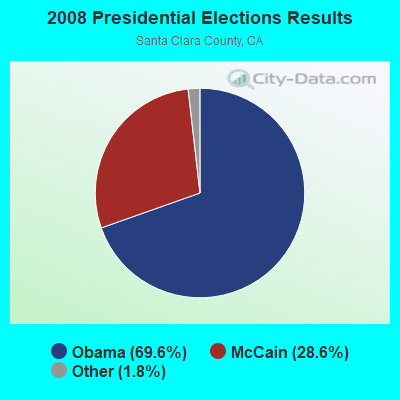
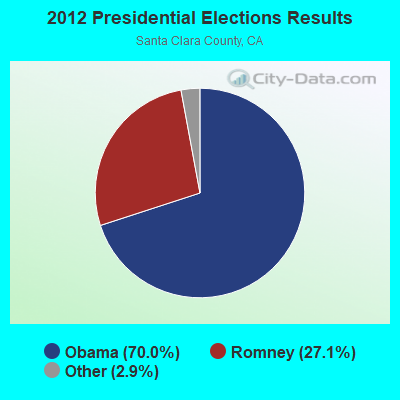
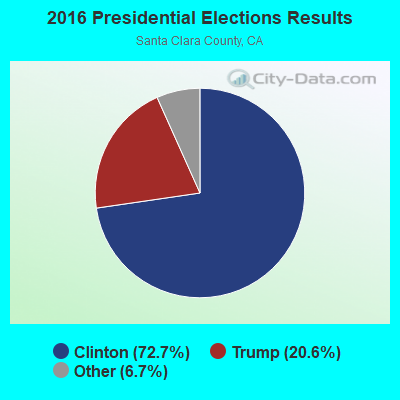
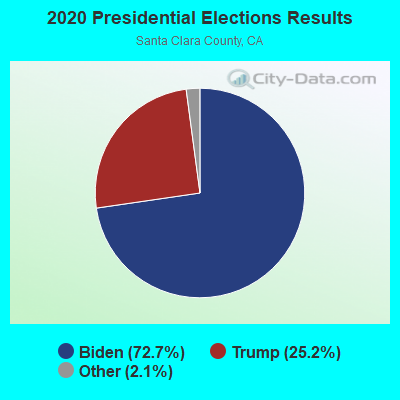
Graphs represent county-level data. Detailed 2008 Election Results
Religion statistics for Santa Clara, CA (based on Santa Clara County data)
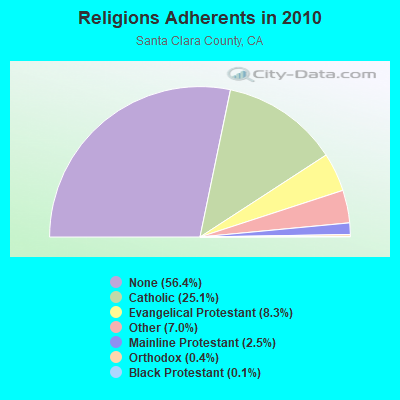
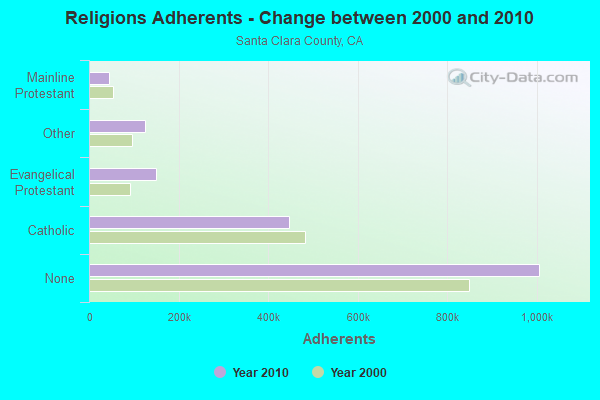
| Religion | Adherents | Congregations |
|---|---|---|
| Catholic | 447,369 | 56 |
| Evangelical Protestant | 148,599 | 481 |
| Other | 125,165 | 221 |
| Mainline Protestant | 44,623 | 132 |
| Orthodox | 7,720 | 17 |
| Black Protestant | 2,552 | 20 |
| None | 1,005,614 | - |
Food Environment Statistics:
| Santa Clara County: | 1.99 / 10,000 pop. |
| California: | 2.14 / 10,000 pop. |
| This county: | 0.04 / 10,000 pop. |
| State: | 0.04 / 10,000 pop. |
| Santa Clara County: | 0.68 / 10,000 pop. |
| California: | 0.62 / 10,000 pop. |
| Santa Clara County: | 1.38 / 10,000 pop. |
| State: | 1.49 / 10,000 pop. |
| Here: | 8.59 / 10,000 pop. |
| California: | 7.42 / 10,000 pop. |
| Santa Clara County: | 7.1% |
| California: | 7.3% |
| This county: | 19.0% |
| State: | 21.3% |
| Santa Clara County: | 16.6% |
| California: | 17.9% |
Health and Nutrition:
| Santa Clara: | 53.8% |
| California: | 49.4% |
| This city: | 51.8% |
| California: | 48.0% |
| Santa Clara: | 27.0 |
| California: | 28.1 |
| This city: | 17.0% |
| California: | 20.2% |
| Santa Clara: | 13.0% |
| California: | 11.2% |
| Santa Clara: | 6.9 |
| California: | 6.8 |
| This city: | 27.6% |
| California: | 31.5% |
| Santa Clara: | 60.2% |
| California: | 56.4% |
| Here: | 82.7% |
| California: | 80.9% |
More about Health and Nutrition of Santa Clara, CA Residents
| Local government employment and payroll (March 2022) | |||||
| Function | Full-time employees | Monthly full-time payroll | Average yearly full-time wage | Part-time employees | Monthly part-time payroll |
|---|---|---|---|---|---|
| Electric Power | 162 | $3,000,055 | $222,226 | 10 | $42,918 |
| Police Protection - Officers | 140 | $2,569,185 | $220,216 | 17 | $46,278 |
| Firefighters | 131 | $2,643,461 | $242,149 | 0 | $0 |
| Financial Administration | 75 | $801,274 | $128,204 | 17 | $59,266 |
| Streets and Highways | 69 | $752,612 | $130,889 | 2 | $8,161 |
| Parks and Recreation | 66 | $577,494 | $104,999 | 105 | $133,304 |
| Other and Unallocable | 61 | $625,267 | $123,003 | 9 | $30,778 |
| Police - Other | 60 | $674,419 | $134,884 | 50 | $59,033 |
| Water Supply | 58 | $594,677 | $123,037 | 4 | $12,833 |
| Other Government Administration | 50 | $698,342 | $167,602 | 20 | $75,071 |
| Local Libraries | 40 | $348,564 | $104,569 | 28 | $36,975 |
| Fire - Other | 15 | $133,754 | $107,003 | 0 | $0 |
| Sewerage | 11 | $103,391 | $112,790 | 0 | $0 |
| Housing and Community Development (Local) | 7 | $79,530 | $136,337 | 3 | $10,866 |
| Solid Waste Management | 5 | $59,920 | $143,808 | 0 | $0 |
| Totals for Government | 950 | $13,661,945 | $172,572 | 265 | $515,483 |
Santa Clara government finances - Expenditure in 2021 (per resident):
- Construction - Electric Utilities: $34,169,000 ($269.20)
Regular Highways: $30,707,000 ($241.92)
Parks and Recreation: $9,787,000 ($77.11)
General - Other: $9,417,000 ($74.19)
Water Utilities: $8,438,000 ($66.48)
Sewerage: $4,797,000 ($37.79)
Housing and Community Development: $409,000 ($3.22)
Police Protection: $385,000 ($3.03)
General Public Buildings: $236,000 ($1.86)
Libraries: $108,000 ($0.85)
Local Fire Protection: $7,000 ($0.06)
- Current Operations - Electric Utilities: $375,142,000 ($2955.50)
Police Protection: $74,923,000 ($590.27)
Sewerage: $62,554,000 ($492.82)
Local Fire Protection: $58,353,000 ($459.73)
Water Utilities: $43,713,000 ($344.39)
Central Staff Services: $42,908,000 ($338.04)
Solid Waste Management: $29,626,000 ($233.40)
Parks and Recreation: $29,518,000 ($232.55)
Regular Highways: $27,088,000 ($213.41)
Housing and Community Development: $17,907,000 ($141.08)
Financial Administration: $15,852,000 ($124.89)
Libraries: $8,879,000 ($69.95)
Protective Inspection and Regulation - Other: $7,801,000 ($61.46)
General - Other: $5,797,000 ($45.67)
Health - Other: $2,749,000 ($21.66)
Judicial and Legal Services: $2,300,000 ($18.12)
Parking Facilities: $1,355,000 ($10.68)
Miscellaneous Commercial Activities - Other: $1,355,000 ($10.68)
- Electric Utilities - Interest on Debt: $3,744,000 ($29.50)
- General - Interest on Debt: $17,464,000 ($137.59)
- Other Capital Outlay - General - Other: $8,492,000 ($66.90)
Local Fire Protection: $195,000 ($1.54)
Police Protection: $183,000 ($1.44)
Parks and Recreation: $68,000 ($0.54)
Electric Utilities: $67,000 ($0.53)
Santa Clara government finances - Revenue in 2021 (per resident):
- Charges - Sewerage: $50,690,000 ($399.35)
Parks and Recreation: $39,190,000 ($308.75)
Other: $35,257,000 ($277.77)
Solid Waste Management: $26,603,000 ($209.59)
Parking Facilities: $937,000 ($7.38)
Miscellaneous Commercial Activities: $844,000 ($6.65)
Regular Highways: $144,000 ($1.13)
- Federal Intergovernmental - Other: $6,731,000 ($53.03)
Housing and Community Development: $2,256,000 ($17.77)
- Local Intergovernmental - Other: $312,000 ($2.46)
- Miscellaneous - General Revenue - Other: $64,641,000 ($509.26)
Rents: $9,409,000 ($74.13)
Interest Earnings: $8,921,000 ($70.28)
Special Assessments: $3,199,000 ($25.20)
Donations From Private Sources: $2,393,000 ($18.85)
Fines and Forfeits: $360,000 ($2.84)
- Revenue - Electric Utilities: $511,313,000 ($4028.31)
Water Utilities: $49,285,000 ($388.28)
- State Intergovernmental - Highways: $5,250,000 ($41.36)
Electric Utilities: $1,900,000 ($14.97)
Other: $1,652,000 ($13.02)
General Local Government Support: $164,000 ($1.29)
- Tax - Property: $68,773,000 ($541.82)
General Sales and Gross Receipts: $61,241,000 ($482.48)
Other License: $13,684,000 ($107.81)
Public Utilities Sales: $4,323,000 ($34.06)
Other Selective Sales: $2,949,000 ($23.23)
Documentary and Stock Transfer: $1,501,000 ($11.83)
Occupation and Business License - Other: $858,000 ($6.76)
Other: $828,000 ($6.52)
Santa Clara government finances - Debt in 2021 (per resident):
- Long Term Debt - Beginning Outstanding - Unspecified Public Purpose: $554,542,000 ($4368.88)
Outstanding Unspecified Public Purpose: $509,036,000 ($4010.37)
Retired Unspecified Public Purpose: $45,506,000 ($358.51)
Santa Clara government finances - Cash and Securities in 2021 (per resident):
- Bond Funds - Cash and Securities: $98,238,000 ($773.95)
- Other Funds - Cash and Securities: $368,689,000 ($2904.66)
- Sinking Funds - Cash and Securities: $5,533,000 ($43.59)
5.37% of this county's 2021 resident taxpayers lived in other counties in 2020 ($152,550 average adjusted gross income)
| Here: | 5.37% |
| California average: | 5.19% |
0.01% of residents moved from foreign countries ($93 average AGI)
Santa Clara County: 0.01% California average: 0.03%
Top counties from which taxpayers relocated into this county between 2020 and 2021:
| from Alameda County, CA | |
| from San Mateo County, CA | |
| from San Francisco County, CA |
7.70% of this county's 2020 resident taxpayers moved to other counties in 2021 ($201,706 average adjusted gross income)
| Here: | 7.70% |
| California average: | 6.14% |
0.01% of residents moved to foreign countries ($110 average AGI)
Santa Clara County: 0.01% California average: 0.02%
Top counties to which taxpayers relocated from this county between 2020 and 2021:
| to Alameda County, CA | |
| to San Mateo County, CA | |
| to San Francisco County, CA |
| Businesses in Santa Clara, CA | ||||
| Name | Count | Name | Count | |
|---|---|---|---|---|
| 7-Eleven | 12 | Jones New York | 1 | |
| ALDO | 2 | Journeys | 1 | |
| AMF Bowling | 1 | Juicy Couture | 1 | |
| AT&T | 5 | KFC | 2 | |
| Abercrombie & Fitch | 1 | Kohl's | 1 | |
| Abercrombie Kids | 1 | Kroger | 1 | |
| Aeropostale | 1 | La-Z-Boy | 1 | |
| American Eagle Outfitters | 1 | Lane Bryant | 1 | |
| Ann Taylor | 2 | Lane Furniture | 2 | |
| Apple Store | 1 | LensCrafters | 2 | |
| AutoZone | 1 | Levi Strauss & Co. | 1 | |
| BMW | 1 | Little Caesars Pizza | 2 | |
| Baja Fresh Mexican Grill | 1 | Macy's | 1 | |
| Bakers | 1 | Marriott | 1 | |
| Banana Republic | 1 | MasterBrand Cabinets | 2 | |
| Baskin-Robbins | 2 | McDonald's | 6 | |
| Bath & Body Works | 1 | Motel 6 | 1 | |
| Bebe | 1 | Motherhood Maternity | 3 | |
| Bed Bath & Beyond | 1 | New Balance | 3 | |
| Best Western | 1 | New York & Co | 1 | |
| Big O Tires | 1 | Nike | 13 | |
| Blockbuster | 1 | Nissan | 1 | |
| Brookstone | 1 | OfficeMax | 1 | |
| Budget Car Rental | 1 | Old Navy | 1 | |
| Burger King | 2 | Pac Sun | 1 | |
| CVS | 3 | Panda Express | 2 | |
| Cache | 1 | Payless | 2 | |
| Carl\s Jr. | 4 | Penske | 1 | |
| Charlotte Russe | 1 | Pizza Hut | 1 | |
| Cinnabon | 1 | Popeyes | 1 | |
| Clarks | 1 | Pottery Barn | 1 | |
| Cold Stone Creamery | 2 | Pottery Barn Kids | 1 | |
| Coldwater Creek | 1 | Quality | 1 | |
| Costco | 1 | Quiznos | 4 | |
| Curves | 1 | RadioShack | 2 | |
| DHL | 3 | Ramada | 1 | |
| Days Inn | 1 | Red Robin | 1 | |
| Dennys | 2 | Rite Aid | 1 | |
| Discount Tire | 1 | Ruby Tuesday | 1 | |
| Domino's Pizza | 1 | SAS Shoes | 2 | |
| Econo Lodge | 1 | Safeway | 4 | |
| Eddie Bauer | 1 | Sephora | 1 | |
| El Pollo Loco | 1 | Skechers USA | 1 | |
| Express | 2 | Soma Intimates | 1 | |
| FedEx | 23 | Spencer Gifts | 1 | |
| Finish Line | 1 | Sprint Nextel | 3 | |
| Firestone Complete Auto Care | 1 | Staples | 1 | |
| Foot Locker | 1 | Starbucks | 14 | |
| Ford | 1 | Subway | 8 | |
| Forever 21 | 1 | T-Mobile | 5 | |
| GNC | 1 | T.J.Maxx | 1 | |
| GameStop | 3 | Taco Bell | 4 | |
| Gap | 1 | Talbots | 1 | |
| Gymboree | 1 | The Cheesecake Factory | 1 | |
| H&R Block | 3 | The Limited | 1 | |
| Haagen-Dazs | 1 | The Room Place | 2 | |
| Hilton | 3 | Torrid | 1 | |
| Holiday Inn | 3 | U-Haul | 4 | |
| Hollister Co. | 1 | UPS | 18 | |
| Home Depot | 1 | Vans | 5 | |
| HomeTown Buffet | 1 | Verizon Wireless | 3 | |
| Hot Topic | 1 | Victoria's Secret | 1 | |
| IHOP | 2 | Vons | 4 | |
| J. Jill | 1 | Walgreens | 3 | |
| J.Crew | 1 | Wet Seal | 1 | |
| Jamba Juice | 4 | |||
Strongest AM radio stations in Santa Clara:
- KLOK (1170 AM; 50 kW; SAN JOSE, CA; Owner: ENTRAVISION HOLDINGS, LLC)
- KGO (810 AM; 50 kW; SAN FRANCISCO, CA; Owner: KGO-AM RADIO, INC.)
- KSJX (1500 AM; 10 kW; SAN JOSE, CA; Owner: MULTICULTURAL RADIO BROADCASTING INC)
- KNBR (680 AM; 50 kW; SAN FRANCISCO, CA; Owner: KNBR LICO, INC.)
- KZSF (1370 AM; 5 kW; SAN JOSE, CA; Owner: CARLOS A. DUHARTE)
- KTCT (1050 AM; 50 kW; SAN MATEO, CA; Owner: SUSQUEHANNA RADIO CORP.)
- KFAX (1100 AM; 50 kW; SAN FRANCISCO, CA; Owner: GOLDEN GATE BROADCASTING CO, INC.)
- KLIV (1590 AM; 5 kW; SAN JOSE, CA; Owner: EMPIRE BROADCASTING COMPANY)
- KYCY (1550 AM; 50 kW; SAN FRANCISCO, CA; Owner: INFINITY BROADCASTING OPERATIONS, INC.)
- KVVN (1430 AM; 2 kW; SANTA CLARA, CA; Owner: ICBC BROADCAST HOLDINGS - CA, INC.)
- KTRB (860 AM; 50 kW; MODESTO, CA; Owner: PAPPAS RADIO OF CALIFORNIA, A CALIFORNIA LIMITED PARTNERSHIP)
- KSFB (1220 AM; 5 kW; PALO ALTO, CA; Owner: SCA-PALO ALTO, LLC)
- KIQI (1010 AM; 35 kW; SAN FRANCISCO, CA; Owner: RADIO UNICA OF SAN FRANCISCO LICENSE CORP.)
Strongest FM radio stations in Santa Clara:
- KFJC (89.7 FM; LOS ALTOS, CA; Owner: FOOTHILL-DE ANZA COMM. COLLEGE DIST.)
- KBAA (94.5 FM; GILROY, CA; Owner: INFINITY RADIO OPERATIONS INC.)
- KSQL (99.1 FM; SANTA CRUZ, CA; Owner: TMS LICENSE CALIFORNIA, INC)
- KKUP (91.5 FM; CUPERTINO, CA; Owner: ASSURANCE SCIENCES FOUNDATION)
- KBRG (100.3 FM; SAN JOSE, CA; Owner: ENTRAVISION HOLDINGS, LLC)
- KUFX (98.5 FM; SAN JOSE, CA; Owner: CITICASTERS LICENSES, L.P.)
- KRTY (95.3 FM; LOS GATOS, CA; Owner: KRTY, LTD.)
- KZBR-FM2 (95.7 FM; LIVERMORE, ETC., CA; Owner: BONNEVILLE HOLDING COMPANY)
- KFFG (97.7 FM; LOS ALTOS, CA; Owner: KFFG LICO, INC.)
- KKSF-FM1 (103.7 FM; PLEASANTON, ETC., CA; Owner: AMFM RADIO LICENSES, L.L.C.)
- KTEE (93.7 FM; FELTON, CA; Owner: MAPLETON COMMUNICATIONS, L.L.C.)
- KFRC-FM3 (99.7 FM; WALNUT CREEK, CA; Owner: INFINITY KFRC-FM, INC.)
- KZBR-FM1 (95.7 FM; WALNUT CREEK, CA; Owner: BONNEVILLE HOLDING COMPANY)
- KBLX-FM2 (102.9 FM; PLEASANTON, CA; Owner: ICBC BROADCAST HOLDINGS -CA, INC.)
- KSOL-FM3 (98.9 FM; PLEASANTON, CA; Owner: TMS LICENSE CALIFORNIA, INC)
- K238AC (95.5 FM; SALIDA, CA; Owner: FAMILY STATIONS, INC.)
- KISQ-FM3 (98.1 FM; CONCORD, CA; Owner: AMFM RADIO LICENSES, L.L.C.)
- KMEL-FM1 (106.1 FM; CONCORD, CA; Owner: AMFM RADIO LICENSES, L.L.C.)
- KEMR (105.7 FM; SANTA CLARA, CA; Owner: HBC LICENSE CORPORATION)
- KSCU (103.3 FM; SANTA CLARA, CA; Owner: SANTA CLARA COLLEGE)
TV broadcast stations around Santa Clara:
- KBIT-CA (Channel 28; SAN FRANCISCO, ETC., CA; Owner: POLAR BROADCASTING, INC.)
- KICU-TV (Channel 36; SAN JOSE, CA; Owner: KTVU PARTNERSHIP)
- KTEH (Channel 54; SAN JOSE, CA; Owner: KTEH FOUNDATION)
- KQED (Channel 9; SAN FRANCISCO, CA; Owner: KQED, INC.)
- KDTV (Channel 14; SAN FRANCISCO, CA; Owner: KDTV LICENSE PARTNERSHIP, G.P.)
- KSTS (Channel 48; SAN JOSE, CA; Owner: TELEMUNDO OF NORTHERN CALIFORNIA LICENSE CORP.)
- KGO-TV (Channel 7; SAN FRANCISCO, CA; Owner: KGO TELEVISION, INC.)
- KPIX-TV (Channel 5; SAN FRANCISCO, CA; Owner: CBS BROADCASTING INC.)
- KTVU (Channel 2; OAKLAND, CA; Owner: KTVU PARTNERSHIP)
- KNTV (Channel 11; SAN JOSE, CA; Owner: KNTV LICENSE, INC.)
- KRON-TV (Channel 4; SAN FRANCISCO, CA; Owner: YOUNG BROADCASTING OF SAN FRANCISCO, INC.)
- KMTP-TV (Channel 32; SAN FRANCISCO, CA; Owner: MINORITY TELEVISION PROJECT)
- KBHK-TV (Channel 44; SAN FRANCISCO, CA; Owner: VIACOM TELEVISION STATIONS GROUP OF SAN FRANCISCO INC.)
- KBWB (Channel 20; SAN FRANCISCO, CA; Owner: KBWB LICENSE, INC.)
- KFSF (Channel 66; VALLEJO, CA; Owner: TELEFUTURA SAN FRANCISCO LLC)
- KAXT-CA (Channel 22; SANTA CLARA-SAN JOSE, CA; Owner: LINDA K. TRUMBLY)
- KKPX (Channel 65; SAN JOSE, CA; Owner: PAXSON SAN JOSE LICENSE, INC.)
- KCSM-TV (Channel 60; SAN MATEO, CA; Owner: SAN MATEO COUNTY COMMUNITY COLLEGE DISTRICT)
- National Bridge Inventory (NBI) Statistics
- 73Number of bridges
- 604ft / 184mTotal length
- $4,729,000Total costs
- 2,386,012Total average daily traffic
- 90,182Total average daily truck traffic
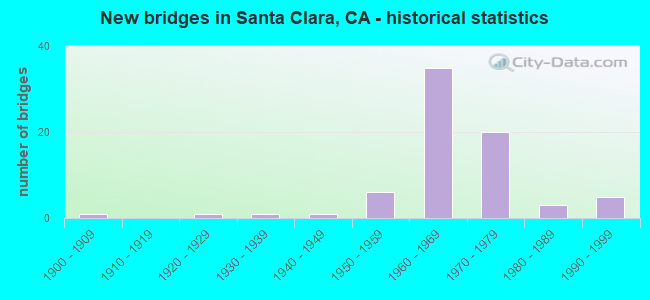
- New bridges - historical statistics
- 11900-1909
- 11920-1929
- 11930-1939
- 11940-1949
- 61950-1959
- 351960-1969
- 201970-1979
- 31980-1989
- 51990-1999
FCC Registered Commercial Land Mobile Towers: 1 (See the full list of FCC Registered Commercial Land Mobile Towers in Santa Clara, CA)
FCC Registered Private Land Mobile Towers: 6 (See the full list of FCC Registered Private Land Mobile Towers)
FCC Registered Broadcast Land Mobile Towers: 95 (See the full list of FCC Registered Broadcast Land Mobile Towers)
FCC Registered Microwave Towers: 278 (See the full list of FCC Registered Microwave Towers in this town)
FCC Registered Paging Towers: 11 (See the full list of FCC Registered Paging Towers)
FCC Registered Amateur Radio Licenses: 1,100 (See the full list of FCC Registered Amateur Radio Licenses in Santa Clara)
FAA Registered Aircraft Manufacturers and Dealers: 1 (See the full list of FAA Registered Manufacturers and Dealers in Santa Clara)
FAA Registered Aircraft: 167 (See the full list of FAA Registered Aircraft)
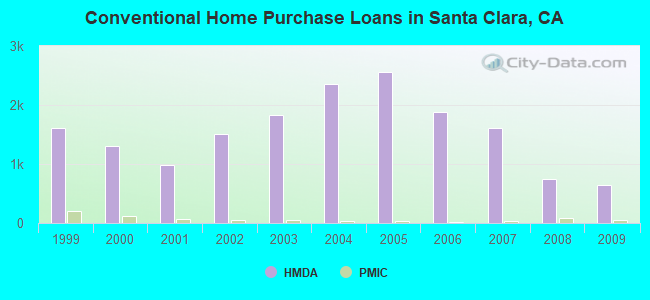
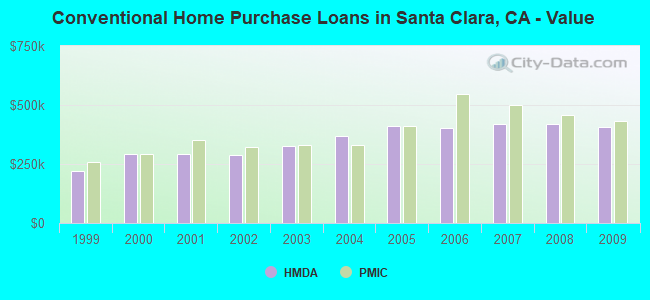
| Home Mortgage Disclosure Act Aggregated Statistics For Year 2009 (Based on 19 full and 7 partial tracts) | ||||||||||||||
| A) FHA, FSA/RHS & VA Home Purchase Loans | B) Conventional Home Purchase Loans | C) Refinancings | D) Home Improvement Loans | E) Loans on Dwellings For 5+ Families | F) Non-occupant Loans on < 5 Family Dwellings (A B C & D) | G) Loans On Manufactured Home Dwelling (A B C & D) | ||||||||
|---|---|---|---|---|---|---|---|---|---|---|---|---|---|---|
| Number | Average Value | Number | Average Value | Number | Average Value | Number | Average Value | Number | Average Value | Number | Average Value | Number | Average Value | |
| LOANS ORIGINATED | 129 | $497,979 | 652 | $407,332 | 3,395 | $363,746 | 93 | $278,178 | 8 | $785,908 | 195 | $313,846 | 0 | $0 |
| APPLICATIONS APPROVED, NOT ACCEPTED | 12 | $478,721 | 91 | $404,153 | 433 | $399,586 | 12 | $246,715 | 0 | $0 | 24 | $319,017 | 0 | $0 |
| APPLICATIONS DENIED | 24 | $452,221 | 123 | $400,503 | 796 | $425,529 | 28 | $256,861 | 3 | $663,540 | 73 | $348,134 | 0 | $0 |
| APPLICATIONS WITHDRAWN | 18 | $463,283 | 90 | $419,745 | 522 | $399,205 | 14 | $270,851 | 2 | $2,030,265 | 37 | $323,497 | 1 | $80,000 |
| FILES CLOSED FOR INCOMPLETENESS | 3 | $404,637 | 9 | $431,069 | 143 | $413,947 | 9 | $239,702 | 0 | $0 | 8 | $296,549 | 0 | $0 |
Detailed mortgage data for all 26 tracts in Santa Clara, CA
| Private Mortgage Insurance Companies Aggregated Statistics For Year 2009 (Based on 18 full and 6 partial tracts) | ||||
| A) Conventional Home Purchase Loans | B) Refinancings | |||
|---|---|---|---|---|
| Number | Average Value | Number | Average Value | |
| LOANS ORIGINATED | 54 | $430,428 | 18 | $434,661 |
| APPLICATIONS APPROVED, NOT ACCEPTED | 16 | $350,139 | 13 | $450,609 |
| APPLICATIONS DENIED | 18 | $489,284 | 8 | $396,930 |
| APPLICATIONS WITHDRAWN | 4 | $439,732 | 2 | $417,000 |
| FILES CLOSED FOR INCOMPLETENESS | 1 | $309,300 | 0 | $0 |
2005 - 2018 National Fire Incident Reporting System (NFIRS) incidents
- Fire incident types reported to NFIRS in Santa Clara, CA
- 5247.3%Structure Fires
- 3430.9%Outside Fires
- 1210.9%Mobile Property/Vehicle Fires
- 1210.9%Other
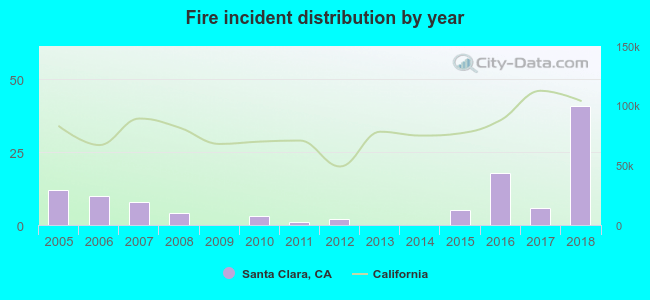 According to the data from the years 2005 - 2018 the average number of fires per year is 8. The highest number of fires - 41 took place in 2018, and the least - 0 in 2009. The data has a growing trend.
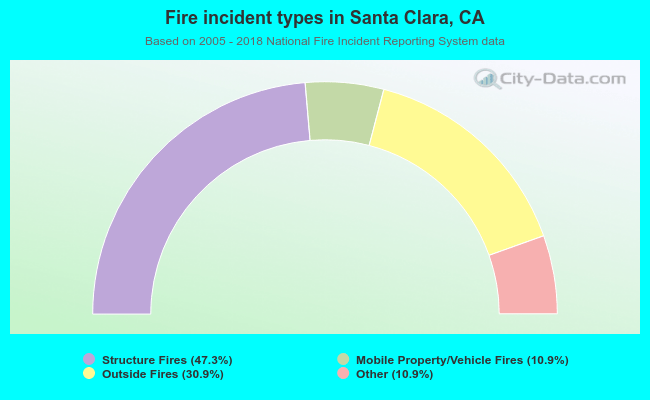 When looking into fire subcategories, the most incidents belonged to: Structure Fires (47.3%), and Outside Fires (30.9%).
Fire-safe hotels and motels in Santa Clara, California:
- The Woodcrest Hotel, 5415 Stevens CRK Blvd, Santa Clara, California 95051 , Phone: (408) 446-9636, Fax: (408) 446-9739
- Embassy Suites Hotel Santa Clara/Silicon Valley, 2885 Lakeside Dr, Santa Clara, California 95054 , Phone: (408) 496-6400, Fax: (408) 492-1875
- Driftwood, 3477 El Camino Real, Santa Clara, California 95051 , Phone: (408) 984-3364, Fax: (408) 244-5561
- Hyatt Regency Santa Clara, 5101 Great America Pkwy, Santa Clara, California 95054 , Phone: (408) 200-1234, Fax: (408) 980-3990
- E Z 8 Motels Inc, 3550 El Camino Real, Santa Clara, California 95051 , Phone: (408) 246-3119, Fax: (408) 246-2106
- The Plaza Suites Silicon Valley, 3100 Lakeside Dr, Santa Clara, California 95054 , Phone: (408) 748-9800, Fax: (408) 748-1476
- Motel 6, 3208 El Camino Real, Santa Clara, California 95051 , Phone: (408) 241-0200, Fax: (408) 243-8237
- Pacific Inn Of Santa Clara, 2505 The Alameda, Santa Clara, California 95050 , Phone: (408) 244-1040, Fax: (408) 244-1045
- 13 other hotels and motels
| Most common first names in Santa Clara, CA among deceased individuals | ||
| Name | Count | Lived (average) |
|---|---|---|
| Mary | 508 | 79.9 years |
| John | 487 | 74.3 years |
| Robert | 282 | 68.0 years |
| William | 277 | 72.9 years |
| Joseph | 257 | 73.8 years |
| James | 245 | 70.2 years |
| Frank | 216 | 75.4 years |
| George | 210 | 75.4 years |
| Charles | 182 | 73.9 years |
| Helen | 181 | 80.2 years |
| Most common last names in Santa Clara, CA among deceased individuals | ||
| Last name | Count | Lived (average) |
|---|---|---|
| Smith | 108 | 75.7 years |
| Johnson | 94 | 76.3 years |
| Silva | 82 | 78.0 years |
| Brown | 72 | 73.5 years |
| Miller | 66 | 76.4 years |
| Anderson | 55 | 75.6 years |
| Jones | 54 | 72.1 years |
| Martin | 53 | 76.0 years |
| Davis | 52 | 74.5 years |
| Freitas | 50 | 76.0 years |
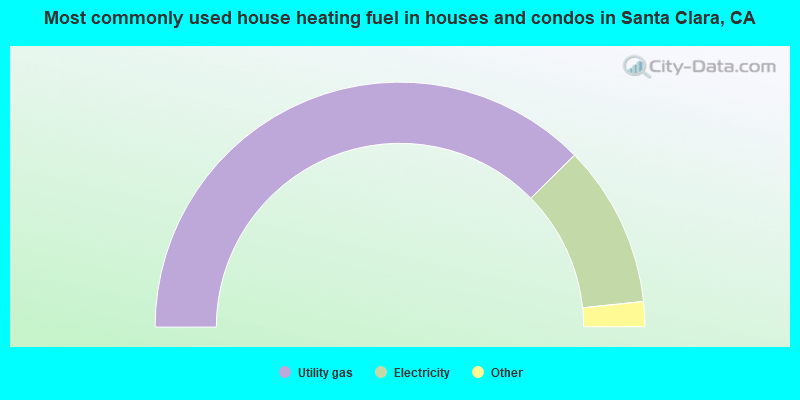
- 75.2%Utility gas
- 21.4%Electricity
- 2.2%Bottled, tank, or LP gas
- 0.8%No fuel used
- 0.2%Solar energy
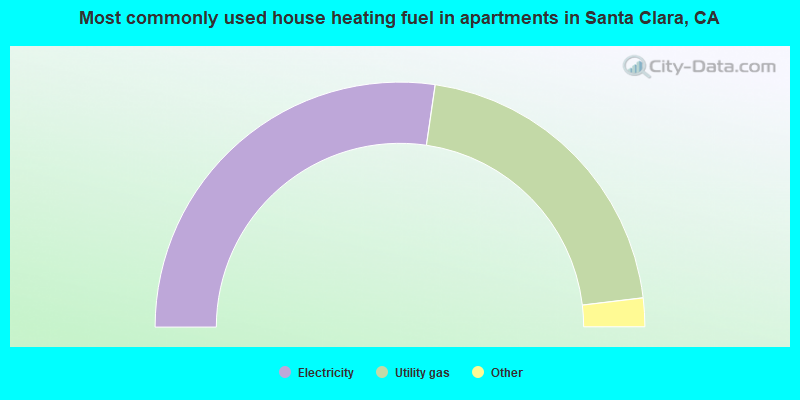
- 54.6%Electricity
- 41.6%Utility gas
- 2.3%No fuel used
- 1.5%Bottled, tank, or LP gas
Santa Clara compared to California state average:
- Median household income above state average.
- Median house value above state average.
- Unemployed percentage significantly below state average.
- Black race population percentage significantly below state average.
- Hispanic race population percentage below state average.
- Foreign-born population percentage above state average.
- Percentage of population with a bachelor's degree or higher significantly above state average.
Santa Clara, CA compared to other similar cities:
Santa Clara on our top lists:
- #5 on the list of "Top 101 cities with largest percentage of males in occupations: architecture and engineering occupations (population 50,000+)"
- #6 on the list of "Top 101 cities with largest percentage of males in occupations: computer and mathematical occupations (population 50,000+)"
- #9 on the list of "Top 101 cities with largest percentage of females in occupations: computer and mathematical occupations (population 50,000+)"
- #9 on the list of "Top 101 cities with largest percentage of females in industries: information (population 50,000+)"
- #9 on the list of "Top 100 cities with highest median household income and median resident age less than 35 (pop. 50,000+)"
- #10 on the list of "Top 101 cities with the lowest number of murders per 100,000 residents (population 50,000+)"
- #12 on the list of "Top 101 cities with the largest differences between morning and afternoon humidity (population 50,000+)"
- #12 on the list of "Top 101 cities with the largest humidity differences during a year (population 50,000+)"
- #17 on the list of "Top 101 cities with largest percentage of females in occupations: architecture and engineering occupations (population 50,000+)"
- #19 on the list of "Top 101 cities that people commute into (largest positive percentage daily daytime population change due to commuting) (population 50,000+)"
- #19 on the list of "Top 101 cities with largest percentage of males in industries: information (population 50,000+)"
- #20 on the list of "Top 101 cities with the largest racial income disparity between any two races with at least 2,000 householders"
- #20 on the list of "Top 101 cities with largest percentage of males in industries: professional, scientific, and technical services (population 50,000+)"
- #29 on the list of "Top 101 cities with the most residents born in Born at sea (population 500+)"
- #29 on the list of "Top 101 cities with largest percentage of females in industries: manufacturing (population 50,000+)"
- #33 on the list of "Top 101 cities with largest percentage of females in industries: professional, scientific, and technical services (population 50,000+)"
- #33 on the list of "Top 101 cities with largest percentage of males in industries: manufacturing (population 50,000+)"
- #37 on the list of "Top 101 cities with the most people having Master's or Doctorate degrees (population 50,000+)"
- #37 on the list of "Top 100 cities with highest median house value (pop. 50,000+)"
- #45 on the list of "Top 100 cities with highest percentage of foreign-born residents (pop. 50,000+)"
- #5 on the list of "Top 101 counties with the highest percentage of residents that visited a dentist within the past year"
- #9 on the list of "Top 101 counties with the lowest percentage of residents that smoked 100+ cigarettes in their lives"
- #16 on the list of "Top 101 counties with the most Other adherents"
- #16 on the list of "Top 101 counties with the most Catholic adherents"
- #17 on the list of "Top 101 counties with the highest percentage of residents that drank alcohol in the past 30 days"

|
|
Total of 23424 patent applications in 2008-2024.