South Jordan, Utah Submit your own pictures of this city and show them to the world
OSM Map
General Map
Google Map
MSN Map
OSM Map
General Map
Google Map
MSN Map
OSM Map
General Map
Google Map
MSN Map
OSM Map
General Map
Google Map
MSN Map
Please wait while loading the map...
Population in 2022: 83,513 (99% urban, 1% rural). Population change since 2000: +183.7%Males: 40,494 Females: 43,019
March 2022 cost of living index in South Jordan: 93.2 (less than average, U.S. average is 100) Percentage of residents living in poverty in 2022: 2.6%for White Non-Hispanic residents , 3.6% for Black residents , 4.8% for Hispanic or Latino residents , 5.0% for American Indian residents , 6.3% for other race residents , 2.7% for two or more races residents )
Profiles of local businesses
Business Search - 14 Million verified businesses
Data:
Median household income ($)
Median household income (% change since 2000)
Household income diversity
Ratio of average income to average house value (%)
Ratio of average income to average rent
Median household income ($) - White
Median household income ($) - Black or African American
Median household income ($) - Asian
Median household income ($) - Hispanic or Latino
Median household income ($) - American Indian and Alaska Native
Median household income ($) - Multirace
Median household income ($) - Other Race
Median household income for houses/condos with a mortgage ($)
Median household income for apartments without a mortgage ($)
Races - White alone (%)
Races - White alone (% change since 2000)
Races - Black alone (%)
Races - Black alone (% change since 2000)
Races - American Indian alone (%)
Races - American Indian alone (% change since 2000)
Races - Asian alone (%)
Races - Asian alone (% change since 2000)
Races - Hispanic (%)
Races - Hispanic (% change since 2000)
Races - Native Hawaiian and Other Pacific Islander alone (%)
Races - Native Hawaiian and Other Pacific Islander alone (% change since 2000)
Races - Two or more races (%)
Races - Two or more races (% change since 2000)
Races - Other race alone (%)
Races - Other race alone (% change since 2000)
Racial diversity
Unemployment (%)
Unemployment (% change since 2000)
Unemployment (%) - White
Unemployment (%) - Black or African American
Unemployment (%) - Asian
Unemployment (%) - Hispanic or Latino
Unemployment (%) - American Indian and Alaska Native
Unemployment (%) - Multirace
Unemployment (%) - Other Race
Population density (people per square mile)
Population - Males (%)
Population - Females (%)
Population - Males (%) - White
Population - Males (%) - Black or African American
Population - Males (%) - Asian
Population - Males (%) - Hispanic or Latino
Population - Males (%) - American Indian and Alaska Native
Population - Males (%) - Multirace
Population - Males (%) - Other Race
Population - Females (%) - White
Population - Females (%) - Black or African American
Population - Females (%) - Asian
Population - Females (%) - Hispanic or Latino
Population - Females (%) - American Indian and Alaska Native
Population - Females (%) - Multirace
Population - Females (%) - Other Race
Coronavirus confirmed cases (Apr 19, 2024)
Deaths caused by coronavirus (Apr 19, 2024)
Coronavirus confirmed cases (per 100k population) (Apr 19, 2024)
Deaths caused by coronavirus (per 100k population) (Apr 19, 2024)
Daily increase in number of cases (Apr 19, 2024)
Weekly increase in number of cases (Apr 19, 2024)
Cases doubled (in days) (Apr 19, 2024)
Hospitalized patients (Apr 18, 2022)
Negative test results (Apr 18, 2022)
Total test results (Apr 18, 2022)
COVID Vaccine doses distributed (per 100k population) (Sep 19, 2023)
COVID Vaccine doses administered (per 100k population) (Sep 19, 2023)
COVID Vaccine doses distributed (Sep 19, 2023)
COVID Vaccine doses administered (Sep 19, 2023)
Likely homosexual households (%)
Likely homosexual households (% change since 2000)
Likely homosexual households - Lesbian couples (%)
Likely homosexual households - Lesbian couples (% change since 2000)
Likely homosexual households - Gay men (%)
Likely homosexual households - Gay men (% change since 2000)
Cost of living index
Median gross rent ($)
Median contract rent ($)
Median monthly housing costs ($)
Median house or condo value ($)
Median house or condo value ($ change since 2000)
Mean house or condo value by units in structure - 1, detached ($)
Mean house or condo value by units in structure - 1, attached ($)
Mean house or condo value by units in structure - 2 ($)
Mean house or condo value by units in structure by units in structure - 3 or 4 ($)
Mean house or condo value by units in structure - 5 or more ($)
Mean house or condo value by units in structure - Boat, RV, van, etc. ($)
Mean house or condo value by units in structure - Mobile home ($)
Median house or condo value ($) - White
Median house or condo value ($) - Black or African American
Median house or condo value ($) - Asian
Median house or condo value ($) - Hispanic or Latino
Median house or condo value ($) - American Indian and Alaska Native
Median house or condo value ($) - Multirace
Median house or condo value ($) - Other Race
Median resident age
Resident age diversity
Median resident age - Males
Median resident age - Females
Median resident age - White
Median resident age - Black or African American
Median resident age - Asian
Median resident age - Hispanic or Latino
Median resident age - American Indian and Alaska Native
Median resident age - Multirace
Median resident age - Other Race
Median resident age - Males - White
Median resident age - Males - Black or African American
Median resident age - Males - Asian
Median resident age - Males - Hispanic or Latino
Median resident age - Males - American Indian and Alaska Native
Median resident age - Males - Multirace
Median resident age - Males - Other Race
Median resident age - Females - White
Median resident age - Females - Black or African American
Median resident age - Females - Asian
Median resident age - Females - Hispanic or Latino
Median resident age - Females - American Indian and Alaska Native
Median resident age - Females - Multirace
Median resident age - Females - Other Race
Commute - mean travel time to work (minutes)
Travel time to work - Less than 5 minutes (%)
Travel time to work - Less than 5 minutes (% change since 2000)
Travel time to work - 5 to 9 minutes (%)
Travel time to work - 5 to 9 minutes (% change since 2000)
Travel time to work - 10 to 19 minutes (%)
Travel time to work - 10 to 19 minutes (% change since 2000)
Travel time to work - 20 to 29 minutes (%)
Travel time to work - 20 to 29 minutes (% change since 2000)
Travel time to work - 30 to 39 minutes (%)
Travel time to work - 30 to 39 minutes (% change since 2000)
Travel time to work - 40 to 59 minutes (%)
Travel time to work - 40 to 59 minutes (% change since 2000)
Travel time to work - 60 to 89 minutes (%)
Travel time to work - 60 to 89 minutes (% change since 2000)
Travel time to work - 90 or more minutes (%)
Travel time to work - 90 or more minutes (% change since 2000)
Marital status - Never married (%)
Marital status - Now married (%)
Marital status - Separated (%)
Marital status - Widowed (%)
Marital status - Divorced (%)
Median family income ($)
Median family income (% change since 2000)
Median non-family income ($)
Median non-family income (% change since 2000)
Median per capita income ($)
Median per capita income (% change since 2000)
Median family income ($) - White
Median family income ($) - Black or African American
Median family income ($) - Asian
Median family income ($) - Hispanic or Latino
Median family income ($) - American Indian and Alaska Native
Median family income ($) - Multirace
Median family income ($) - Other Race
Median year house/condo built
Median year apartment built
Year house built - Built 2005 or later (%)
Year house built - Built 2000 to 2004 (%)
Year house built - Built 1990 to 1999 (%)
Year house built - Built 1980 to 1989 (%)
Year house built - Built 1970 to 1979 (%)
Year house built - Built 1960 to 1969 (%)
Year house built - Built 1950 to 1959 (%)
Year house built - Built 1940 to 1949 (%)
Year house built - Built 1939 or earlier (%)
Average household size
Household density (households per square mile)
Average household size - White
Average household size - Black or African American
Average household size - Asian
Average household size - Hispanic or Latino
Average household size - American Indian and Alaska Native
Average household size - Multirace
Average household size - Other Race
Occupied housing units (%)
Vacant housing units (%)
Owner occupied housing units (%)
Renter occupied housing units (%)
Vacancy status - For rent (%)
Vacancy status - For sale only (%)
Vacancy status - Rented or sold, not occupied (%)
Vacancy status - For seasonal, recreational, or occasional use (%)
Vacancy status - For migrant workers (%)
Vacancy status - Other vacant (%)
Residents with income below the poverty level (%)
Residents with income below 50% of the poverty level (%)
Children below poverty level (%)
Poor families by family type - Married-couple family (%)
Poor families by family type - Male, no wife present (%)
Poor families by family type - Female, no husband present (%)
Poverty status for native-born residents (%)
Poverty status for foreign-born residents (%)
Poverty among high school graduates not in families (%)
Poverty among people who did not graduate high school not in families (%)
Residents with income below the poverty level (%) - White
Residents with income below the poverty level (%) - Black or African American
Residents with income below the poverty level (%) - Asian
Residents with income below the poverty level (%) - Hispanic or Latino
Residents with income below the poverty level (%) - American Indian and Alaska Native
Residents with income below the poverty level (%) - Multirace
Residents with income below the poverty level (%) - Other Race
Air pollution - Air Quality Index (AQI)
Air pollution - CO
Air pollution - NO2
Air pollution - SO2
Air pollution - Ozone
Air pollution - PM10
Air pollution - PM25
Air pollution - Pb
Crime - Murders per 100,000 population
Crime - Rapes per 100,000 population
Crime - Robberies per 100,000 population
Crime - Assaults per 100,000 population
Crime - Burglaries per 100,000 population
Crime - Thefts per 100,000 population
Crime - Auto thefts per 100,000 population
Crime - Arson per 100,000 population
Crime - City-data.com crime index
Crime - Violent crime index
Crime - Property crime index
Crime - Murders per 100,000 population (5 year average)
Crime - Rapes per 100,000 population (5 year average)
Crime - Robberies per 100,000 population (5 year average)
Crime - Assaults per 100,000 population (5 year average)
Crime - Burglaries per 100,000 population (5 year average)
Crime - Thefts per 100,000 population (5 year average)
Crime - Auto thefts per 100,000 population (5 year average)
Crime - Arson per 100,000 population (5 year average)
Crime - City-data.com crime index (5 year average)
Crime - Violent crime index (5 year average)
Crime - Property crime index (5 year average)
1996 Presidential Elections Results (%) - Democratic Party (Clinton)
1996 Presidential Elections Results (%) - Republican Party (Dole)
1996 Presidential Elections Results (%) - Other
2000 Presidential Elections Results (%) - Democratic Party (Gore)
2000 Presidential Elections Results (%) - Republican Party (Bush)
2000 Presidential Elections Results (%) - Other
2004 Presidential Elections Results (%) - Democratic Party (Kerry)
2004 Presidential Elections Results (%) - Republican Party (Bush)
2004 Presidential Elections Results (%) - Other
2008 Presidential Elections Results (%) - Democratic Party (Obama)
2008 Presidential Elections Results (%) - Republican Party (McCain)
2008 Presidential Elections Results (%) - Other
2012 Presidential Elections Results (%) - Democratic Party (Obama)
2012 Presidential Elections Results (%) - Republican Party (Romney)
2012 Presidential Elections Results (%) - Other
2016 Presidential Elections Results (%) - Democratic Party (Clinton)
2016 Presidential Elections Results (%) - Republican Party (Trump)
2016 Presidential Elections Results (%) - Other
2020 Presidential Elections Results (%) - Democratic Party (Biden)
2020 Presidential Elections Results (%) - Republican Party (Trump)
2020 Presidential Elections Results (%) - Other
Ancestries Reported - Arab (%)
Ancestries Reported - Czech (%)
Ancestries Reported - Danish (%)
Ancestries Reported - Dutch (%)
Ancestries Reported - English (%)
Ancestries Reported - French (%)
Ancestries Reported - French Canadian (%)
Ancestries Reported - German (%)
Ancestries Reported - Greek (%)
Ancestries Reported - Hungarian (%)
Ancestries Reported - Irish (%)
Ancestries Reported - Italian (%)
Ancestries Reported - Lithuanian (%)
Ancestries Reported - Norwegian (%)
Ancestries Reported - Polish (%)
Ancestries Reported - Portuguese (%)
Ancestries Reported - Russian (%)
Ancestries Reported - Scotch-Irish (%)
Ancestries Reported - Scottish (%)
Ancestries Reported - Slovak (%)
Ancestries Reported - Subsaharan African (%)
Ancestries Reported - Swedish (%)
Ancestries Reported - Swiss (%)
Ancestries Reported - Ukrainian (%)
Ancestries Reported - United States (%)
Ancestries Reported - Welsh (%)
Ancestries Reported - West Indian (%)
Ancestries Reported - Other (%)
Educational Attainment - No schooling completed (%)
Educational Attainment - Less than high school (%)
Educational Attainment - High school or equivalent (%)
Educational Attainment - Less than 1 year of college (%)
Educational Attainment - 1 or more years of college (%)
Educational Attainment - Associate degree (%)
Educational Attainment - Bachelor's degree (%)
Educational Attainment - Master's degree (%)
Educational Attainment - Professional school degree (%)
Educational Attainment - Doctorate degree (%)
School Enrollment - Nursery, preschool (%)
School Enrollment - Kindergarten (%)
School Enrollment - Grade 1 to 4 (%)
School Enrollment - Grade 5 to 8 (%)
School Enrollment - Grade 9 to 12 (%)
School Enrollment - College undergrad (%)
School Enrollment - Graduate or professional (%)
School Enrollment - Not enrolled in school (%)
School enrollment - Public schools (%)
School enrollment - Private schools (%)
School enrollment - Not enrolled (%)
Median number of rooms in houses and condos
Median number of rooms in apartments
Housing units lacking complete plumbing facilities (%)
Housing units lacking complete kitchen facilities (%)
Density of houses
Urban houses (%)
Rural houses (%)
Households with people 60 years and over (%)
Households with people 65 years and over (%)
Households with people 75 years and over (%)
Households with one or more nonrelatives (%)
Households with no nonrelatives (%)
Population in households (%)
Family households (%)
Nonfamily households (%)
Population in families (%)
Family households with own children (%)
Median number of bedrooms in owner occupied houses
Mean number of bedrooms in owner occupied houses
Median number of bedrooms in renter occupied houses
Mean number of bedrooms in renter occupied houses
Median number of vehichles in owner occupied houses
Mean number of vehichles in owner occupied houses
Median number of vehichles in renter occupied houses
Mean number of vehichles in renter occupied houses
Mortgage status - with mortgage (%)
Mortgage status - with second mortgage (%)
Mortgage status - with home equity loan (%)
Mortgage status - with both second mortgage and home equity loan (%)
Mortgage status - without a mortgage (%)
Average family size
Average family size - White
Average family size - Black or African American
Average family size - Asian
Average family size - Hispanic or Latino
Average family size - American Indian and Alaska Native
Average family size - Multirace
Average family size - Other Race
Geographical mobility - Same house 1 year ago (%)
Geographical mobility - Moved within same county (%)
Geographical mobility - Moved from different county within same state (%)
Geographical mobility - Moved from different state (%)
Geographical mobility - Moved from abroad (%)
Place of birth - Born in state of residence (%)
Place of birth - Born in other state (%)
Place of birth - Native, outside of US (%)
Place of birth - Foreign born (%)
Housing units in structures - 1, detached (%)
Housing units in structures - 1, attached (%)
Housing units in structures - 2 (%)
Housing units in structures - 3 or 4 (%)
Housing units in structures - 5 to 9 (%)
Housing units in structures - 10 to 19 (%)
Housing units in structures - 20 to 49 (%)
Housing units in structures - 50 or more (%)
Housing units in structures - Mobile home (%)
Housing units in structures - Boat, RV, van, etc. (%)
House/condo owner moved in on average (years ago)
Renter moved in on average (years ago)
Year householder moved into unit - Moved in 1999 to March 2000 (%)
Year householder moved into unit - Moved in 1995 to 1998 (%)
Year householder moved into unit - Moved in 1990 to 1994 (%)
Year householder moved into unit - Moved in 1980 to 1989 (%)
Year householder moved into unit - Moved in 1970 to 1979 (%)
Year householder moved into unit - Moved in 1969 or earlier (%)
Means of transportation to work - Drove car alone (%)
Means of transportation to work - Carpooled (%)
Means of transportation to work - Public transportation (%)
Means of transportation to work - Bus or trolley bus (%)
Means of transportation to work - Streetcar or trolley car (%)
Means of transportation to work - Subway or elevated (%)
Means of transportation to work - Railroad (%)
Means of transportation to work - Ferryboat (%)
Means of transportation to work - Taxicab (%)
Means of transportation to work - Motorcycle (%)
Means of transportation to work - Bicycle (%)
Means of transportation to work - Walked (%)
Means of transportation to work - Other means (%)
Working at home (%)
Industry diversity
Most Common Industries - Agriculture, forestry, fishing and hunting, and mining (%)
Most Common Industries - Agriculture, forestry, fishing and hunting (%)
Most Common Industries - Mining, quarrying, and oil and gas extraction (%)
Most Common Industries - Construction (%)
Most Common Industries - Manufacturing (%)
Most Common Industries - Wholesale trade (%)
Most Common Industries - Retail trade (%)
Most Common Industries - Transportation and warehousing, and utilities (%)
Most Common Industries - Transportation and warehousing (%)
Most Common Industries - Utilities (%)
Most Common Industries - Information (%)
Most Common Industries - Finance and insurance, and real estate and rental and leasing (%)
Most Common Industries - Finance and insurance (%)
Most Common Industries - Real estate and rental and leasing (%)
Most Common Industries - Professional, scientific, and management, and administrative and waste management services (%)
Most Common Industries - Professional, scientific, and technical services (%)
Most Common Industries - Management of companies and enterprises (%)
Most Common Industries - Administrative and support and waste management services (%)
Most Common Industries - Educational services, and health care and social assistance (%)
Most Common Industries - Educational services (%)
Most Common Industries - Health care and social assistance (%)
Most Common Industries - Arts, entertainment, and recreation, and accommodation and food services (%)
Most Common Industries - Arts, entertainment, and recreation (%)
Most Common Industries - Accommodation and food services (%)
Most Common Industries - Other services, except public administration (%)
Most Common Industries - Public administration (%)
Occupation diversity
Most Common Occupations - Management, business, science, and arts occupations (%)
Most Common Occupations - Management, business, and financial occupations (%)
Most Common Occupations - Management occupations (%)
Most Common Occupations - Business and financial operations occupations (%)
Most Common Occupations - Computer, engineering, and science occupations (%)
Most Common Occupations - Computer and mathematical occupations (%)
Most Common Occupations - Architecture and engineering occupations (%)
Most Common Occupations - Life, physical, and social science occupations (%)
Most Common Occupations - Education, legal, community service, arts, and media occupations (%)
Most Common Occupations - Community and social service occupations (%)
Most Common Occupations - Legal occupations (%)
Most Common Occupations - Education, training, and library occupations (%)
Most Common Occupations - Arts, design, entertainment, sports, and media occupations (%)
Most Common Occupations - Healthcare practitioners and technical occupations (%)
Most Common Occupations - Health diagnosing and treating practitioners and other technical occupations (%)
Most Common Occupations - Health technologists and technicians (%)
Most Common Occupations - Service occupations (%)
Most Common Occupations - Healthcare support occupations (%)
Most Common Occupations - Protective service occupations (%)
Most Common Occupations - Fire fighting and prevention, and other protective service workers including supervisors (%)
Most Common Occupations - Law enforcement workers including supervisors (%)
Most Common Occupations - Food preparation and serving related occupations (%)
Most Common Occupations - Building and grounds cleaning and maintenance occupations (%)
Most Common Occupations - Personal care and service occupations (%)
Most Common Occupations - Sales and office occupations (%)
Most Common Occupations - Sales and related occupations (%)
Most Common Occupations - Office and administrative support occupations (%)
Most Common Occupations - Natural resources, construction, and maintenance occupations (%)
Most Common Occupations - Farming, fishing, and forestry occupations (%)
Most Common Occupations - Construction and extraction occupations (%)
Most Common Occupations - Installation, maintenance, and repair occupations (%)
Most Common Occupations - Production, transportation, and material moving occupations (%)
Most Common Occupations - Production occupations (%)
Most Common Occupations - Transportation occupations (%)
Most Common Occupations - Material moving occupations (%)
People in Group quarters - Institutionalized population (%)
People in Group quarters - Correctional institutions (%)
People in Group quarters - Federal prisons and detention centers (%)
People in Group quarters - Halfway houses (%)
People in Group quarters - Local jails and other confinement facilities (including police lockups) (%)
People in Group quarters - Military disciplinary barracks (%)
People in Group quarters - State prisons (%)
People in Group quarters - Other types of correctional institutions (%)
People in Group quarters - Nursing homes (%)
People in Group quarters - Hospitals/wards, hospices, and schools for the handicapped (%)
People in Group quarters - Hospitals/wards and hospices for chronically ill (%)
People in Group quarters - Hospices or homes for chronically ill (%)
People in Group quarters - Military hospitals or wards for chronically ill (%)
People in Group quarters - Other hospitals or wards for chronically ill (%)
People in Group quarters - Hospitals or wards for drug/alcohol abuse (%)
People in Group quarters - Mental (Psychiatric) hospitals or wards (%)
People in Group quarters - Schools, hospitals, or wards for the mentally retarded (%)
People in Group quarters - Schools, hospitals, or wards for the physically handicapped (%)
People in Group quarters - Institutions for the deaf (%)
People in Group quarters - Institutions for the blind (%)
People in Group quarters - Orthopedic wards and institutions for the physically handicapped (%)
People in Group quarters - Wards in general hospitals for patients who have no usual home elsewhere (%)
People in Group quarters - Wards in military hospitals for patients who have no usual home elsewhere (%)
People in Group quarters - Juvenile institutions (%)
People in Group quarters - Long-term care (%)
People in Group quarters - Homes for abused, dependent, and neglected children (%)
People in Group quarters - Residential treatment centers for emotionally disturbed children (%)
People in Group quarters - Training schools for juvenile delinquents (%)
People in Group quarters - Short-term care, detention or diagnostic centers for delinquent children (%)
People in Group quarters - Type of juvenile institution unknown (%)
People in Group quarters - Noninstitutionalized population (%)
People in Group quarters - College dormitories (includes college quarters off campus) (%)
People in Group quarters - Military quarters (%)
People in Group quarters - On base (%)
People in Group quarters - Barracks, unaccompanied personnel housing (UPH), (Enlisted/Officer), ;and similar group living quarters for military personnel (%)
People in Group quarters - Transient quarters for temporary residents (%)
People in Group quarters - Military ships (%)
People in Group quarters - Group homes (%)
People in Group quarters - Homes or halfway houses for drug/alcohol abuse (%)
People in Group quarters - Homes for the mentally ill (%)
People in Group quarters - Homes for the mentally retarded (%)
People in Group quarters - Homes for the physically handicapped (%)
People in Group quarters - Other group homes (%)
People in Group quarters - Religious group quarters (%)
People in Group quarters - Dormitories (%)
People in Group quarters - Agriculture workers' dormitories on farms (%)
People in Group quarters - Job Corps and vocational training facilities (%)
People in Group quarters - Other workers' dormitories (%)
People in Group quarters - Crews of maritime vessels (%)
People in Group quarters - Other nonhousehold living situations (%)
People in Group quarters - Other noninstitutional group quarters (%)
Residents speaking English at home (%)
Residents speaking English at home - Born in the United States (%)
Residents speaking English at home - Native, born elsewhere (%)
Residents speaking English at home - Foreign born (%)
Residents speaking Spanish at home (%)
Residents speaking Spanish at home - Born in the United States (%)
Residents speaking Spanish at home - Native, born elsewhere (%)
Residents speaking Spanish at home - Foreign born (%)
Residents speaking other language at home (%)
Residents speaking other language at home - Born in the United States (%)
Residents speaking other language at home - Native, born elsewhere (%)
Residents speaking other language at home - Foreign born (%)
Class of Workers - Employee of private company (%)
Class of Workers - Self-employed in own incorporated business (%)
Class of Workers - Private not-for-profit wage and salary workers (%)
Class of Workers - Local government workers (%)
Class of Workers - State government workers (%)
Class of Workers - Federal government workers (%)
Class of Workers - Self-employed workers in own not incorporated business and Unpaid family workers (%)
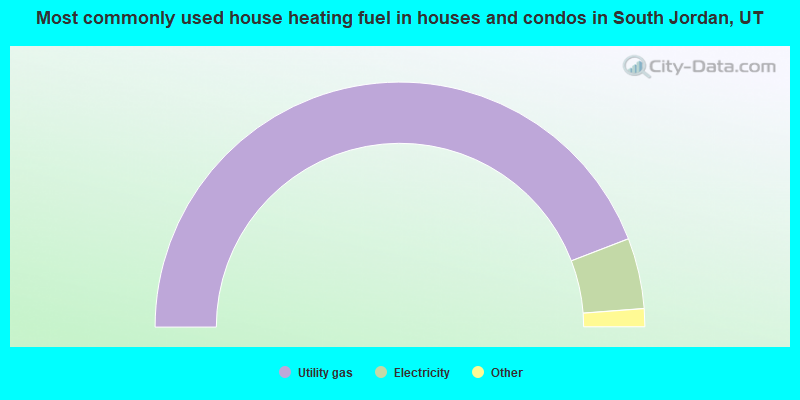
House heating fuel used in houses and condos - Utility gas (%)
House heating fuel used in houses and condos - Bottled, tank, or LP gas (%)
House heating fuel used in houses and condos - Electricity (%)
House heating fuel used in houses and condos - Fuel oil, kerosene, etc. (%)
House heating fuel used in houses and condos - Coal or coke (%)
House heating fuel used in houses and condos - Wood (%)
House heating fuel used in houses and condos - Solar energy (%)
House heating fuel used in houses and condos - Other fuel (%)
House heating fuel used in houses and condos - No fuel used (%)
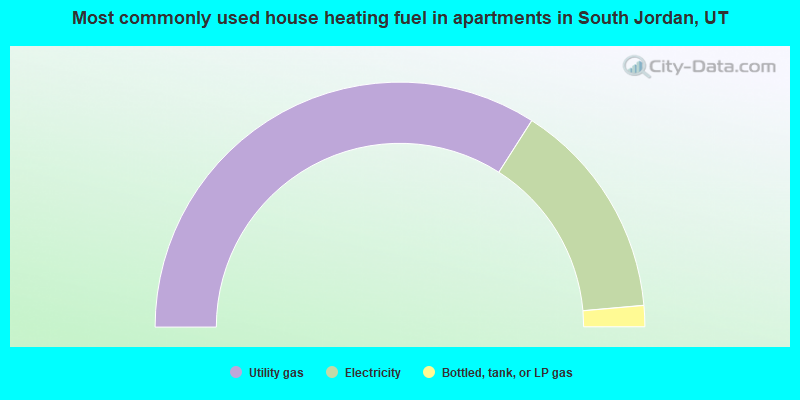
House heating fuel used in apartments - Utility gas (%)
House heating fuel used in apartments - Bottled, tank, or LP gas (%)
House heating fuel used in apartments - Electricity (%)
House heating fuel used in apartments - Fuel oil, kerosene, etc. (%)
House heating fuel used in apartments - Coal or coke (%)
House heating fuel used in apartments - Wood (%)
House heating fuel used in apartments - Solar energy (%)
House heating fuel used in apartments - Other fuel (%)
House heating fuel used in apartments - No fuel used (%)
Armed forces status - In Armed Forces (%)
Armed forces status - Civilian (%)
Armed forces status - Civilian - Veteran (%)
Armed forces status - Civilian - Nonveteran (%)
Fatal accidents locations in years 2005-2021
Fatal accidents locations in 2005
Fatal accidents locations in 2006
Fatal accidents locations in 2007
Fatal accidents locations in 2008
Fatal accidents locations in 2009
Fatal accidents locations in 2010
Fatal accidents locations in 2011
Fatal accidents locations in 2012
Fatal accidents locations in 2013
Fatal accidents locations in 2014
Fatal accidents locations in 2015
Fatal accidents locations in 2016
Fatal accidents locations in 2017
Fatal accidents locations in 2018
Fatal accidents locations in 2019
Fatal accidents locations in 2020
Fatal accidents locations in 2021
Alcohol use - People drinking some alcohol every month (%)
Alcohol use - People not drinking at all (%)
Alcohol use - Average days/month drinking alcohol
Alcohol use - Average drinks/week
Alcohol use - Average days/year people drink much
Audiometry - Average condition of hearing (%)
Audiometry - People that can hear a whisper from across a quiet room (%)
Audiometry - People that can hear normal voice from across a quiet room (%)
Audiometry - Ears ringing, roaring, buzzing (%)
Audiometry - Had a job exposure to loud noise (%)
Audiometry - Had off-work exposure to loud noise (%)
Blood Pressure & Cholesterol - Has high blood pressure (%)
Blood Pressure & Cholesterol - Checking blood pressure at home (%)
Blood Pressure & Cholesterol - Frequently checking blood cholesterol (%)
Blood Pressure & Cholesterol - Has high cholesterol level (%)
Consumer Behavior - Money monthly spent on food at supermarket/grocery store
Consumer Behavior - Money monthly spent on food at other stores
Consumer Behavior - Money monthly spent on eating out
Consumer Behavior - Money monthly spent on carryout/delivered foods
Consumer Behavior - Income spent on food at supermarket/grocery store (%)
Consumer Behavior - Income spent on food at other stores (%)
Consumer Behavior - Income spent on eating out (%)
Consumer Behavior - Income spent on carryout/delivered foods (%)
Current Health Status - General health condition (%)
Current Health Status - Blood donors (%)
Current Health Status - Has blood ever tested for HIV virus (%)
Current Health Status - Left-handed people (%)
Dermatology - People using sunscreen (%)
Diabetes - Diabetics (%)
Diabetes - Had a blood test for high blood sugar (%)
Diabetes - People taking insulin (%)
Diet Behavior & Nutrition - Diet health (%)
Diet Behavior & Nutrition - Milk product consumption (# of products/month)
Diet Behavior & Nutrition - Meals not home prepared (#/week)
Diet Behavior & Nutrition - Meals from fast food or pizza place (#/week)
Diet Behavior & Nutrition - Ready-to-eat foods (#/month)
Diet Behavior & Nutrition - Frozen meals/pizza (#/month)
Drug Use - People that ever used marijuana or hashish (%)
Drug Use - Ever used hard drugs (%)
Drug Use - Ever used any form of cocaine (%)
Drug Use - Ever used heroin (%)
Drug Use - Ever used methamphetamine (%)
Health Insurance - People covered by health insurance (%)
Kidney Conditions-Urology - Avg. # of times urinating at night
Medical Conditions - People with asthma (%)
Medical Conditions - People with anemia (%)
Medical Conditions - People with psoriasis (%)
Medical Conditions - People with overweight (%)
Medical Conditions - Elderly people having difficulties in thinking or remembering (%)
Medical Conditions - People who ever received blood transfusion (%)
Medical Conditions - People having trouble seeing even with glass/contacts (%)
Medical Conditions - People with arthritis (%)
Medical Conditions - People with gout (%)
Medical Conditions - People with congestive heart failure (%)
Medical Conditions - People with coronary heart disease (%)
Medical Conditions - People with angina pectoris (%)
Medical Conditions - People who ever had heart attack (%)
Medical Conditions - People who ever had stroke (%)
Medical Conditions - People with emphysema (%)
Medical Conditions - People with thyroid problem (%)
Medical Conditions - People with chronic bronchitis (%)
Medical Conditions - People with any liver condition (%)
Medical Conditions - People who ever had cancer or malignancy (%)
Mental Health - People who have little interest in doing things (%)
Mental Health - People feeling down, depressed, or hopeless (%)
Mental Health - People who have trouble sleeping or sleeping too much (%)
Mental Health - People feeling tired or having little energy (%)
Mental Health - People with poor appetite or overeating (%)
Mental Health - People feeling bad about themself (%)
Mental Health - People who have trouble concentrating on things (%)
Mental Health - People moving or speaking slowly or too fast (%)
Mental Health - People having thoughts they would be better off dead (%)
Oral Health - Average years since last visit a dentist
Oral Health - People embarrassed because of mouth (%)
Oral Health - People with gum disease (%)
Oral Health - General health of teeth and gums (%)
Oral Health - Average days a week using dental floss/device
Oral Health - Average days a week using mouthwash for dental problem
Oral Health - Average number of teeth
Pesticide Use - Households using pesticides to control insects (%)
Pesticide Use - Households using pesticides to kill weeds (%)
Physical Activity - People doing vigorous-intensity work activities (%)
Physical Activity - People doing moderate-intensity work activities (%)
Physical Activity - People walking or bicycling (%)
Physical Activity - People doing vigorous-intensity recreational activities (%)
Physical Activity - People doing moderate-intensity recreational activities (%)
Physical Activity - Average hours a day doing sedentary activities
Physical Activity - Average hours a day watching TV or videos
Physical Activity - Average hours a day using computer
Physical Functioning - People having limitations keeping them from working (%)
Physical Functioning - People limited in amount of work they can do (%)
Physical Functioning - People that need special equipment to walk (%)
Physical Functioning - People experiencing confusion/memory problems (%)
Physical Functioning - People requiring special healthcare equipment (%)
Prescription Medications - Average number of prescription medicines taking
Preventive Aspirin Use - Adults 40+ taking low-dose aspirin (%)
Reproductive Health - Vaginal deliveries (%)
Reproductive Health - Cesarean deliveries (%)
Reproductive Health - Deliveries resulted in a live birth (%)
Reproductive Health - Pregnancies resulted in a delivery (%)
Reproductive Health - Women breastfeeding newborns (%)
Reproductive Health - Women that had a hysterectomy (%)
Reproductive Health - Women that had both ovaries removed (%)
Reproductive Health - Women that have ever taken birth control pills (%)
Reproductive Health - Women taking birth control pills (%)
Reproductive Health - Women that have ever used Depo-Provera or injectables (%)
Reproductive Health - Women that have ever used female hormones (%)
Sexual Behavior - People 18+ that ever had sex (vaginal, anal, or oral) (%)
Sexual Behavior - Males 18+ that ever had vaginal sex with a woman (%)
Sexual Behavior - Males 18+ that ever performed oral sex on a woman (%)
Sexual Behavior - Males 18+ that ever had anal sex with a woman (%)
Sexual Behavior - Males 18+ that ever had any sex with a man (%)
Sexual Behavior - Females 18+ that ever had vaginal sex with a man (%)
Sexual Behavior - Females 18+ that ever performed oral sex on a man (%)
Sexual Behavior - Females 18+ that ever had anal sex with a man (%)
Sexual Behavior - Females 18+ that ever had any kind of sex with a woman (%)
Sexual Behavior - Average age people first had sex
Sexual Behavior - Average number of female sex partners in lifetime (males 18+)
Sexual Behavior - Average number of female vaginal sex partners in lifetime (males 18+)
Sexual Behavior - Average age people first performed oral sex on a woman (18+)
Sexual Behavior - Average number of woman performed oral sex on in lifetime (18+)
Sexual Behavior - Average number of male sex partners in lifetime (males 18+)
Sexual Behavior - Average number of male anal sex partners in lifetime (males 18+)
Sexual Behavior - Average age people first performed oral sex on a man (18+)
Sexual Behavior - Average number of male oral sex partners in lifetime (18+)
Sexual Behavior - People using protection when performing oral sex (%)
Sexual Behavior - Average number of times people have vaginal or anal sex a year
Sexual Behavior - People having sex without condom (%)
Sexual Behavior - Average number of male sex partners in lifetime (females 18+)
Sexual Behavior - Average number of male vaginal sex partners in lifetime (females 18+)
Sexual Behavior - Average number of female sex partners in lifetime (females 18+)
Sexual Behavior - Circumcised males 18+ (%)
Sleep Disorders - Average hours sleeping at night
Sleep Disorders - People that has trouble sleeping (%)
Smoking-Cigarette Use - People smoking cigarettes (%)
Taste & Smell - People 40+ having problems with smell (%)
Taste & Smell - People 40+ having problems with taste (%)
Taste & Smell - People 40+ that ever had wisdom teeth removed (%)
Taste & Smell - People 40+ that ever had tonsils teeth removed (%)
Taste & Smell - People 40+ that ever had a loss of consciousness because of a head injury (%)
Taste & Smell - People 40+ that ever had a broken nose or other serious injury to face or skull (%)
Taste & Smell - People 40+ that ever had two or more sinus infections (%)
Weight - Average height (inches)
Weight - Average weight (pounds)
Weight - Average BMI
Weight - People that are obese (%)
Weight - People that ever were obese (%)
Weight - People trying to lose weight (%)
According to our research of Utah and other state lists, there were 47 registered sex offenders living in South Jordan, Utah as of April 19, 2024 . The ratio of all residents to sex offenders in South Jordan is 1,370 to 1.The ratio of registered sex offenders to all residents in this city is much lower than the state average.
Officers per 1,000 residents here:
0.71Utah average:
1.67
Latest news from South Jordan, UT collected exclusively by city-data.com from local newspapers, TV, and radio stations
Ancestries: English (25.0%), European (10.6%), German (6.5%), British (6.2%), American (6.0%), Norwegian (2.1%).
Current Local Time:
Incorporated on 11/08/1935
Land area: 20.9 square miles.
Population density: 4,002 people per square mile (average).
5,249 residents are foreign born (2.9% Asia , 2.2% Latin America ).
Median real estate property taxes paid for housing units with mortgages in 2022: $2,914 (0.5%)Median real estate property taxes paid for housing units with no mortgage in 2022: $2,822 (0.4%)
Nearest city with pop. 50,000+: West Jordan, UT
Nearest city with pop. 200,000+: Las Vegas, NV
Nearest city with pop. 1,000,000+: Phoenix, AZ
Nearest cities:
Latitude: 40.56 N, Longitude: 111.96 W
Daytime population change due to commuting: -10,712 (-12.8%)Workers who live and work in this city: 14,529 (33.9%)
Area code commonly used in this area: 801
Single-family new house construction building permits:
2022: 746 buildings , average cost: $228,5002021: 1114 buildings , average cost: $234,7002020: 1122 buildings , average cost: $237,4002019: 765 buildings , average cost: $238,9002018: 955 buildings , average cost: $254,7002017: 843 buildings , average cost: $248,9002016: 855 buildings , average cost: $262,6002015: 751 buildings , average cost: $249,8002014: 806 buildings , average cost: $235,3002013: 738 buildings , average cost: $253,7002012: 653 buildings , average cost: $245,2002011: 651 buildings , average cost: $211,2002010: 481 buildings , average cost: $221,7002009: 431 buildings , average cost: $191,3002008: 428 buildings , average cost: $167,9002007: 798 buildings , average cost: $216,4002006: 1088 buildings , average cost: $203,5002005: 1007 buildings , average cost: $207,6002004: 921 buildings , average cost: $185,6002003: 651 buildings , average cost: $149,6002002: 610 buildings , average cost: $129,0002001: 349 buildings , average cost: $127,8002000: 311 buildings , average cost: $121,9001999: 378 buildings , average cost: $129,3001998: 443 buildings , average cost: $134,0001997: 375 buildings , average cost: $122,500Unemployment in December 2023:
Population change in the 1990s: +16,822 (+133.3%).
Most common occupations in South Jordan, UT (%)
Both Males Females
Other management occupations, except farmers and farm managers (6.3%)
Other sales and related occupations, including supervisors (5.7%)
Other office and administrative support workers, including supervisors (4.7%)
Sales representatives, services, wholesale and manufacturing (3.7%)
Secretaries and administrative assistants (3.6%)
Retail sales workers, except cashiers (3.2%)
Computer specialists (3.1%)
Other management occupations, except farmers and farm managers (9.1%)
Other sales and related occupations, including supervisors (6.2%)
Sales representatives, services, wholesale and manufacturing (5.0%)
Electrical equipment mechanics and other installation, maintenance, and repair workers, including supervisors (4.4%)
Computer specialists (4.3%)
Other production occupations, including supervisors (4.0%)
Top executives (3.6%)
Secretaries and administrative assistants (8.2%)
Other office and administrative support workers, including supervisors (7.9%)
Preschool, kindergarten, elementary, and middle school teachers (5.5%)
Other sales and related occupations, including supervisors (5.0%)
Information and record clerks, except customer service representatives (4.6%)
Bookkeeping, accounting, and auditing clerks (4.1%)
Customer service representatives (3.7%)
Earthquake activity:
South Jordan-area historical earthquake activity is significantly above Utah state average. It is 2224% greater than the overall U.S. average. On 8/18/1959 at 06:37:13, a magnitude 7.7 (7.7 UK, Class: Major, Intensity: VIII - XII) earthquake occurred 284.8 miles away from the city center, causing $26,000,000 total damage On 10/3/1915 at 06:52:48, a magnitude 7.6 (7.6 UK) earthquake occurred 291.2 miles away from South Jordan center On 10/28/1983 at 14:06:06, a magnitude 7.3 (6.2 MB, 7.3 MS, 7.0 MW) earthquake occurred 260.7 miles away from South Jordan center, causing 2 deaths ( 2 shaking deaths) and 3 injuries, causing $15,000,000 total damage On 3/28/1975 at 02:31:05, a magnitude 6.2 (6.1 MB, 6.0 MS, 6.2 ML, Class: Strong, Intensity: VII - IX) earthquake occurred 103.8 miles away from the city center On 3/18/2020 at 13:09:31, a magnitude 5.7 (5.7 MW, Depth: 7.4 mi, Class: Moderate, Intensity: VI - VII) earthquake occurred 14.5 miles away from the city center On 12/21/1932 at 06:10:09, a magnitude 7.2 (7.2 UK) earthquake occurred 356.0 miles away from South Jordan center Magnitude types: body-wave magnitude (MB), local magnitude (ML), surface-wave magnitude (MS), moment magnitude (MW) Natural disasters: The number of natural disasters in Salt Lake County (9) is smaller than the US average (15).Major Disasters (Presidential) Declared: 4Emergencies Declared: 1Floods: 3, Storms: 3, Fires: 2, Landslides: 2, Earthquake: 1, Hurricane: 1, Mudslide: 1, Tornado: 1, Other: 1 (Note: some incidents may be assigned to more than one category). Main business address for: HEADWATERS INC MISCELLANEOUS PRODUCTS OF PETROLEUM & COAL ), TENFOLD CORP /UT SERVICES-COMPUTER PROGRAMMING SERVICES ), MERIT MEDICAL SYSTEMS INC SURGICAL & MEDICAL INSTRUMENTS & APPARATUS ).
Hospitals and medical centers in South Jordan: SUNBROOK HOSPICE LLC (1108 WEST SOUTH PKWY #C) COMPASS REHABILITATION CENTER (1371 W SOUTH JORDAN PARKWAY)
SOUTH MOUNTAIN DIALYSIS (10969 S RIVERFRONT PKWY STE 100)
COZY HOME HEALTH CARE (1341 SOUTH JORDAN PARKWAY)
MIDAS CREEK HOME HEALTH (2983 WEST CHALK CREEK WAY)
Airports located in South Jordan: Amtrak station near South Jordan: 15 miles: SALT LAKE CITY (320 S. RIO GRANDE ST.) Services: ticket office, fully wheelchair accessible, enclosed waiting area, public restrooms, public payphones, vending machines, free short-term parking, free long-term parking, call for car rental service, taxi stand.
College/University in South Jordan: Medspa Academies Full-time enrollment: 143; Location: 10714 South River Front Parkway; Private, for-profit; Website: www.nima.edu/)
Colleges/universities with over 2000 students nearest to South Jordan:
Stevens-Henager College-Murray (about 8 miles; Murray, UT ; Full-time enrollment: 6,395)
Salt Lake Community College (about 8 miles; Salt Lake City, UT ; FT enrollment: 20,797)
Western Governors University (about 10 miles; Salt Lake City, UT ; FT enrollment: 31,481)
Westminster College (about 13 miles; Salt Lake City, UT ; FT enrollment: 2,870)
Latter-day Saints Business College (about 15 miles; Salt Lake City, UT ; FT enrollment: 2,059)
University of Utah (about 16 miles; Salt Lake City, UT ; FT enrollment: 28,454)
Utah Valley University (about 24 miles; Orem, UT ; FT enrollment: 24,403)
Public high schools in South Jordan: BINGHAM HIGH Students: 2,320, Location: 2160 W 10400 S, Grades: 10-12)SOUTH JORDAN MIDDLE Students: 1,592, Location: 10245 S 2700 W, Grades: 7-9)ELK RIDGE MIDDLE Students: 1,476, Location: 3659 W 9800 S, Grades: 7-9)VALLEY HIGH SCHOOL Students: 907, Location: 325 W 11000 S, Grades: 7-12)RIVERS EDGE SCHOOL Students: 724, Location: 319 W 11000 S, Grades: KG-12)PARADIGM HIGH SCHOOL Location: 11577 S 3600 W, Grades: 7-12, Charter school )
EARLY LIGHT ACADEMY AT DAYBREAK Location: 11709 VADANIA DR, Grades: KG-9, Charter school )
Private high schools in South Jordan: AMERICAN HERITAGE OF SOUTH JORDAN Students: 350, Location: 11100 S REDWOOD RD, Grades: PK-12)
STILLWATER ACADEMY Students: 42, Location: 11175 S REDWOOD RD, Grades: 9-12)
Public elementary/middle schools in South Jordan: SOUTH JORDAN SCHOOL Students: 1,061, Location: 11205 S BLACK CHERRY WAY, Grades: KG-6)EASTLAKE SCHOOL Students: 998, Location: 4389 W ISLA DAYBREAK ROAD, Grades: KG-6)DAYBREAK SCHOOL Students: 945, Location: 4544 W HARVEST MOON DR, Grades: KG-6)MONTE VISTA SCHOOL Students: 927, Location: 11121 S 2700 W, Grades: KG-6)WELBY SCHOOL Students: 911, Location: 4130 W 9580 S, Grades: KG-6)JORDAN RIDGE SCHOOL Students: 902, Location: 2636 W 9800 S, Grades: KG-6)ELK MEADOWS SCHOOL Students: 763, Location: 3448 W 9800 S, Grades: KG-6)MOUNTAIN WEST MONTESSORI ACADEMY Location: 4125 S FOXVIEW DR., Grades: KG-8, Charter school )
See full list of schools located in South Jordan Birthplace of: Jason Baker - College basketball player (Southern Utah Thunderbirds), Jeff Rhea - College football player (BYU Cougars), Mike Higgins - College basketball player (Navy Midshipmen), Vaughn Soffe - Politician.
Salt Lake County has a predicted average indoor radon screening level between 2 and 4 pCi/L (pico curies per liter) - Moderate Potential Drinking water stations with addresses in South Jordan and their reported violations in the past:
KENNECOTT - SECTION 21 (Population served: 1,300, Groundwater):
Past health violations:
MCL, Monthly (TCR) - In AUG-2013, Contaminant: Coliform. Follow-up actions: St Public Notif requested (OCT-06-2013), St Formal NOV issued (OCT-06-2013), St Public Notif received (NOV-30-2013)
Past monitoring violations:
One minor monitoring violation
2 regular monitoring violations
Population served: 600, Purch groundwater):
Past health violations:
MCL, Monthly (TCR) - In JUN-2009, Contaminant: Coliform. Follow-up actions: St Public Notif requested (AUG-06-2009), St Formal NOV issued (AUG-06-2009), St Compliance achieved (JUN-30-2010)
MCL, Monthly (TCR) - Between JUL-2006 and SEP-2006, Contaminant: Coliform. Follow-up actions: St Compliance achieved (JAN-01-2008)
Past monitoring violations:
Monitoring, Repeat Major (TCR) - In SEP-2010, Contaminant: Coliform (TCR)
Monitoring, Repeat Major (TCR) - In MAY-2009, Contaminant: Coliform (TCR). Follow-up actions: St Compliance achieved (JAN-01-2010)
Monitoring, Repeat Major (TCR) - In JUN-2008, Contaminant: Coliform (TCR). Follow-up actions: St Compliance achieved (JAN-01-2010)
One routine major monitoring violation
3 minor monitoring violations
Population served: 590, Groundwater):
Past monitoring violations:
Failure To Address Deficiency - In APR-02-2010, Contaminant: GROUNDWATER RULE
Monitoring, Repeat Major (TCR) - In JUN-2009, Contaminant: Coliform (TCR). Follow-up actions: St Compliance achieved (JAN-01-2010)
One minor monitoring violation
Population served: 585, Groundwater):
Past health violations:
MCL, Monthly (TCR) - In SEP-2009, Contaminant: Coliform. Follow-up actions: St Compliance achieved (JUN-30-2009), St Public Notif requested (NOV-19-2009), St Formal NOV issued (NOV-19-2009)
MCL, Monthly (TCR) - In JUN-2009, Contaminant: Coliform. Follow-up actions: St Public Notif requested (AUG-09-2009), St Formal NOV issued (AUG-09-2009), St Compliance achieved (JUN-30-2010)
Past monitoring violations:
2 regular monitoring violations
Population served: 577, Groundwater):
Past health violations:
MCL, Monthly (TCR) - In JUN-2011, Contaminant: Coliform. Follow-up actions: St Formal NOV issued (AUG-07-2011), St Public Notif requested (AUG-07-2011)
Past monitoring violations:
Monitoring, Repeat Major (TCR) - In SEP-2009, Contaminant: Coliform (TCR). Follow-up actions: St Compliance achieved (JAN-01-2010)
One routine major monitoring violation
One regular monitoring violation
Population served: 540, Purch groundwater):
Past monitoring violations:
Monitoring, Source Water (GWR) - In JUN-01-2013, Contaminant: E. COLI. Follow-up actions: St Formal NOV issued (JUL-25-2013), St Public Notif requested (JUL-25-2013)
Monitoring, Repeat Major (TCR) - In MAY-2013, Contaminant: Coliform (TCR). Follow-up actions: St Formal NOV issued (JUL-06-2013), St Public Notif requested (JUL-06-2013)
One minor monitoring violation
Population served: 525, Groundwater):
Past monitoring violations:
Monitoring, Repeat Major (TCR) - Between JUL-2006 and SEP-2006, Contaminant: Coliform (TCR). Follow-up actions: St Compliance achieved (JAN-01-2010)
One routine major monitoring violation
One regular monitoring violation
Population served: 500, Groundwater):
Past monitoring violations:
2 regular monitoring violations
Drinking water stations with addresses in South Jordan that have no violations reported:
AMERICAN FORK RECREATION SITE (Population served: 960, Primary Water Source Type: Groundwater)
KENNECOTT - UTAH METALS TUNNEL (Population served: 740, Primary Water Source Type: Groundwater)
THEATER IN PINES & MT TIMPANOGAS (Population served: 325, Primary Water Source Type: Groundwater)
BLUFFS CAMPGROUND (Population served: 200, Primary Water Source Type: Groundwater)
MUELLER PARK DAY USE (Population served: 120, Primary Water Source Type: Purch surface water)
DESERET GENERATION & TRANSMISSION CO-OP (Population served: 103, Primary Water Source Type: Surface water)
LEDGEFORK CAMPGROUND (Population served: 100, Primary Water Source Type: Groundwater)
BUTTERFLY CAMPGROUND (Population served: 100, Primary Water Source Type: Groundwater)
KENNECOTT - LARK (Population served: 83, Primary Water Source Type: Groundwater)
BOX ELDER CAMPGROUND (Population served: 70, Primary Water Source Type: Purch groundwater)
Average household size: This city:
3.5 peopleUtah:
3.1 people
Percentage of family households: This city:
85.9%Whole state:
75.2%
Percentage of households with unmarried partners: This city:
2.7%Whole state:
4.6%
Likely homosexual households (counted as self-reported same-sex unmarried-partner households)
Lesbian couples: 0.3% of all households Gay men: 0.3% of all households
7 people in nursing facilities/skilled-nursing facilities in 2010people in nursing homes in 2000people in other noninstitutional group quarters in 2000
Banks with branches in South Jordan (2011 data):
JPMorgan Chase Bank, National Association: South Jordan Branch at 11423 S Parkway Plaza Drive, branch established on 2006/10/05; South Jordan Town Center Branch at 10555 S Redwood Rd, branch established on 2002/12/16. Info updated 2011/11/10: Bank assets: $1,811,678.0 mil, Deposits: $1,190,738.0 mil, headquarters in Columbus, OH, positive income , International Specialization, 5577 total offices , Holding Company: Jpmorgan Chase & Co.
Zions First National Bank: Daybreak Office Branch at 4753 West Daybreak Parkway, branch established on 2010/08/09; South Jordan Parkway Branch at 1622 West South Jordan Parkway, branch established on 2002/09/23. Info updated 2006/11/03: Bank assets: $17,531.3 mil, Deposits: $14,905.3 mil, headquarters in Salt Lake City, UT, positive income , Commercial Lending Specialization, 151 total offices , Holding Company: Zions Bancorporation
U.S. Bank National Association: South Jordan Smiths Branch at 1634 West South Jordan Parkway, branch established on 2004/03/29. Info updated 2012/01/30: Bank assets: $330,470.8 mil, Deposits: $236,091.5 mil, headquarters in Cincinnati, OH, positive income , 3121 total offices , Holding Company: U.S. Bancorp
KeyBank National Association: Daybreak Branch at 11422 S District Drive, branch established on 2007/02/01. Info updated 2008/03/03: Bank assets: $86,198.8 mil, Deposits: $64,214.8 mil, headquarters in Cleveland, OH, positive income , Commercial Lending Specialization, 1067 total offices , Holding Company: Keycorp
Merrick Bank: at 10705 South Jordan Gateway, Suite 200, branch established on 1997/09/22. Info updated 2006/11/03: Bank assets: $1,320.2 mil, Deposits: $987.1 mil, local headquarters , positive income , Credit-Card Specialization, 1 total offices
AmericanWest Bank: South Jordan Financial Center Branch at 10757 River Front Parkway Suite 15, branch established on 2008/02/04. Info updated 2011/12/12: Bank assets: $2,274.6 mil, Deposits: $1,889.1 mil, headquarters in Spokane, WA, positive income , Commercial Lending Specialization, 76 total offices , Holding Company: Skbhc Holdings Llc
For population 15 years and over in South Jordan:
Never married: 28.7%Now married: 61.1%Separated: 0.7%Widowed: 2.8%Divorced: 6.7% For population 25 years and over in South Jordan:
High school or higher: 97.6%Bachelor's degree or higher: 46.2%Graduate or professional degree: 16.5%Unemployed: 2.7%Mean travel time to work (commute): 20.2 minutes
Education Gini index (Inequality in education) Here:
9.2Utah average:
10.9
Religion statistics for South Jordan, UT (based on Salt Lake County data)
Religion Adherents Congregations Other 622,807 1,452 Catholic 84,342 24 Evangelical Protestant 27,497 144 Mainline Protestant 12,789 38 Orthodox 5,352 7 Black Protestant 1,302 6 None 275,566 -
Source: Clifford Grammich, Kirk Hadaway, Richard Houseal, Dale E.Jones, Alexei Krindatch, Richie Stanley and Richard H.Taylor. 2012. 2010 U.S.Religion Census: Religious Congregations & Membership Study. Association of Statisticians of American Religious Bodies. Jones, Dale E., et al. 2002. Congregations and Membership in the United States 2000. Nashville, TN: Glenmary Research Center. Graphs represent county-level data
Food Environment Statistics: Number of grocery stores : 146This county :
1.45 / 10,000 pop.Utah :
1.37 / 10,000 pop.
Number of supercenters and club stores : 16Salt Lake County :
0.16 / 10,000 pop.State :
0.18 / 10,000 pop.
Number of convenience stores (no gas) : 47This county :
0.47 / 10,000 pop.Utah :
0.41 / 10,000 pop.
Number of convenience stores (with gas) : 246This county :
2.45 / 10,000 pop.Utah :
2.82 / 10,000 pop.
Number of full-service restaurants : 558This county :
5.55 / 10,000 pop.Utah :
5.09 / 10,000 pop.
Adult diabetes rate : Salt Lake County :
6.5%Utah :
6.3%
Health and Nutrition:
Average overall health of teeth and gums : South Jordan:
50.9%Utah:
47.0%
Average BMI : South Jordan:
28.3State:
28.4
People feeling badly about themselves : South Jordan:
20.7%State:
21.0%
People not drinking alcohol at all : South Jordan:
8.1%State:
10.3%
Average hours sleeping at night : Overweight people : South Jordan:
33.4%Utah:
31.9%
General health condition : South Jordan:
59.7%Utah:
57.4%
Average condition of hearing : This city:
81.2%Utah:
80.1%
More about Health and Nutrition of South Jordan, UT Residents
Local government employment and payroll (March 2022)
Function
Full-time employees
Monthly full-time payroll
Average yearly full-time wage
Part-time employees
Monthly part-time payroll
Police Protection - Officers
59 $304,814 $61,996 0 $0 Firefighters
57 $385,498 $81,157 14 $18,662 Streets and Highways
37 $211,241 $68,511 2 $2,896 Other and Unallocable
37 $169,178 $54,869 3 $5,401 Other Government Administration
31 $210,452 $81,465 13 $13,301 Parks and Recreation
28 $120,592 $51,682 25 $20,473 Water Supply
26 $115,017 $53,085 0 $0 Housing and Community Development (Local)
25 $174,344 $83,685 2 $2,544 Financial Administration
20 $116,527 $69,916 0 $0 Police - Other
16 $107,293 $80,470 42 $27,772 Judicial and Legal
12 $81,619 $81,619 1 $2,094 Sewerage
11 $56,783 $61,945 0 $0 Fire - Other
8 $69,611 $104,417 0 $0 Solid Waste Management
5 $21,983 $52,759 0 $0
Totals for Government
372 $2,144,952 $69,192 102 $93,143
South Jordan government finances - Expenditure in 2021 (per resident):
Construction - General - Other: $6,995,000 ($83.76)
Water Utilities: $5,078,000 ($60.80)Housing and Community Development: $1,406,000 ($16.84)Financial Administration: $155,000 ($1.86)Current Operations - Central Staff Services: $20,352,000 ($243.70)
Water Utilities: $10,735,000 ($128.54)Housing and Community Development: $8,441,000 ($101.07)General - Other: $8,314,000 ($99.55)Solid Waste Management: $3,872,000 ($46.36)Sewerage: $1,145,000 ($13.71)Regular Highways: $394,000 ($4.72)Judicial and Legal Services: $163,000 ($1.95)General - Interest on Debt: $3,088,000 ($36.98)
Intergovernmental to Local - Other - Housing and Community Development: $6,753,000 ($80.86)
Other Capital Outlay - General - Other: $3,757,000 ($44.99)
Housing and Community Development: $125,000 ($1.50)Total Salaries and Wages: $48,911,000 ($585.67)
South Jordan government finances - Revenue in 2021 (per resident):
Charges - Other: $5,794,000 ($69.38)
Solid Waste Management: $4,546,000 ($54.43)Sewerage: $2,723,000 ($32.61)Housing and Community Development: $1,788,000 ($21.41)Parks and Recreation: $985,000 ($11.79)Regular Highways: $583,000 ($6.98)Miscellaneous Commercial Activities: $583,000 ($6.98)Federal Intergovernmental - General Local Government Support: $5,112,000 ($61.21)
Housing and Community Development: $323,000 ($3.87)Other: $171,000 ($2.05)Local Intergovernmental - Other: $762,000 ($9.12)
General Local Government Support: $263,000 ($3.15)Miscellaneous - Special Assessments: $3,807,000 ($45.59)
General Revenue - Other: $2,660,000 ($31.85)Interest Earnings: $2,081,000 ($24.92)Sale of Property: $1,962,000 ($23.49)Fines and Forfeits: $522,000 ($6.25)Rents: $251,000 ($3.01)Donations From Private Sources: $15,000 ($0.18)Revenue - Water Utilities: $24,834,000 ($297.37)
State Intergovernmental - Highways: $3,110,000 ($37.24)
Other: $500,000 ($5.99)General Local Government Support: $106,000 ($1.27)Tax - Property: $43,895,000 ($525.61)
General Sales and Gross Receipts: $20,017,000 ($239.69)Public Utilities Sales: $5,463,000 ($65.41)Other License: $5,274,000 ($63.15)Other Selective Sales: $1,869,000 ($22.38)Occupation and Business License - Other: $196,000 ($2.35)
South Jordan government finances - Debt in 2021 (per resident):
Long Term Debt - Outstanding Unspecified Public Purpose: $88,390,000 ($1058.40)
Beginning Outstanding - Unspecified Public Purpose: $66,338,000 ($794.34)Issue, Unspecified Public Purpose: $37,907,000 ($453.91)Retired Unspecified Public Purpose: $15,855,000 ($189.85)
South Jordan government finances - Cash and Securities in 2021 (per resident):
Bond Funds - Cash and Securities: $60,840,000 ($728.51)
Other Funds - Cash and Securities: $84,271,000 ($1009.08)
Sinking Funds - Cash and Securities: $4,235,000 ($50.71)
6.29% of this county's 2021 resident taxpayers lived in other counties in 2020 ($73,956 average adjusted gross income )
Here:
6.29%Utah average:
7.95%
0.01% of residents moved from foreign countries ($111 average AGI )Salt Lake County:
0.01%Utah average:
0.02%
Top counties from which taxpayers relocated into this county between 2020 and 2021:
6.63% of this county's 2020 resident taxpayers moved to other counties in 2021 ($71,033 average adjusted gross income )
Here:
6.63%Utah average:
7.39%
0.01% of residents moved to foreign countries ($100 average AGI )Salt Lake County:
0.01%Utah average:
0.02%
Top counties to which taxpayers relocated from this county between 2020 and 2021:
Businesses in South Jordan, UT
Name Count Name Count
7-Eleven 2 Kroger 1 AT&T 2 McDonald's 2 Ace Hardware 1 Nike 6 Aeropostale 1 OfficeMax 1 American Eagle Outfitters 1 Olive Garden 1 Applebee's 1 Panda Express 1 Baskin-Robbins 1 Payless 1 Bath & Body Works 1 Pizza Hut 1 Big O Tires 1 Quiznos 1 Blockbuster 1 Red Robin 1 CarMax 1 Rue21 1 Carl\s Jr. 1 Sam's Club 1 Chick-Fil-A 1 Sleep Inn 1 Cold Stone Creamery 1 Sprint Nextel 1 Cricket Wireless 1 Starbucks 1 Curves 1 Subway 4 Domino's Pizza 1 Super 8 1 Famous Footwear 1 T-Mobile 2 FedEx 4 Target 1 GNC 1 Toys"R"Us 1 H&R Block 1 U-Haul 2 Hobby Lobby 1 UPS 7 JCPenney 1 Vans 3 Jamba Juice 1 Village Inn 1 Jones New York 1 Volkswagen 1 Justice 1 Walmart 2
Strongest AM radio stations in South Jordan:
KLLB (1510 AM; daytime; 10 kW; WEST JORDAN, UT; Owner: UNITED SECURITY FINANCIAL, INC.)
KWDZ (910 AM; 5 kW; SALT LAKE CITY, UT; Owner: ABC, INC.)
KIQN (1010 AM; 50 kW; TOOELE, UT)
KKDS (1060 AM; 10 kW; SOUTH SALT LAKE, UT; Owner: HOLIDAY BROADCASTING COMPANY)
KTKK (630 AM; 10 kW; SANDY, UT; Owner: UNITED BROADCASTING COMPANY)
KSL (1160 AM; 50 kW; SALT LAKE CITY, UT; Owner: BONNEVILLE HOLDING COMPANY)
KALL (700 AM; 50 kW; NORTH SALT LAKE CITY, UT; Owner: CITICASTERS LICENSES, L.P.)
KFNZ (1320 AM; 5 kW; SALT LAKE CITY, UT; Owner: CITADEL BROADCASTING COMPANY)
KBEE (860 AM; 10 kW; SALT LAKE CITY, UT; Owner: CITADEL BROADCASTING COMPANY)
KBJA (1640 AM; 10 kW; SANDY, UT; Owner: UNITED BROADCASTING COMPANY, INC)
KMRI (1550 AM; 10 kW; WEST VALLEY CITY, UT; Owner: KMRI RADIO, LLC)
KSOP (1370 AM; 5 kW; SOUTH SALT LAKE, UT; Owner: KSOP, INC.)
KNRS (570 AM; 5 kW; SALT LAKE CITY, UT; Owner: CITICASTERS LICENSES, L.P.)
Strongest FM radio stations in South Jordan:
KODJ (94.1 FM; SALT LAKE CITY, UT; Owner: CITICASTERS LICENSES, L.P.)
KUER-FM (90.1 FM; SALT LAKE CITY, UT; Owner: UNIVERSITY OF UTAH)
KBYU-FM (89.1 FM; PROVO, UT; Owner: BRIGHAM YOUNG UNIVERSITY)
KURR (99.5 FM; BOUNTIFUL, UT; Owner: CITICASTERS LICENSES, L.P.)
KBEE-FM (98.7 FM; SALT LAKE CITY, UT; Owner: CITADEL BROADCASTING COMPANY)
K248AK (97.5 FM; DRAPER, UT; Owner: CITICASTERS LICENSES, L.P.)
KSOP-FM (104.3 FM; SALT LAKE CITY, UT; Owner: KSOP, INC.)
K272DP (102.3 FM; TOOELE, UT; Owner: FAMILY STATIONS, INC.)
KRCL (90.9 FM; SALT LAKE CITY, UT; Owner: LISTENERS COMMUNITY RADIO OF UTAH)
KBZN (97.9 FM; OGDEN, UT; Owner: CAPITOL BROADCASTING, INC.)
KOSY-FM (106.5 FM; SPANISH FORK, UT; Owner: MERCURY BROADCASTING COMPANY, INC.)
KRSP-FM (103.5 FM; SALT LAKE CITY, UT; Owner: SIMMONS-SLC, LS, LLC)
KBER (101.1 FM; OGDEN, UT; Owner: CITADEL BROADCASTING COMPANY)
KISN-FM (97.1 FM; SALT LAKE CITY, UT; Owner: CLEAR CHANNEL BROADCASTING LICENSES, INC.)
KKAT (101.9 FM; OGDEN, UT; Owner: CITICASTERS LICENSES, L.P.)
KSFI (100.3 FM; SALT LAKE CITY, UT; Owner: SIMMONS-SLC, LS, LLC)
KUBL-FM (93.3 FM; SALT LAKE CITY, UT; Owner: CITADEL BROADCASTING COMPANY)
KCPX (105.7 FM; CENTERVILLE, UT; Owner: MERCURY BROADCASTING COMPANY, INC.)
KXRK (96.3 FM; PROVO, UT; Owner: SIMMONS-SLC, LS, LLC)
KQMB (102.7 FM; MIDVALE, UT; Owner: SIMMONS-SLC, LS, LLC)
TV broadcast stations around South Jordan:
KUTV (Channel 2; SALT LAKE CITY, UT; Owner: KUTV HOLDINGS, INC.)
KULC (Channel 9; OGDEN, UT; Owner: UTAH STATE BOARD OF REGENTS)
KUED (Channel 7; SALT LAKE CITY, UT; Owner: UNIVERSITY OF UTAH)
KBYU-TV (Channel 11; PROVO, UT; Owner: BRIGHAM YOUNG UNIVERSITY)
KEJT-LP (Channel 48; SALT LAKE CITY, UT; Owner: TELEMUNDO OF NORTHERN CALIFORNIA LICENSE CORP.)
K59GS (Channel 59; SALT LAKE CITY, UT; Owner: ALPHA & OMEGA COMMUNICATIONS, LLC)
KSL-TV (Channel 5; SALT LAKE CITY, UT; Owner: BONNEVILLE HOLDING COMPANY)
KUWB (Channel 30; OGDEN, UT; Owner: ACME TV LICENSES OF UTAH, LLC)
KTVX (Channel 4; SALT LAKE CITY, UT; Owner: CLEAR CHANNEL BROADCASTING LICENSES, INC.)
KJZZ-TV (Channel 14; SALT LAKE CITY, UT; Owner: LARRY H. MILLER COMMUNICATIONS CORP.)
KSTU (Channel 13; SALT LAKE CITY, UT; Owner: FOX TELEVISION STATIONS INC.)
KTMW (Channel 20; SALT LAKE CITY, UT; Owner: ALPHA & OMEGA COMMUNICATIONS, LLC)
KUBX-LP (Channel 58; SALT LAKE CITY, UT; Owner: EQUITY BROADCASTING CORPORATION)
K68FY (Channel 68; SALT LAKE CITY, UT; Owner: PRICE BROADCASTING, INC.)
K66FN (Channel 66; SALT LAKE CITY, UT; Owner: AZTECA BROADCASTING CORPORATION)
National Bridge Inventory (NBI) Statistics 35 Number of bridges203ft / 62.4m Total length1,024,095 Total average daily traffic206,560 Total average daily truck traffic
New bridges - historical statistics
1 1950-1959 1 1960-1969 2 1980-1989 9 1990-1999 10 2000-2009 11 2010-2019 1 2020-2022
See full National Bridge Inventory statistics for South Jordan, UT
Home Mortgage Disclosure Act Aggregated Statistics For Year 2009(Based on 6 full and 2 partial tracts) A) FHA, FSA/RHS & VA B) Conventional C) Refinancings D) Home Improvement Loans E) Loans on Dwellings For 5+ Families F) Non-occupant Loans on G) Loans On Manufactured Number Average Value Number Average Value Number Average Value Number Average Value Number Average Value Number Average Value Number Average Value
LOANS ORIGINATED 528 $241,680 408 $240,186 2,411 $246,158 40 $107,300 0 $0 62 $203,666 0 $0 APPLICATIONS APPROVED, NOT ACCEPTED 41 $254,868 37 $253,945 289 $280,013 8 $215,380 0 $0 16 $215,223 0 $0 APPLICATIONS DENIED 77 $267,905 36 $320,099 621 $277,381 26 $118,610 0 $0 32 $199,236 1 $67,000 APPLICATIONS WITHDRAWN 51 $270,308 38 $224,099 363 $272,169 13 $133,219 1 $128,000 12 $305,132 0 $0 FILES CLOSED FOR INCOMPLETENESS 6 $276,612 10 $359,872 79 $272,203 4 $57,500 0 $0 7 $154,857 0 $0
Aggregated Statistics For Year 2008(Based on 6 full and 2 partial tracts) A) FHA, FSA/RHS & VA B) Conventional C) Refinancings D) Home Improvement Loans E) Loans on Dwellings For 5+ Families F) Non-occupant Loans on G) Loans On Manufactured Number Average Value Number Average Value Number Average Value Number Average Value Number Average Value Number Average Value Number Average Value
LOANS ORIGINATED 279 $273,968 498 $291,127 1,419 $257,517 69 $94,990 1 $4,280,600 77 $255,207 2 $134,860 APPLICATIONS APPROVED, NOT ACCEPTED 15 $297,143 85 $316,976 208 $269,255 11 $188,264 0 $0 12 $192,700 1 $62,000 APPLICATIONS DENIED 58 $288,286 146 $397,976 564 $313,472 61 $202,799 0 $0 46 $306,807 5 $98,370 APPLICATIONS WITHDRAWN 44 $281,009 74 $379,547 258 $299,841 31 $230,945 0 $0 20 $261,843 0 $0 FILES CLOSED FOR INCOMPLETENESS 5 $250,422 15 $276,375 51 $374,210 10 $184,707 0 $0 2 $282,500 0 $0
Aggregated Statistics For Year 2007(Based on 6 full and 2 partial tracts) A) FHA, FSA/RHS & VA B) Conventional C) Refinancings D) Home Improvement Loans F) Non-occupant Loans on G) Loans On Manufactured Number Average Value Number Average Value Number Average Value Number Average Value Number Average Value Number Average Value
LOANS ORIGINATED 68 $261,259 1,382 $243,410 1,551 $250,512 176 $111,734 200 $233,514 0 $0 APPLICATIONS APPROVED, NOT ACCEPTED 6 $319,343 249 $225,477 207 $246,100 37 $140,186 33 $311,032 1 $40,000 APPLICATIONS DENIED 11 $248,964 418 $306,579 554 $285,277 116 $147,701 98 $281,928 4 $49,158 APPLICATIONS WITHDRAWN 10 $272,057 140 $257,128 236 $240,004 33 $156,327 47 $323,091 0 $0 FILES CLOSED FOR INCOMPLETENESS 0 $0 24 $256,952 69 $300,134 7 $73,369 9 $205,592 0 $0
Aggregated Statistics For Year 2006(Based on 6 full and 2 partial tracts) A) FHA, FSA/RHS & VA B) Conventional C) Refinancings D) Home Improvement Loans E) Loans on Dwellings For 5+ Families F) Non-occupant Loans on G) Loans On Manufactured Number Average Value Number Average Value Number Average Value Number Average Value Number Average Value Number Average Value Number Average Value
LOANS ORIGINATED 33 $207,879 2,158 $202,741 1,645 $202,957 181 $85,563 0 $0 479 $179,612 2 $123,000 APPLICATIONS APPROVED, NOT ACCEPTED 2 $133,415 272 $201,839 243 $198,901 37 $96,190 1 $41,000 75 $171,050 0 $0 APPLICATIONS DENIED 3 $208,703 512 $218,253 527 $219,372 92 $107,971 0 $0 121 $210,894 5 $26,836 APPLICATIONS WITHDRAWN 5 $175,018 239 $199,259 305 $219,944 26 $167,230 0 $0 84 $153,821 2 $134,500 FILES CLOSED FOR INCOMPLETENESS 0 $0 32 $216,081 86 $240,338 4 $90,288 0 $0 11 $201,973 0 $0
Aggregated Statistics For Year 2005(Based on 6 full and 2 partial tracts) A) FHA, FSA/RHS & VA B) Conventional C) Refinancings D) Home Improvement Loans F) Non-occupant Loans on G) Loans On Manufactured Number Average Value Number Average Value Number Average Value Number Average Value Number Average Value Number Average Value
LOANS ORIGINATED 64 $178,907 1,851 $177,462 1,316 $182,968 110 $77,844 262 $150,966 3 $184,667 APPLICATIONS APPROVED, NOT ACCEPTED 1 $191,220 188 $156,294 212 $170,324 16 $75,188 22 $129,377 1 $16,000 APPLICATIONS DENIED 5 $190,780 368 $177,893 512 $197,232 71 $83,478 71 $165,836 4 $47,585 APPLICATIONS WITHDRAWN 4 $141,198 222 $175,172 290 $203,600 40 $182,590 29 $150,463 0 $0 FILES CLOSED FOR INCOMPLETENESS 5 $151,466 34 $187,220 141 $208,826 6 $127,853 10 $122,356 2 $225,500
Aggregated Statistics For Year 2004(Based on 6 full and 2 partial tracts) A) FHA, FSA/RHS & VA B) Conventional C) Refinancings D) Home Improvement Loans F) Non-occupant Loans on G) Loans On Manufactured Number Average Value Number Average Value Number Average Value Number Average Value Number Average Value Number Average Value
LOANS ORIGINATED 96 $172,182 1,093 $178,810 1,378 $185,914 75 $51,258 92 $181,401 0 $0 APPLICATIONS APPROVED, NOT ACCEPTED 6 $158,653 164 $173,351 222 $192,376 14 $107,091 28 $162,247 0 $0 APPLICATIONS DENIED 11 $184,266 203 $173,998 467 $201,047 51 $47,301 41 $191,320 3 $87,667 APPLICATIONS WITHDRAWN 14 $157,527 120 $168,174 293 $193,546 18 $56,914 9 $124,394 0 $0 FILES CLOSED FOR INCOMPLETENESS 3 $165,270 25 $194,572 108 $209,545 5 $106,658 5 $183,444 0 $0
Aggregated Statistics For Year 2003(Based on 6 full and 2 partial tracts) A) FHA, FSA/RHS & VA B) Conventional C) Refinancings D) Home Improvement Loans F) Non-occupant Loans on Number Average Value Number Average Value Number Average Value Number Average Value Number Average Value
LOANS ORIGINATED 88 $164,088 956 $177,307 3,110 $167,094 57 $48,180 87 $156,756 APPLICATIONS APPROVED, NOT ACCEPTED 2 $169,595 97 $185,024 330 $168,646 7 $23,220 9 $122,869 APPLICATIONS DENIED 3 $149,687 122 $156,709 544 $194,727 47 $36,256 34 $143,306 APPLICATIONS WITHDRAWN 2 $179,500 104 $176,808 346 $189,986 11 $46,358 16 $159,163 FILES CLOSED FOR INCOMPLETENESS 0 $0 24 $217,357 144 $200,933 2 $9,260 3 $220,920
Aggregated Statistics For Year 1999(Based on 2 full tracts) A) FHA, FSA/RHS & VA B) Conventional C) Refinancings D) Home Improvement Loans E) Loans on Dwellings For 5+ Families F) Non-occupant Loans on Number Average Value Number Average Value Number Average Value Number Average Value Number Average Value Number Average Value
LOANS ORIGINATED 26 $137,937 483 $169,127 798 $138,820 82 $36,856 1 $301,420 24 $126,533 APPLICATIONS APPROVED, NOT ACCEPTED 2 $135,915 49 $175,328 148 $159,303 11 $55,427 0 $0 5 $113,258 APPLICATIONS DENIED 4 $148,880 91 $197,703 246 $162,856 24 $32,509 0 $0 10 $137,852 APPLICATIONS WITHDRAWN 1 $138,400 56 $180,248 223 $139,242 15 $77,940 0 $0 4 $178,978 FILES CLOSED FOR INCOMPLETENESS 3 $102,990 21 $168,792 124 $154,735 1 $42,820 0 $0 3 $210,423
Detailed HMDA statistics for the following Tracts:
1128.07
, 1130.07 , 1130.08 , 1130.09 , 1130.10 , 1130.11 , 1130.12 , 1131.03
Private Mortgage Insurance Companies Aggregated Statistics For Year 2009(Based on 6 full and 2 partial tracts) A) Conventional B) Refinancings C) Non-occupant Loans on Number Average Value Number Average Value Number Average Value
LOANS ORIGINATED 84 $272,492 57 $294,471 1 $208,000 APPLICATIONS APPROVED, NOT ACCEPTED 27 $313,109 48 $304,581 1 $109,370 APPLICATIONS DENIED 13 $289,538 13 $293,036 0 $0 APPLICATIONS WITHDRAWN 5 $359,400 11 $323,978 0 $0 FILES CLOSED FOR INCOMPLETENESS 6 $430,318 1 $342,000 1 $1,445,000
Aggregated Statistics For Year 2008(Based on 6 full and 2 partial tracts) A) Conventional B) Refinancings C) Non-occupant Loans on Number Average Value Number Average Value Number Average Value
LOANS ORIGINATED 184 $308,005 88 $308,354 12 $291,263 APPLICATIONS APPROVED, NOT ACCEPTED 52 $313,041 42 $336,216 3 $229,390 APPLICATIONS DENIED 8 $292,685 9 $244,492 2 $180,810 APPLICATIONS WITHDRAWN 15 $367,912 7 $284,873 3 $655,667 FILES CLOSED FOR INCOMPLETENESS 3 $443,000 3 $205,690 4 $368,018
Aggregated Statistics For Year 2007(Based on 6 full and 2 partial tracts) A) Conventional B) Refinancings C) Non-occupant Loans on Number Average Value Number Average Value Number Average Value
LOANS ORIGINATED 195 $295,707 95 $323,051 20 $298,398 APPLICATIONS APPROVED, NOT ACCEPTED 14 $338,276 21 $370,391 3 $260,033 APPLICATIONS DENIED 4 $248,215 2 $262,740 2 $234,500 APPLICATIONS WITHDRAWN 7 $372,551 4 $457,452 1 $879,430 FILES CLOSED FOR INCOMPLETENESS 1 $229,000 1 $180,610 0 $0
Aggregated Statistics For Year 2006(Based on 6 full and 2 partial tracts) A) Conventional B) Refinancings C) Non-occupant Loans on Number Average Value Number Average Value Number Average Value
LOANS ORIGINATED 97 $272,825 58 $266,924 21 $227,119 APPLICATIONS APPROVED, NOT ACCEPTED 17 $262,598 17 $250,443 3 $288,357 APPLICATIONS DENIED 3 $498,000 2 $437,500 1 $308,000 APPLICATIONS WITHDRAWN 12 $323,097 2 $265,000 3 $368,720 FILES CLOSED FOR INCOMPLETENESS 0 $0 0 $0 0 $0
Aggregated Statistics For Year 2005(Based on 6 full and 2 partial tracts) A) Conventional B) Refinancings C) Non-occupant Loans on Number Average Value Number Average Value Number Average Value
LOANS ORIGINATED 93 $238,279 93 $243,881 14 $217,784 APPLICATIONS APPROVED, NOT ACCEPTED 14 $234,145 19 $241,848 0 $0 APPLICATIONS DENIED 2 $364,000 0 $0 2 $364,000 APPLICATIONS WITHDRAWN 9 $223,537 10 $271,798 5 $227,854 FILES CLOSED FOR INCOMPLETENESS 0 $0 0 $0 0 $0
Aggregated Statistics For Year 2004(Based on 6 full and 2 partial tracts) A) Conventional B) Refinancings C) Non-occupant Loans on Number Average Value Number Average Value Number Average Value
LOANS ORIGINATED 113 $226,707 124 $218,361 13 $218,424 APPLICATIONS APPROVED, NOT ACCEPTED 27 $223,422 43 $210,319 6 $263,013 APPLICATIONS DENIED 0 $0 2 $176,170 0 $0 APPLICATIONS WITHDRAWN 13 $219,076 14 $211,544 2 $197,955 FILES CLOSED FOR INCOMPLETENESS 1 $377,000 1 $201,000 0 $0
Aggregated Statistics For Year 2003(Based on 6 full and 2 partial tracts) A) Conventional B) Refinancings C) Non-occupant Loans on Number Average Value Number Average Value Number Average Value
LOANS ORIGINATED 191 $213,265 392 $206,024 17 $198,141 APPLICATIONS APPROVED, NOT ACCEPTED 36 $232,085 112 $210,063 5 $182,688 APPLICATIONS DENIED 1 $264,190 11 $173,852 0 $0 APPLICATIONS WITHDRAWN 9 $205,863 36 $211,433 2 $185,175 FILES CLOSED FOR INCOMPLETENESS 0 $0 3 $266,333 0 $0
Aggregated Statistics For Year 1999(Based on 2 full tracts) A) Conventional B) Refinancings C) Non-occupant Loans on Number Average Value Number Average Value Number Average Value
LOANS ORIGINATED 148 $185,137 98 $181,617 3 $160,440 APPLICATIONS APPROVED, NOT ACCEPTED 10 $193,701 25 $199,242 0 $0 APPLICATIONS DENIED 12 $188,557 8 $179,199 1 $64,450 APPLICATIONS WITHDRAWN 4 $157,358 9 $163,400 0 $0 FILES CLOSED FOR INCOMPLETENESS 1 $212,180 3 $201,797 0 $0
Detailed PMIC statistics for the following Tracts:
1128.07
, 1130.07 , 1130.08 , 1130.09 , 1130.10 , 1130.11 , 1130.12 , 1131.03 Fire-safe hotels and motels in South Jordan, Utah:
Sleep Inn Of South Jordan, 10676 S 300 W, South Jordan, Utah 84095 Phone: (801) 572-2020, Fax: (801) 572-2459
Country Inn & Suites South Jordan, 10499 S Jordan Gtwy, South Jordan, Utah 84095 Phone: (801) 553-1151, Fax: (801) 553-1161
Home2 Suites Salt Lake City/South Jordan, 10704 South Riv Front Pkwy, South Jordan, Utah 84095 Phone: (801) 446-8800
Holiday Inn South Jordan SLC South, 10499 S Jordan Gtwy, South jordan, Utah 84095 Phone: (801) 553-1151, Fax: (801) 553-1161
Embassy Suites by Hilton South Jordan, 10333 So, South jordan, Utah 84095 Phone: (800) 445-8667, Fax: (801) 617-4141
All 5 fire-safe hotels and motels in South Jordan, Utah
Most common first names in South Jordan, UT among deceased individuals Name Count Lived (average)
Helen 22 85.0 years John 17 81.0 years William 16 75.1 years Robert 16 80.5 years Mary 16 80.9 years Margaret 14 86.0 years James 13 81.1 years Ruth 12 80.7 years Richard 12 77.4 years Betty 12 77.9 years
Most common last names in South Jordan, UT among deceased individuals Last name Count Lived (average)
Smith 17 78.6 years Anderson 13 85.7 years Beckstead 11 86.7 years Williams 11 81.6 years Johnson 11 83.3 years Holt 10 80.3 years Clark 9 80.9 years Richards 7 79.7 years Davis 7 80.4 years Wright 7 74.6 years
South Jordan compared to Utah state average:
Unemployed percentage significantly below state average. Foreign-born population percentage above state average. Renting percentage below state average. Length of stay since moving in below state average. House age significantly below state average. Number of college students above state average. Percentage of population with a bachelor's degree or higher above state average. South Jordan on our top lists :
#2 on the list of "Top 101 cities with the smallest household incomes disparities (population 50,000+)"
#2 on the list of "Top 100 cities with biggest houses (pop. 50,000+)"
#5 on the list of "Top 101 cities with the most cars per house, population 50,000+"
#6 on the list of "Top 101 cities with the least people below 50% of the poverty level (population 50,000+)"
#6 on the list of "Top 101 cities with the lowest number of murders per 100,000 residents (population 50,000+)"
#7 on the list of "Top 101 cities with the lowest percentage of single-parent households, population 50,000+"
#8 on the list of "Top 101 cities with the smallest percentage of unmarried partner households (population 50,000+)"
#9 on the list of "Top 101 cities with the smallest percentage of elementary and middle school students in private schools (5,000+ students)"
#12 on the list of "Top 100 cities with highest median household income and median resident age less than 35 (pop. 50,000+)"
#12 on the list of "Top 100 cities with newest houses (pop. 50,000+)"
#13 on the list of "Top 101 cities with most building permits per 10,000 residents (population 50,000+)"
#20 on the list of "Top 101 cities with largest percentage population increases in the 1990s) (population 50,000+)"
#22 on the list of "Top 101 cities with the largest percentage population increase from 2000 (population 50,000+)"
#23 on the list of "Top 101 cities with the smallest percentage of high school students in private schools (3,000+ students)"
#24 on the list of "Top 100 least racially diverse cities (pop. 50,000+)"
#25 on the list of "Top 101 cities with the least people below the poverty level (population 50,000+)"
#26 on the list of "Top 101 cities with the lowest number of robberies per 100,000 residents (population 50,000+)"
#32 on the list of "Top 101 cities with largest percentage of males in occupations: management occupations (population 50,000+)"
#33 on the list of "Top 100 fastest growing cities from 2000 to 2014 (pop. 50,000+)"
#36 on the list of "Top 101 cities with the highest percentage of workers working at home, population 50,000+"
#66 (84088) on the list of "Top 101 zip codes with the largest percentage of English first ancestries (pop 5,000+)"
#78 (84088) on the list of "Top 101 zip codes with the largest percentage of Danish first ancestries (pop 5,000+)"
#1 on the list of "Top 101 counties with the most Other adherents"
#1 on the list of "Top 101 counties with the most Other congregations"
#4 on the list of "Top 101 counties with the lowest percentage of residents that smoked 100+ cigarettes in their lives"
#11 on the list of "Top 101 counties with the highest Nitrogen Dioxide air pollution readings in 2012 (ppm)"
#14 on the list of "Top 101 counties with the highest number of births per 1000 residents 2007-2013"
Top Patent Applicants
Steven D. Jensen (34)
Marty L. Stout (21)
James J. Murphy (17)
Joshua Aune (16)
David K. Lambert (16)
Suku Kim (16)
S. Elangovan (15)
Philip James Scalzo (13)
Derek Graham (13)
Jeremy W. Snow (12)
Total of 710 patent applications in 2008-2024.
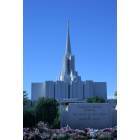
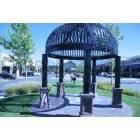


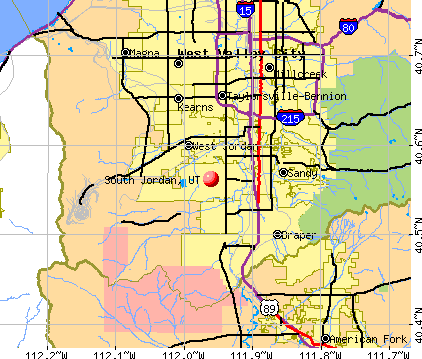


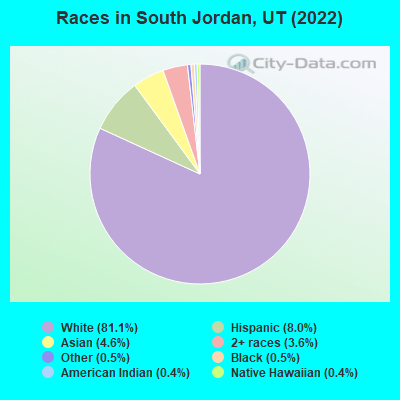
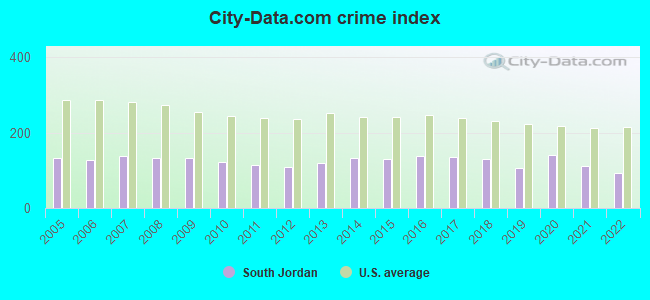
 Recent articles from our blog. Our writers, many of them Ph.D. graduates or candidates, create easy-to-read articles on a wide variety of topics.


 (3.2 miles
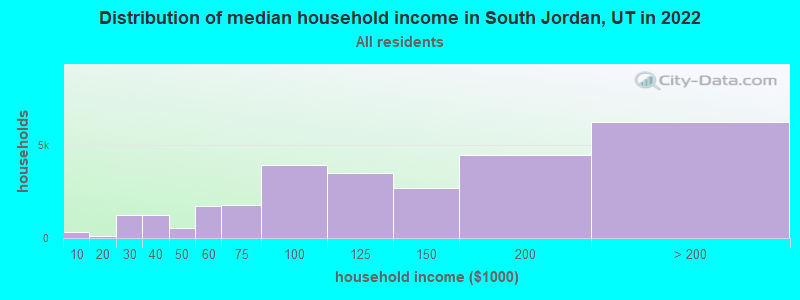
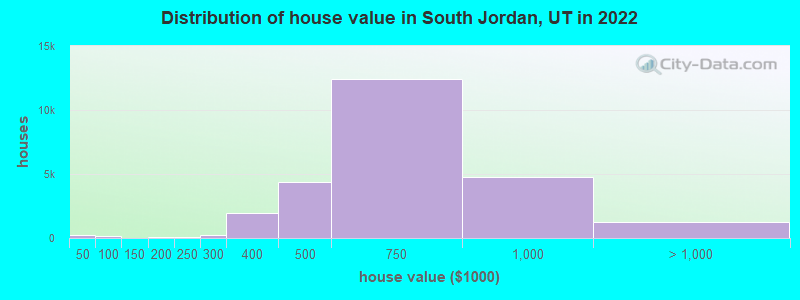

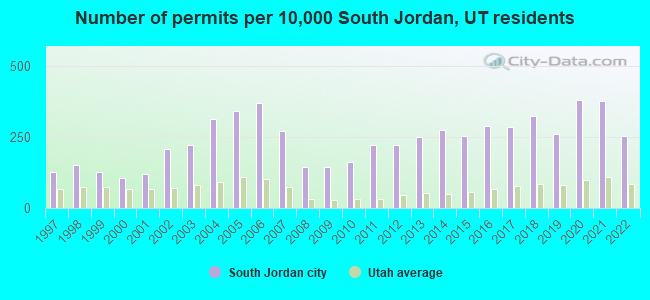
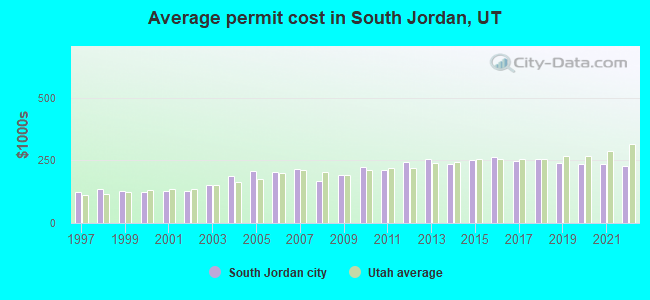
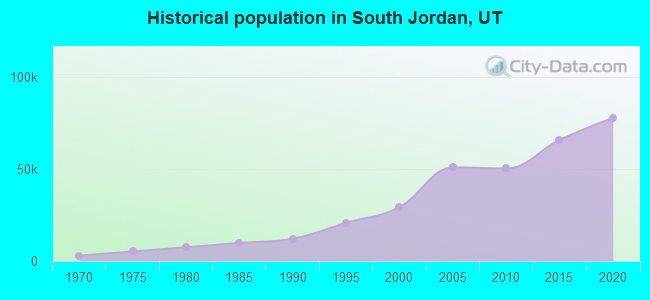
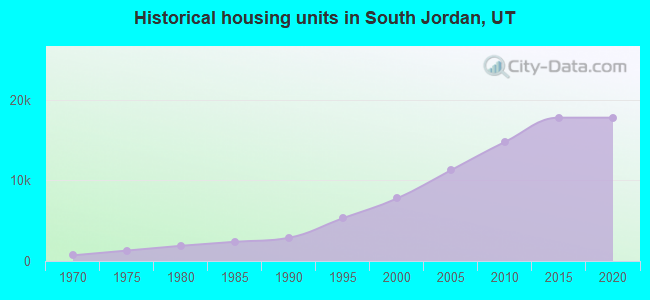
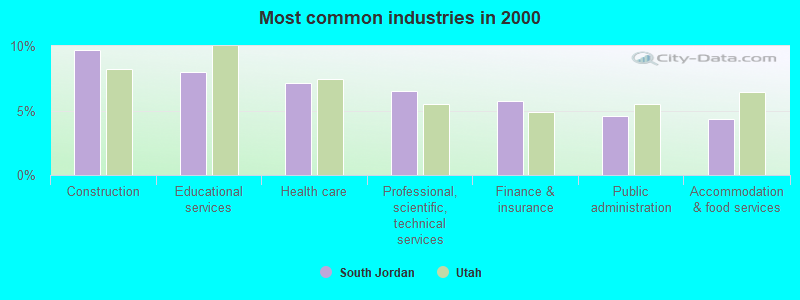
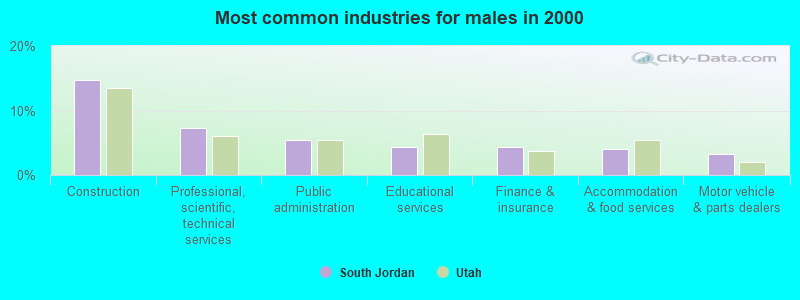
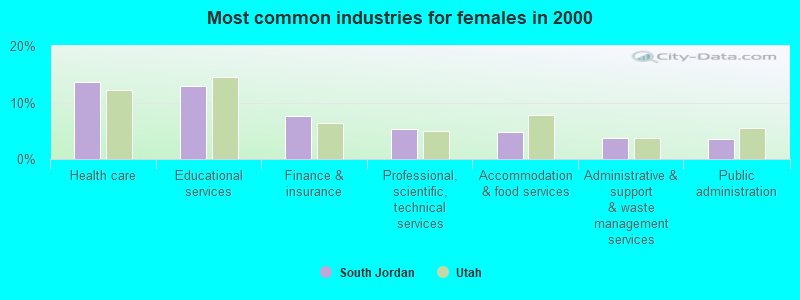
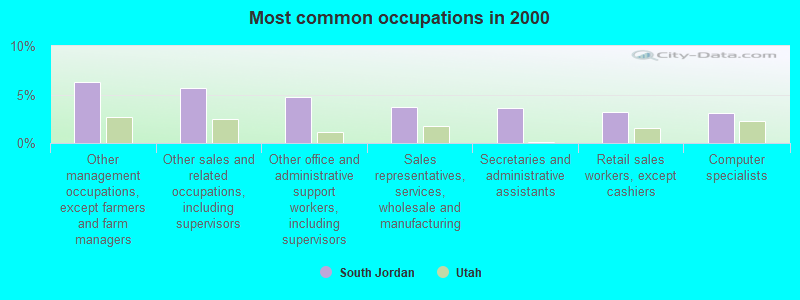
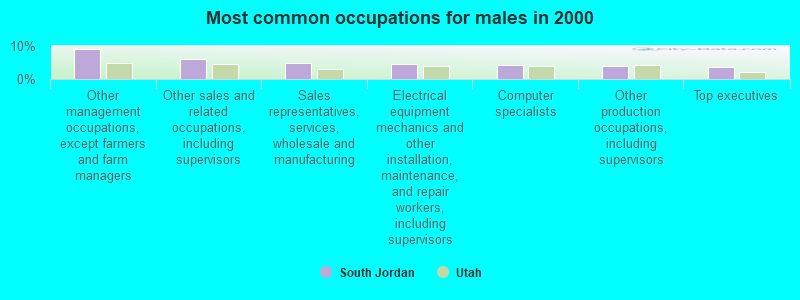
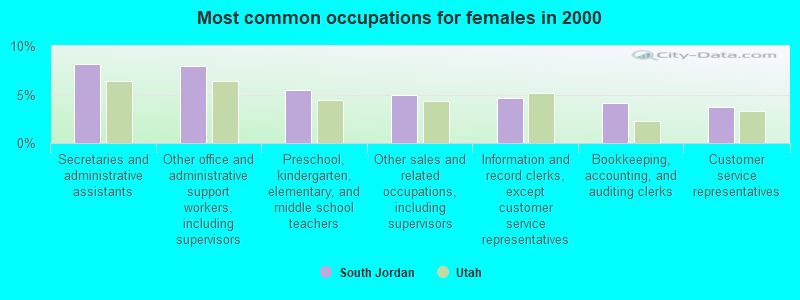
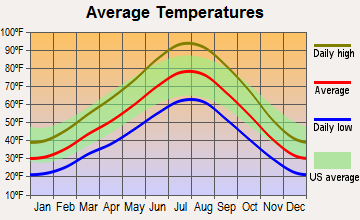
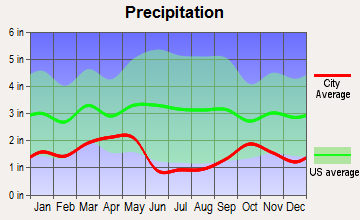
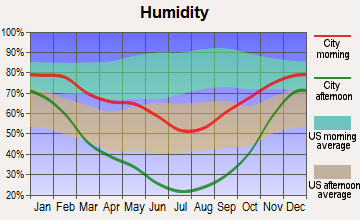
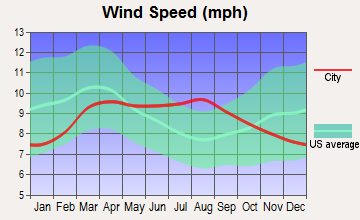
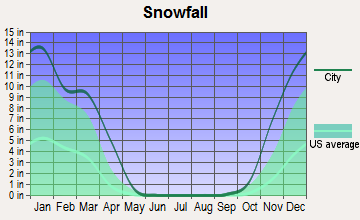
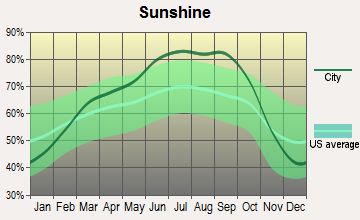
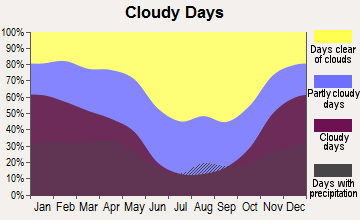

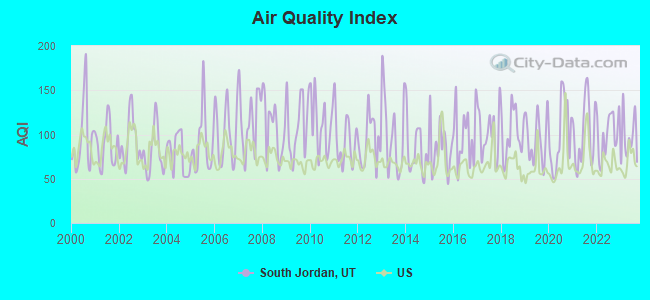
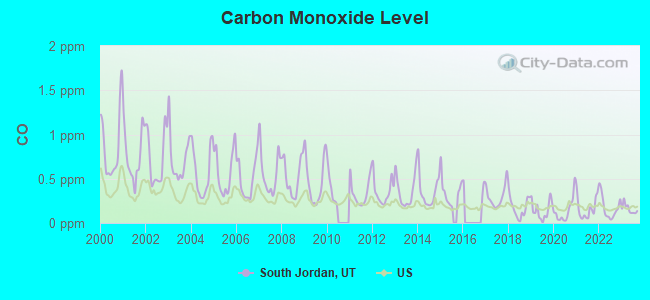
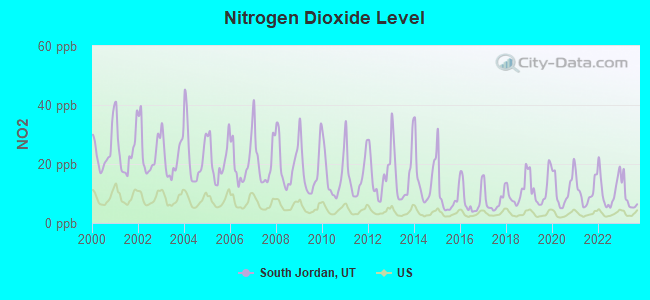
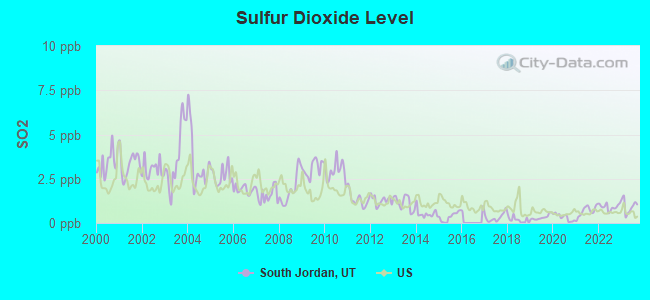
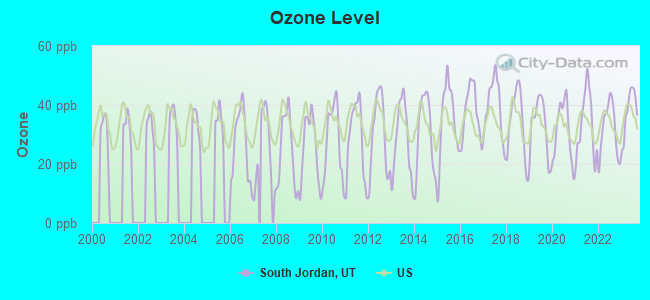
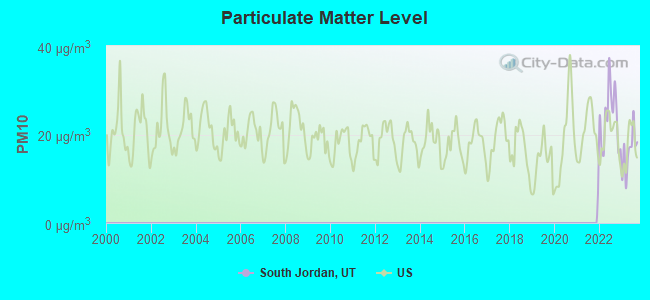
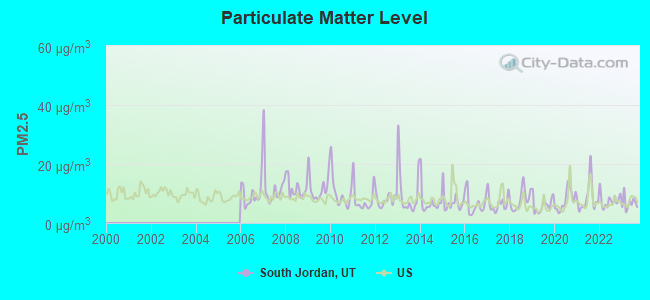
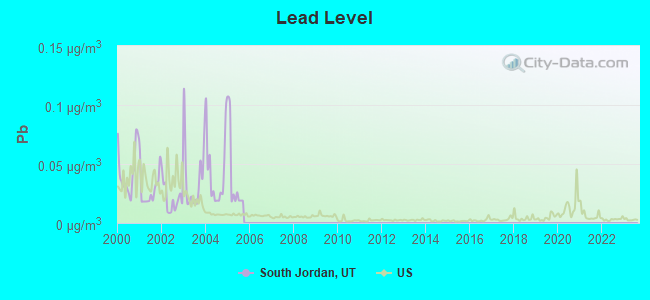
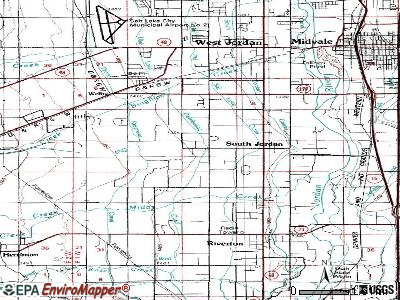
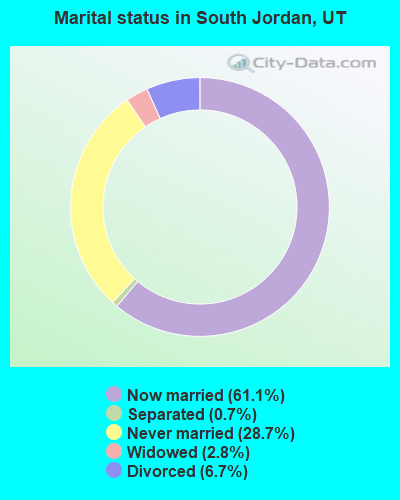
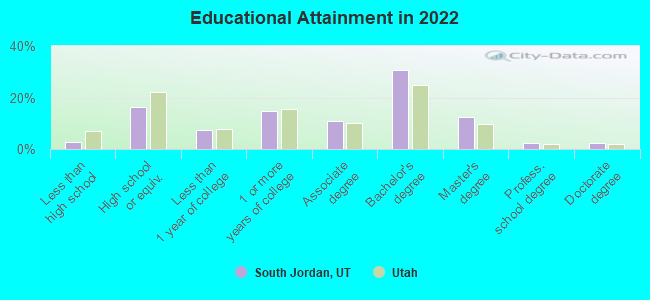
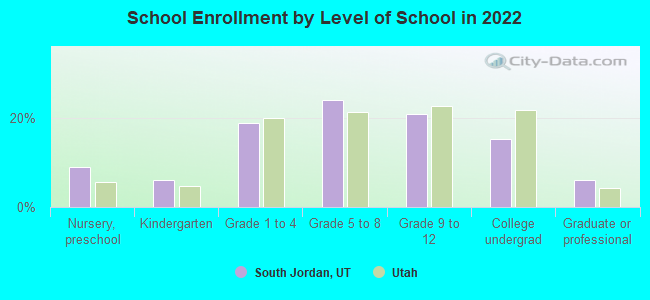
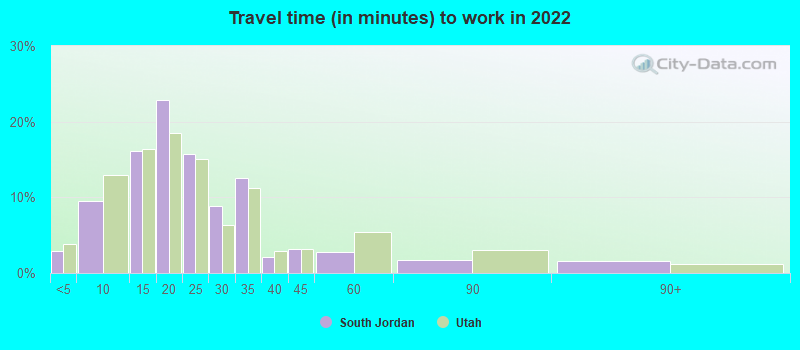
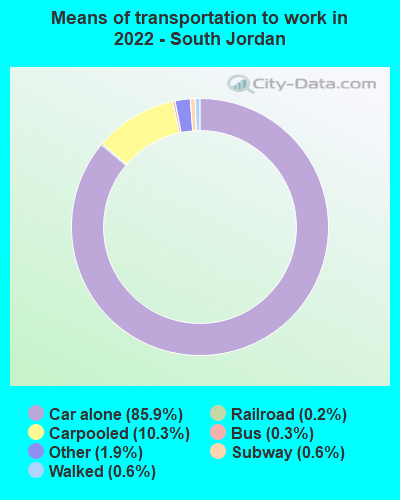
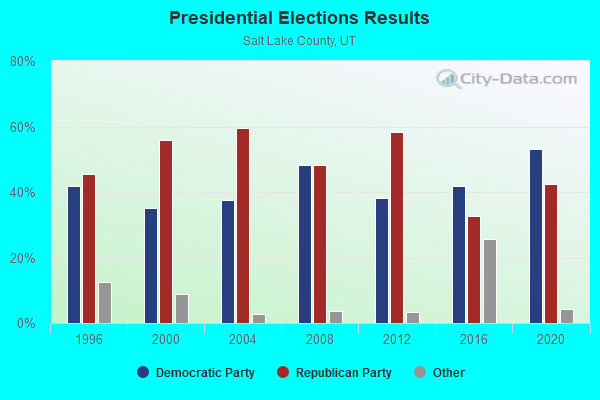
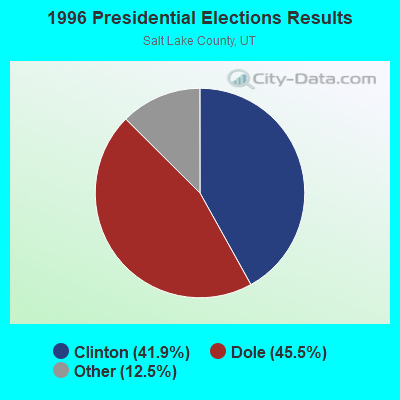
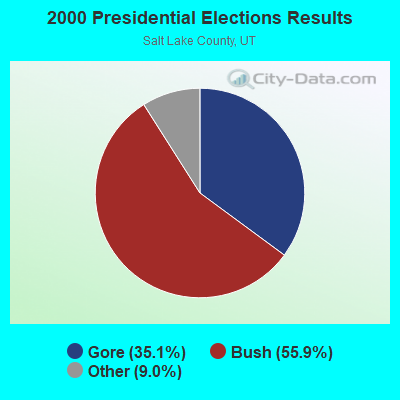
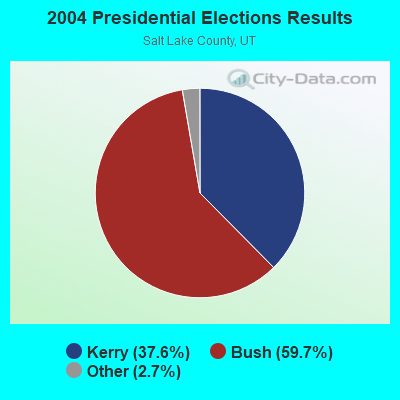
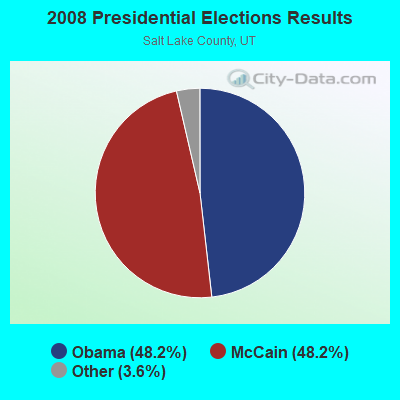

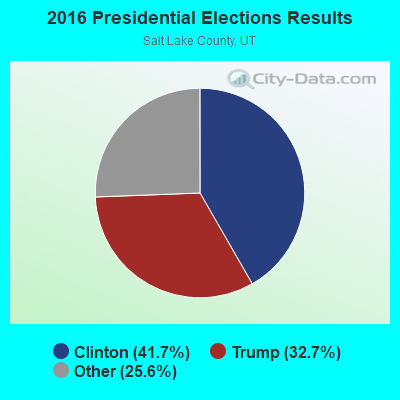
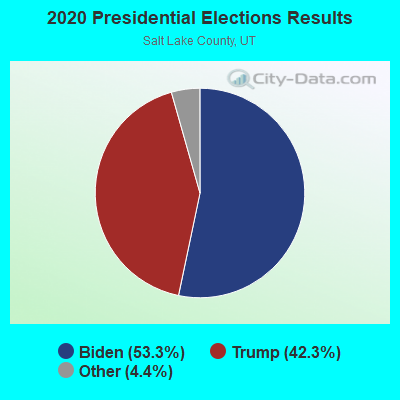
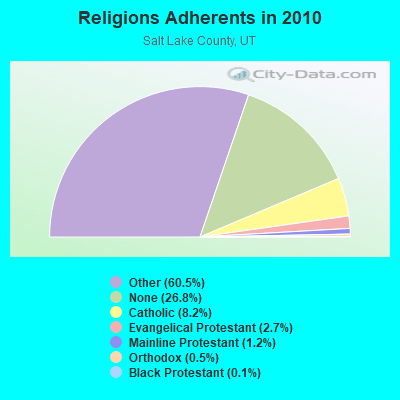
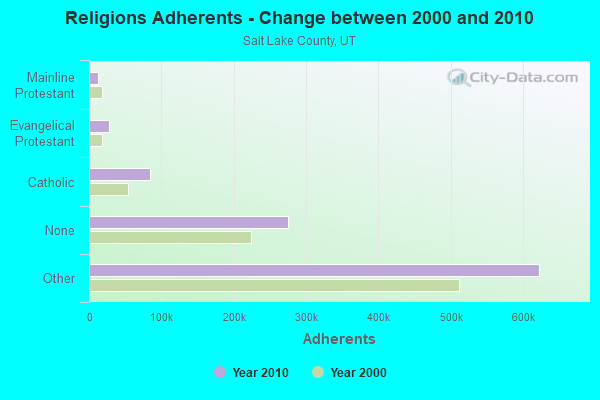
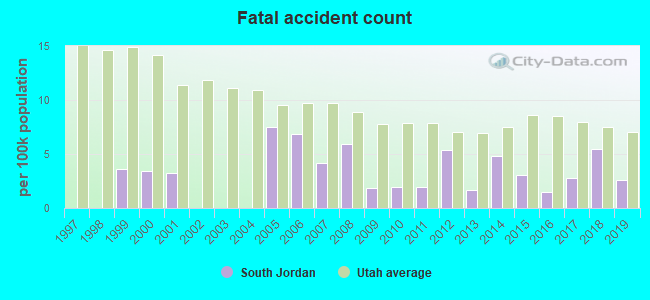
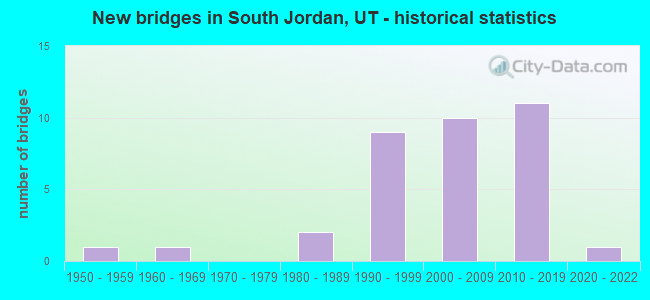
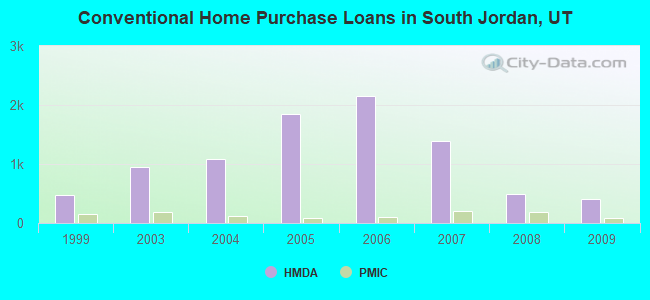
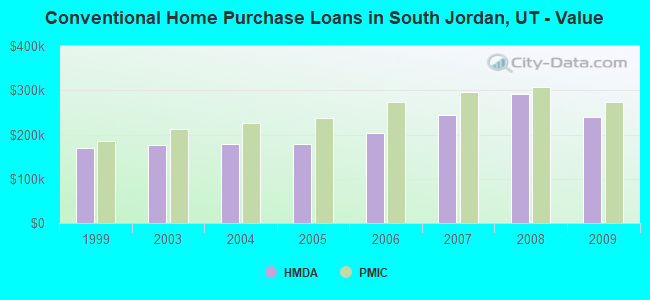
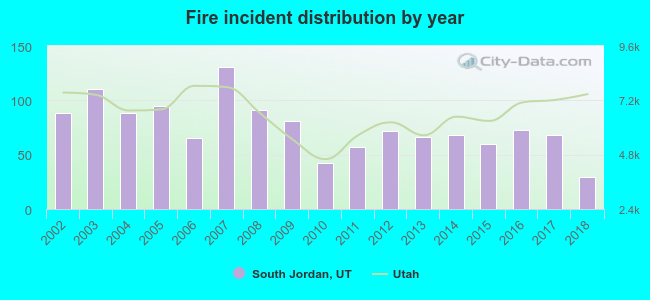 According to the data from the years 2002 - 2018 the average number of fire incidents per year is 76. The highest number of reported fires - 131 took place in 2007, and the least - 29 in 2018. The data has a declining trend.
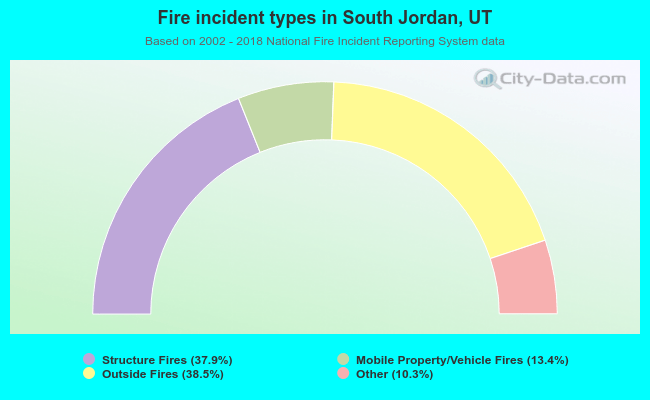 When looking into fire subcategories, the most reports belonged to: Outside Fires (38.5%), and Structure Fires (37.9%).